III. Significance and an example of joint monitoringZoltán Hlavatý, Erika Lakatosová, Ľubomír Banský, Dalibor Rodák, Katarína Kučárová This publication reviews the monitoring and evaluates the effects of Gabčíkovo structures, measures according to the Agreement 1995 [4], and other realised measures, on the surrounded natural environment during the last decade. The Gabčíkovo project has become a widely discussed object in the internal and international political sphere, and also in other spheres such as science and technology. There have been a large number of contradictory opinions expressed, which have regularly tended to imbue discussions with a highly emotive charge. For most such discussions, the rational content was indirectly proportional to the emotive charge. This usually results in only a very small possibility of mutual agreement and serious common action plan (Krcho in [1]). From our point of view, it is important to discuss this topic only in a scientific sphere, which is based on:
Discussion on such a basis is a requirement for mutual agreement. Monitoring and studying such a highly organized spatial system, as is nature, requires good concepts and the cooperation of numerous scientific disciplines. From an environmental point of view, it is necessary to study not only the natural environment, but also the influence human activities on the components of the natural environment, and the reaction of nature to the various human impacts, and, also vice versa. It is natural that most discussions based on incorrectly or insufficiently defined expressions or knowledge are not scientifically constructive and, as a consequence of information distortion, they are mix and confuse meanings; they do not lead, and in principle they cannot lead, to scientifically valuable conclusions. When such incorrect expressions are used in non-scientific branches, but referring to science, the consequences are negative, even tragic. The result is misinformation, which becomes worse when it is joined to negative argumentation. Such methods are sometimes used by advocacy campaigns, and as communication skills in brainstorming. Careful and well proposed monitoring could help to overcome using incorrect discussion and campaigns referring to science using incorrect and generalised data, as for example “ecological catastrophe”, “destruction of biotopes”, “expiration of the last inland delta”, etc. This publication, based on Joint Slovak – Hungarian monitoring, should help to overcame such advocacy campaigns, which are using incorrect data and rallying cries. Monitoring means observing, measuring, collecting and recording information. According to Article 7 of the Convention on Biological Diversity, monitoring has the following purposes:
A typical example of such monitoring is the succession of publications “Gabčíkovo Part of the hydroelectric Power Project - Environmental Impact Review, (Evaluation Based on two Year Monitoring), published by the Faculty of Natural sciences, Comenius University in Bratislava, in 1995” [1, 2,3] or the “Agreement between the Government of the Slovak Republic and the Government of Hungary About Certain Temporary Measures and Discharges to the Danube and Mosoni Danube, Signed April 19, 1995 [4]. Monitoring of the environment should give information about the impact of various activities and realized measures on the natural conditions, including natural processes. The impact of the hydropower structures and realised measures is expressed via changes in the hydrological regime of surface and ground water, further through the changes in the zone of aeration (zone between surface and the ground water level), which include the soil horizon with plant roots, and further on through the changes in flora and fauna. The goal of the monitoring is not only to estimate the changes after putting the hydropower structures and measures into operation, but mainly to observe, evaluate, and to manage the water regime in such a way that the managed processes lead to improvement in many various parts of environment. The Gabčíkovo hydropower structures include many technical means for managing the surface and ground water regime and thus also have large possibilities to positive influence the environment. The final aim of monitoring is not to define a "status quo", nor so called conservation or restriction measures, but to define measures for ensuring development from many points of view, perhaps especially from the viewpoint of biodiversity. This means ensuring sustainable development in the broadest meaning of term. Continuous development, which is called "sustainable development", can proceed only through improvements in knowledge, development of science, study of natural processes and continuous development of the educational level of inhabitants, including technical disciplines. Monitoring of the impacts of the hydropower structures and man's other activities is a basis for such processes. Monitoring is based on sampling and measuring data. The method of stationary monitoring plots might not represent the whole monitoring area, if monitoring plots are not correctly chosen. The recommendation is to measure data in profiles and to map the area of individual monitoring components. Sampling should, therefore, be purposeful, based on typical structures of communities - taxocoenoses. In the case of flora, it is better to monitor growing parameters of typical representatives of flora. Estimates of biodiversity should refer to the whole area of inundation, or at least to its characteristic units. The interpretation of monitoring should be transformed into an examination of the whole area, using causal relations between the ground water level and the changes of bio-indicative characteristics. The interpretation of changes in surface and ground water levels should, therefore, be included in the interpretation of the hydropower project impact on biota. A typical example of such is the monitoring of forestry. The impact of the Gabčíkovo structures on biota occurs through changes in the surface and ground water level. These changes are manifested through changes in the soil moisture conditions. If there is an increase in the ground water level due to the construction of hydropower structures, than there is also an increase of soil moisture, or occasionally the moisture may remain unchanged at some depths, but there is in no case a decrease in the moisture caused by the engineering works. Reciprocally the same is valid. If there is a decrease in the ground water level due to the construction of the engineering structures, then there is also a decrease in the soil moisture, or occasionally the moisture may remain unchanged at some depths, but there is in no case an increase in the moisture caused by the engineering works. Therefore, neither an increase of the moisture in the zone of aeration due to a decrease of ground water level, nor a decrease of the moisture in the zone of aeration due to an increase of ground water level, can happen. Therefore monitoring of ground water level changes is the primary scientific basis for interpreting the biota monitoring data. In an interpretation of the impact on the environment, a decrease of the ground water level means changes into more hygrophobe (dry) biocoenoses. An increase of the ground water level means changes into the more hygrophilous (wet) biocoenoses. If the criterion is accepted that hygrophilous biocoenoses are more valuable, more original or native in the floodplain area, that they have higher biodiversity and higher genetic diversity, then it is possible to define areas with negative and positive changes. Areas whose ground water levels have decreased have suffered negative changes; areas whose ground water levels have increased have enjoyed positive changes.
III.1. Review of joint monitoringEnvironmental monitoring in the area of the Gabčíkovo part of the hydroelectric power project on the Slovak territory is based on the “Agreement” between the Government of the Slovak Republic and the Government of Hungary [4] and the Water law decision of the Environmental authority (Krajský úrad, odbor životného prostredia, W/308/2001/-ONR, of 18.12.2001). The Joint monitoring content usually consists of topics divided into the following chapters: - Preface o Antecedents o Goals of the Joint monitoring o Joint monitoring activities in each particular year of evaluation o Fulfilment of recommendations from the Joint Annual Report in particular year - Part 1: Surface water levels and flow rates o Discharge into the Danube downstream of Čunovo o Discharge into the Mosoni branch of the Danube o Water distribution on the Hungarian territory o Water supply into the inundation area o Water supply into the Mosoni branch of the Danube o The Danube water level characteristics on the Čunovo-Vámosszabadi stretch - Part 2: Surface water quality o General evaluation of the actual hydrological year o Basic physical and chemical parameters o Cations and anions o Nutrients o Oxygen and organic carbon regime parameters o Metals o Biological and microbiological parameters o Quality of sediments o Differences in data measured by the Slovak and Hungarian Parties o Conclusions - Part 3: Ground water regime o Joint evaluation of ground water regime o Conclusions - Part 4: Ground water quality o Hungarian territory o Slovak territory o Conclusions - Part 5: Soil moisture monitoring o Data collection methods o Data presentation methods o Evaluation of results on the Hungarian territory o Evaluation of methods on the Slovak territory - Part 6: Forest monitoring o The Slovak territory o The Hungarian territory - Part 7: Biological monitoring o Phytocoenology o Terrestrial molluscs o Aquatic macrophytes o Aquatic molluscs o Dragonflies (Odonata) o Crustaceans (Cladocera, Copepoda) o Caddis flies and Mayflies (Trichoptera, Ephemeroptera) o Fish (Osteichtyas) - Part 8: Conclusions o Concluding statements o Proposals III.2 Example of Joint Annual ReportAn example of a Joint Annual Report on environmental monitoring in 2003 [7] is given in shortened form in following text. The full text, some other publications, and details are available on www.gabcikovo.gov.sk. III.2.1 PrefaceAntecedents The Slovak Party, according to the intergovernmental Agreement, has undertaken to release an annual average discharge of 400 m3s-1 into the Danube downstream of the Čunovo dam, and 43 m3s-1 into the Mosoni branch of the Danube and the right side seepage canal, depending on hydrological and technical conditions described in the Appendices No. 1 and 2 of the Agreement. The Hungarian Party, according to the Agreement, constructed a submerged weir in the common section of the Danube at rkm 1843, and put it into operation in June 1995. This weir enables the supply of water (up to 250 m3s-1) into the river branches in the Hungarian inundation area. The water discharged into the Mosoni branch of the Danube ensures the water supply of the Mosoni Danube and branches in the Hungarian flood-protected area. Observation results and measured data in tabular and graphical forms, together with their evaluation, create the National Annual Reports, prepared by the Parties themselves according to Article 3 of the Agreement [5, 6]. Every Joint Annual Report is elaborated jointly and is based on the approved and mutually exchanged National Reports. The present (shorten example) report is the ninth Joint Annual Report on the environmental monitoring [7] and gives an evaluation concerning the hydrological year 2003. The evaluation of the Slovak side [6] is based on the data collected by the Slovak Hydro-meteorological Institute, Faculty of Natural Sciences of Comenius University, the Slovak Academy of Sciences, Forest Research Institute, Soil Science and Conservation Research Institute, West Slovakia’s Waterworks Company, Bratislava’s Waterworks Company, Slovak Water Management Authority, Water Research Institute and Ground Water Consulting Ltd. The Plenipotentiary of the Government of the Slovak Republic coordinates the data exchange and the evaluation of the monitoring under the frame of the joint monitoring for the Construction and Operation of the Gabčíkovo-Nagymaros Project. The evaluation of the Hungarian side [5] is based on the data collected by the North-Transdanubian Authority for Environment Protection, North-Transdanubian Water Management Authority, Regional Waterworks Companies, Forest Research Institute, Pannon Agricultural University, Museum of Natural Sciences, Hungarian Academy of Sciences and Eötvös Lóránd Science University. The Hungarian Ministry for Environment Protection and Water management coordinates the data exchange and the evaluation of the monitoring. Goals of the Joint Monitoring The main goal of the Joint Slovak-Hungarian Monitoring, in accordance with the intergovernmental Agreement, is to observe, record and jointly evaluate quantitative and qualitative changes of surface and ground water bodies and water related natural environment in connection to the realised measures and applied water supply. The water supply into the river branches on the Hungarian side is assured by the submerged weir, which increases the water level in the Danube upstream of the weir (at Dunakiliti). The evaluation includes changes in the hydrological regimes of the surface and ground water, changes in the surface and ground water quality, changes in the soil moisture, and changes in forestry and biota. The goal of the mutual data exchange is to provide information on monitoring results, on the progress of parameters included in the data exchange, and environmental changes on the influenced area of the respective Parties. A basic condition of data exchange is the use of equal or compatible methods of measurements and analysis and the application of agreed interpretation methods. The final goal of the Joint Annual Report is to submit to the respective governments joint evaluation monitoring results, and joint recommendations for monitoring improvement and environment protection activities. Joint monitoring activities in the year 2003 – an example of the Joint monitoring Report Comparing to the previous year there were no changes in observation object composition. However, there were some changes in observation or evaluation methods. In the frame of surface water quality the classification of six quality groups changed to five quality groups. Besides this significant changes in limit value for several parameters were introduced as well. In the fame of biological monitoring the Slovak Party started to use the Kohler index method in macrophyte observations. Joint surface water quality sampling was performed in 2003, together with joint sediment sampling in the reservoir and in the right side river branch system. Similarly, joint sampling was performed on ground water quality. At selected profiles the Parties carried out joint surface water discharge measurements. The other activities remained unchanged. Table 1. Surface water Quality
Fulfilment of recommendations in the Joint Annual Report 2002 1. Experts on surface water hydrology have to negotiate the definition of the term “flood”. However, the discussion is not finalized yet and the negotiations will continue in next few months. 2. Regarding the evaluation period of the surface water quality, the hydrological year (from 1 November to 31 October) is proposed as the period for the evaluation. The period of the hydrological year is given by hydrological characteristics of the Danube catchment area, and this period is used for evaluation of surface water levels, flow rates and for ground water quality as well. 3. Concerning differences in the analytical results of surface water quality data in samples taken at common sampling points at the same time, it can be stated that a large part of the applied measures were introduced at the beginning of 2004, however a decrease in the number of parameters with differences in their analytical results was already noticed in 2003. 4. In 2003 joint verifying surface and ground water quality and sediment quality measurements were carried out at selected sampling points on the Slovak and Hungarian sides. Surface water samples were jointly taken from 5 Slovak monitoring sites and 4 Hungarian monitoring sites, sediment samples were taken from 6 monitoring sites in the reservoir and 3 samples in the right side inundation area. For ground water, 5 samples were taken on both sides. Evaluation of the analysis will be done in a separate report. The exact dates and sampling sites are given in the Table 1. 5. Evaluation of forest observation results, in 2003, was carried out according to the Agreement [4]. Data of the actually evaluated year were used on both sides. 6. The Slovak Party in 2003 introduced the same method for macrophyte monitoring as the Hungarian Party uses. Henceforward the Kohler index is used for evaluation on both sides, and the obtained results will be comparable. 7. The high-power output electro-catching apparatus (10000 W) for fish sampling in the Danube old riverbed was experimentally used in the frame of biological monitoring by the Hungarian Party. Joint sampling in the Danube old riverbed was planned to carry out in August or September 2004. This experiment has not been realised. 8. It is necessary to attempt to identify the reason for completely different results in the monitoring of Odonata, Ephemeroptera and Trichoptera. In monitoring Ephemeroptera and Trichoptera the Parties apply different methods – the Slovak Party monitors larvae living in the water, the Hungarian Party monitors flying imagines. 9. In the case of monitoring area No. 2608, the Slovak Party carried out field investigation for finding a more suitable monitoring site within the complex monitoring area for Odonata, Ephemeroptera and Trichoptera observations. However, no new, more appropriate monitoring site has been selected until now, because of bad accessibility of river arms in this area.
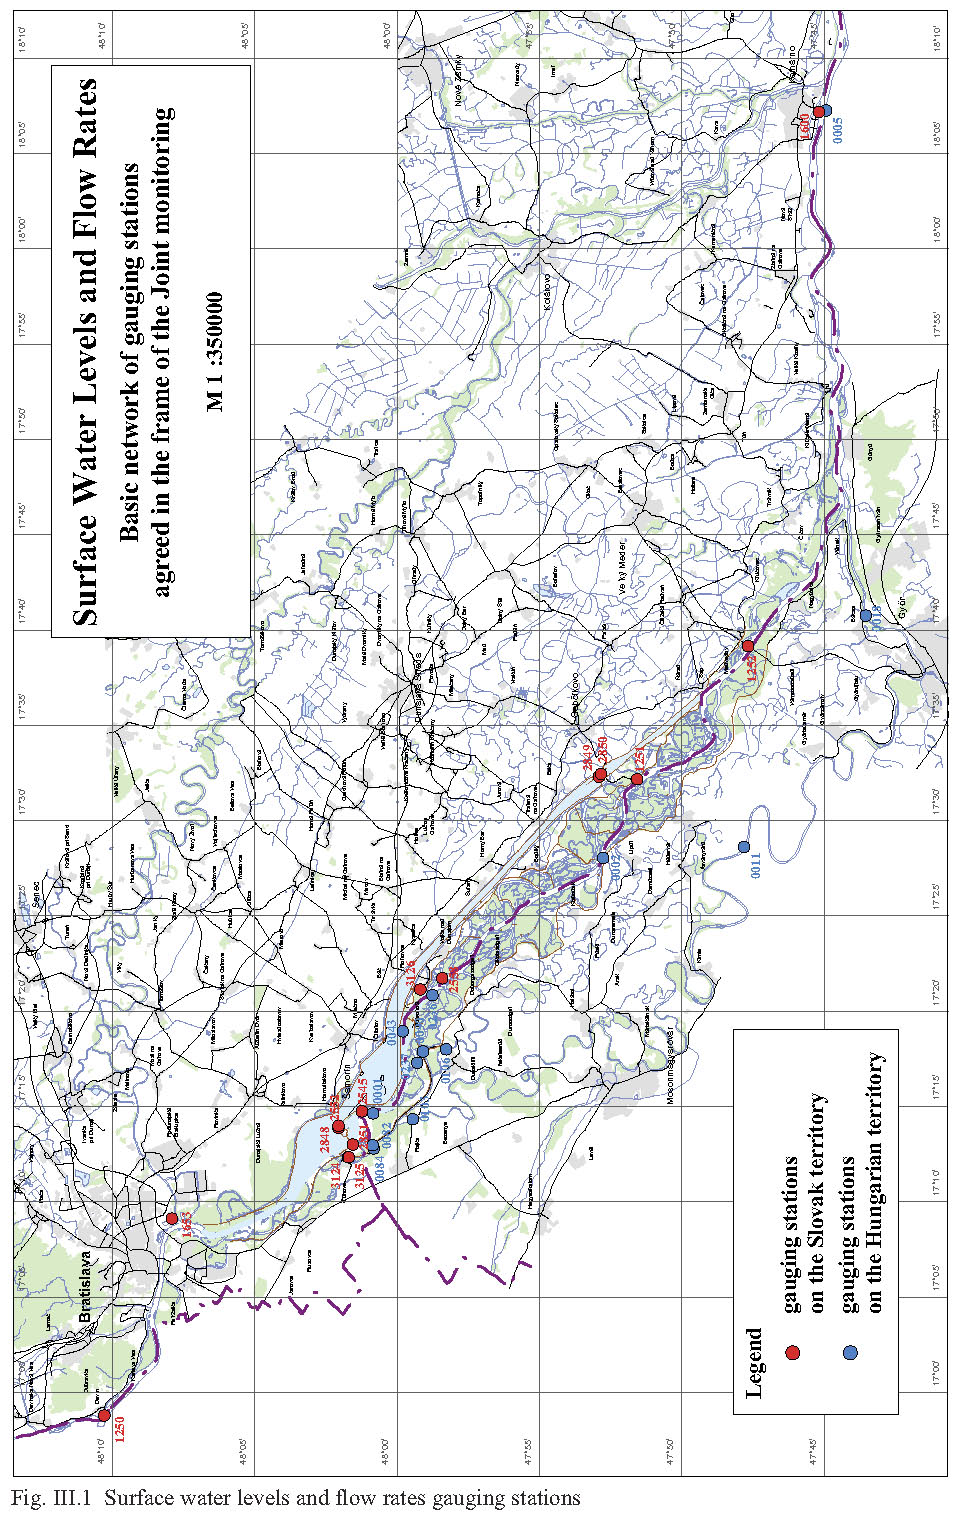
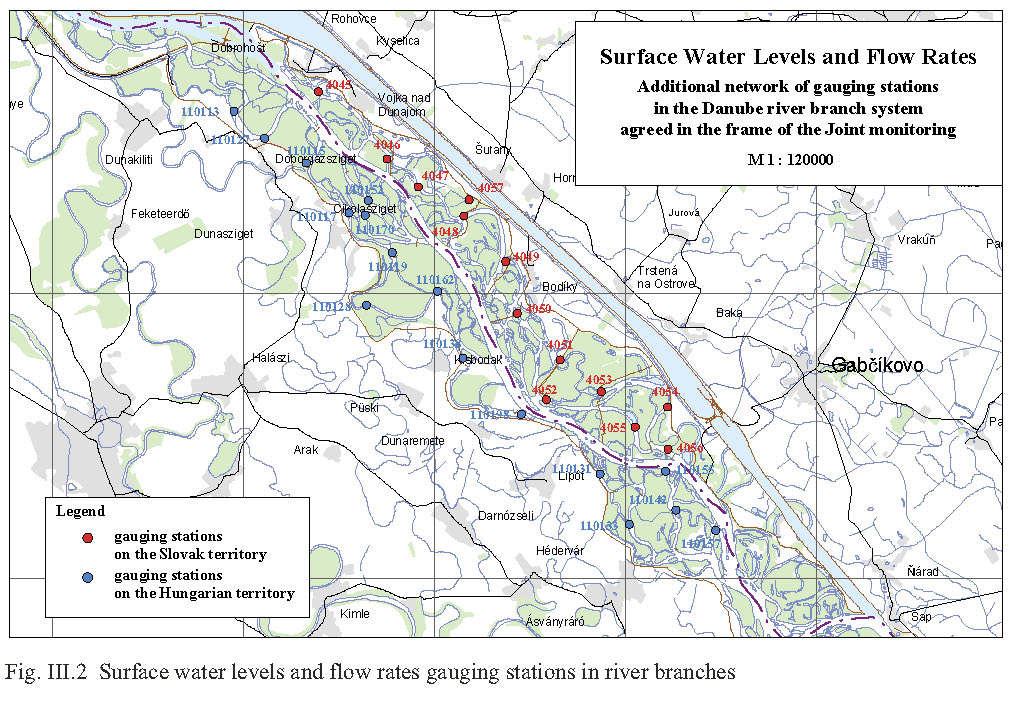
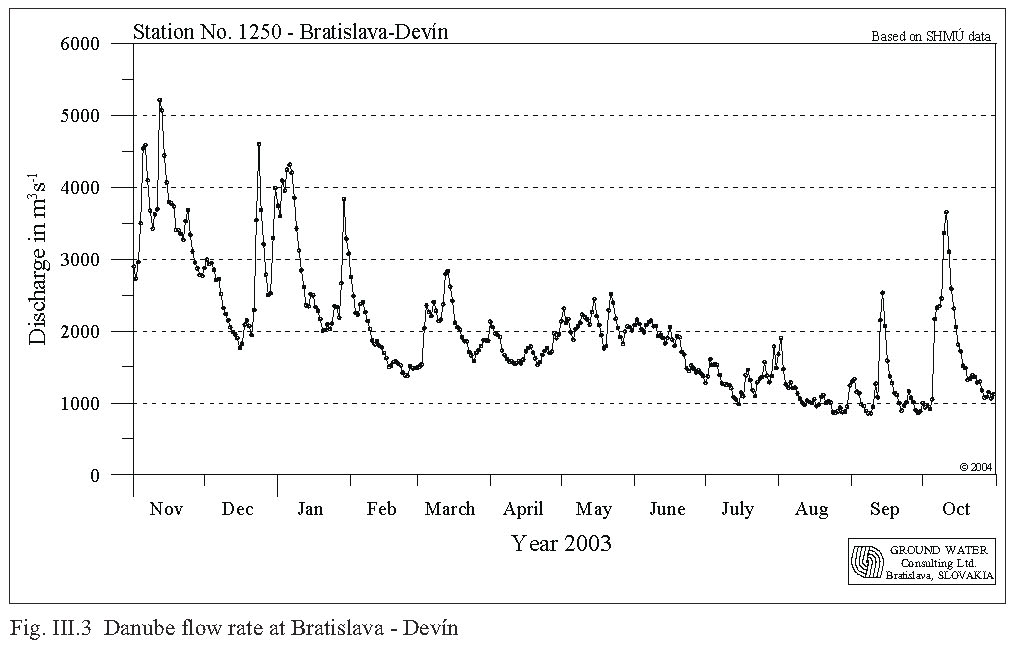
III.2.2 PART 1: Surface water levels and flow ratesSurface water level recording in the hydrological year 2003 were carried out at 28 gauging stations on the Slovak side and 29 gauging stations on the Hungarian side. On some of them flow rate calculations were performed as well. The observation network is shown in Fig. III.1, Fig. III.2. The Parties in the intergovernmental Agreement have agreed to mutually exchange data from gauging stations. Joint flow rate measurements helped the joint evaluation of flow rates flowing into the Danube downstream of the Čunovo dam and into the Mosoni branch of the Danube. Based on a mutual evaluation of joint measurements, time series data were accepted. These data create the basis for joint evaluation of measures and water supply realised according to Articles 1-3 of the Agreement. As part of the Agreement [4] a temporary water management regime was set up. It was agreed that in the case of average annual flow rate of 2025 m3s-1 at Bratislava-Devín an annual average of 400 m3s-1 should be discharged into the Danube old riverbed downstream of Čunovo. The daily amount of water is governed by the flow rate reaching the Bratislava-Devín profile, taking into consideration the rules of operation described in the Annex 2 of the Agreement. The flow rate in the vegetation period, depending on hydrological conditions, should fluctuate from 400 to 600 m3s-1; in the non-vegetation period the flow rate should not be less than 250 m3s-1. In case of floods the amount of water above 600 m3s-1 discharged through the inundation weir is not taken into consideration when the annual average is calculated. An additional 43 m3s-1 of water was agreed in the Agreement to be discharged into the Mosoni branch of the Danube and the right side seepage canal. The gauging station Bratislava-Devín plays a key role in determining the amount of water to be discharged into the Old Danube riverbed downstream of the Čunovo dam. The daily minimum flow rate occurred on September 8, 2003, when the average daily flow rate was 855.4 m3s-1. The maximum flow rate occurred on November 12, 2002, when it reached 5650 m3s-1 with a average daily maximum flow rate of 5214 m3s-1. The average annual flow rate at this station in the hydrological year 2003 was 2000.75 m3s-1, which was close to the annual average flow rate considered in the Agreement. However, considering the course of water levels and flow rates during the hydrological year 2003 can be considered an atypical year. Extremely water rich months occurred in the winter period (November 2002, December 2002 and January 2003). The next hydrological year was an extremely water poor year. Extreme low discharges and water levels occurred during the vegetation period (April-September 2003). Low flow rates in the Danube during the hydrological year 2003, in contrast to other years, occurred at the end of the vegetation period in August and September 2003. November 2002 was extremely water rich and the average daily flow rates varied from 2733 to 5214 m3s-1. At the end of June 2003 the average daily flow rates started to decrease and decreased till the middle of July, when they reached values below 1000 m3s-1. After a slight increase at the end of the July and beginning of August 2003, the average daily flow rates steeply decreased and fluctuated around 1000 m3s-1. At the beginning of September the decrease continued and on September 8-9, 2003 the average daily flow rate reached its minimum value of 855.4 m3s-1. The course of flow rates during hydrological year 2003 at Bratislava-Devín is shown in Fig. III.3. Table 2: List of gauging stations in the Danube and river branches
Table 3: Average annual flow rates
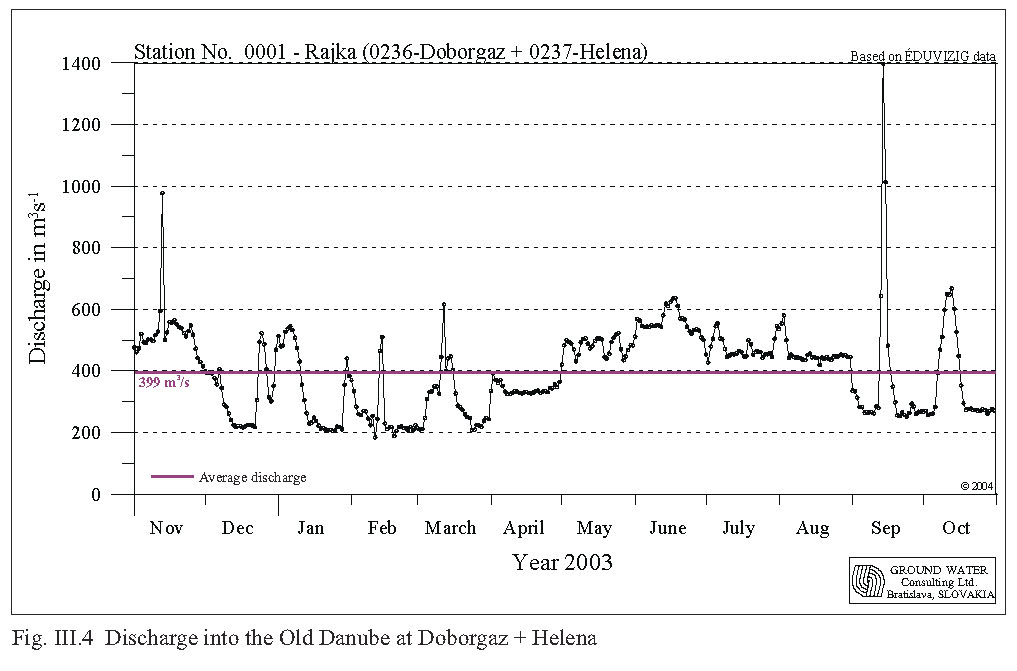
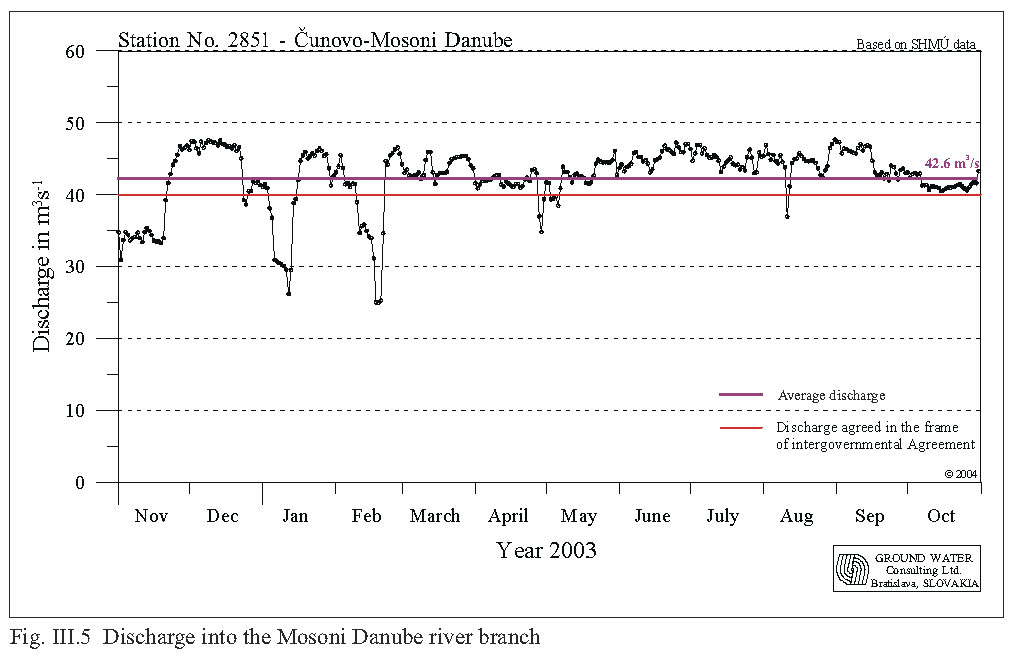
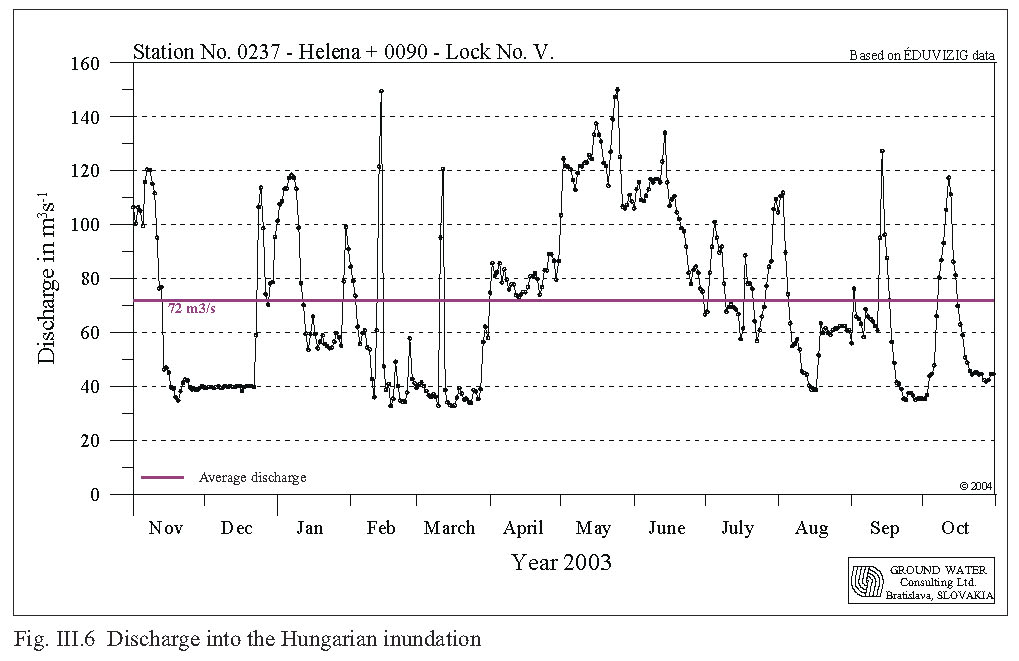
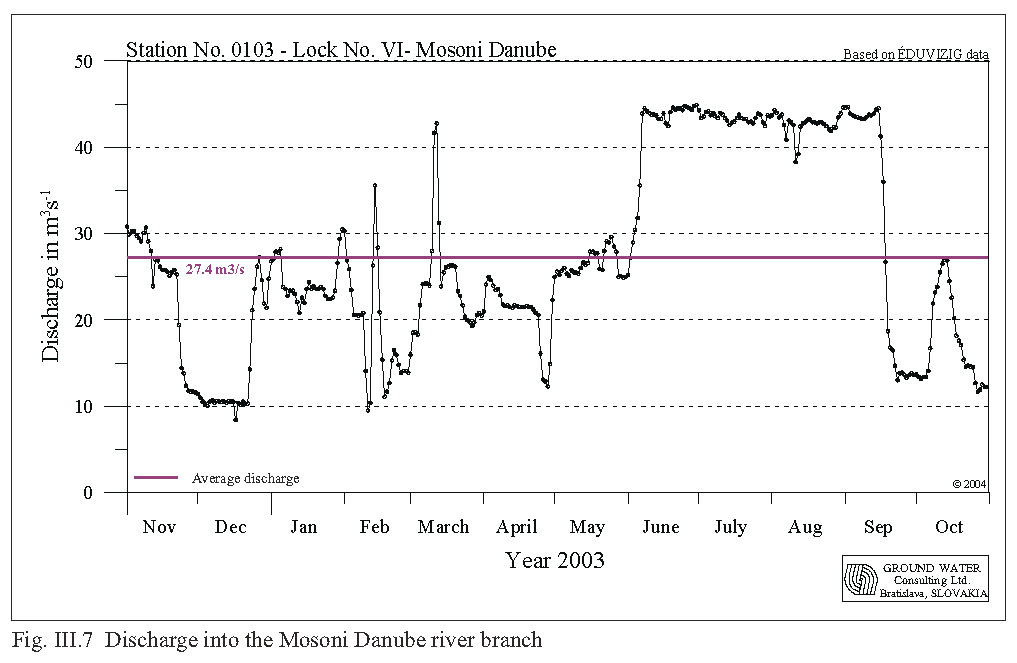
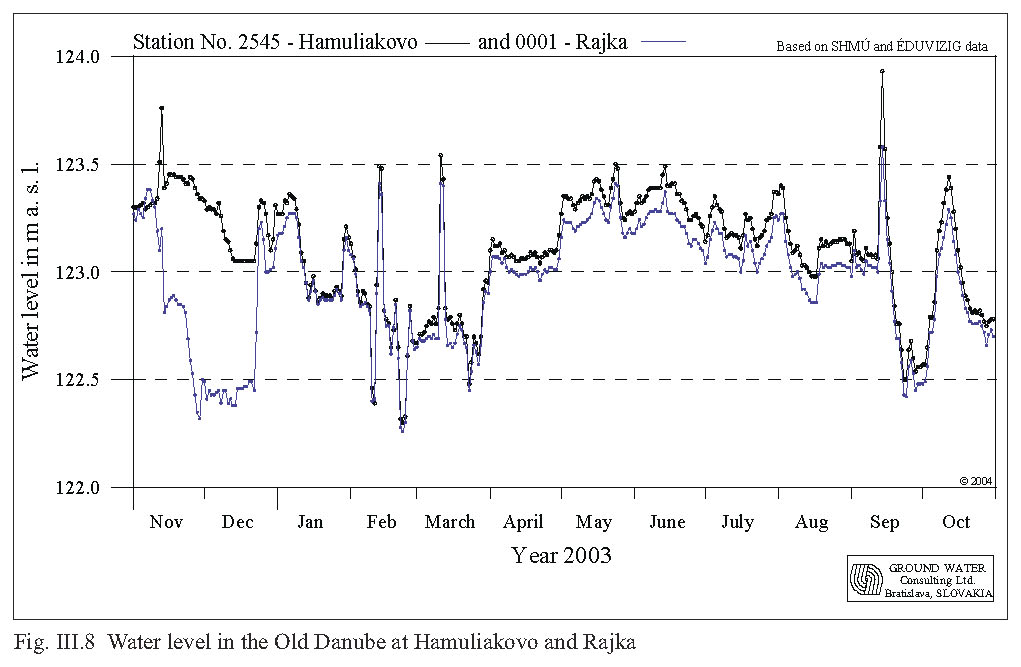
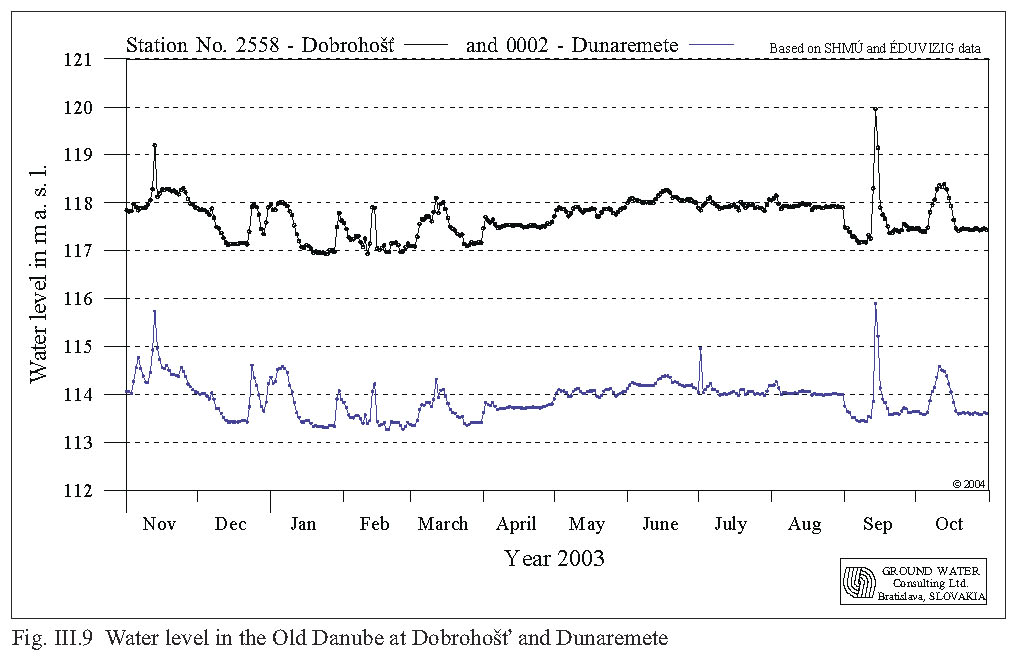
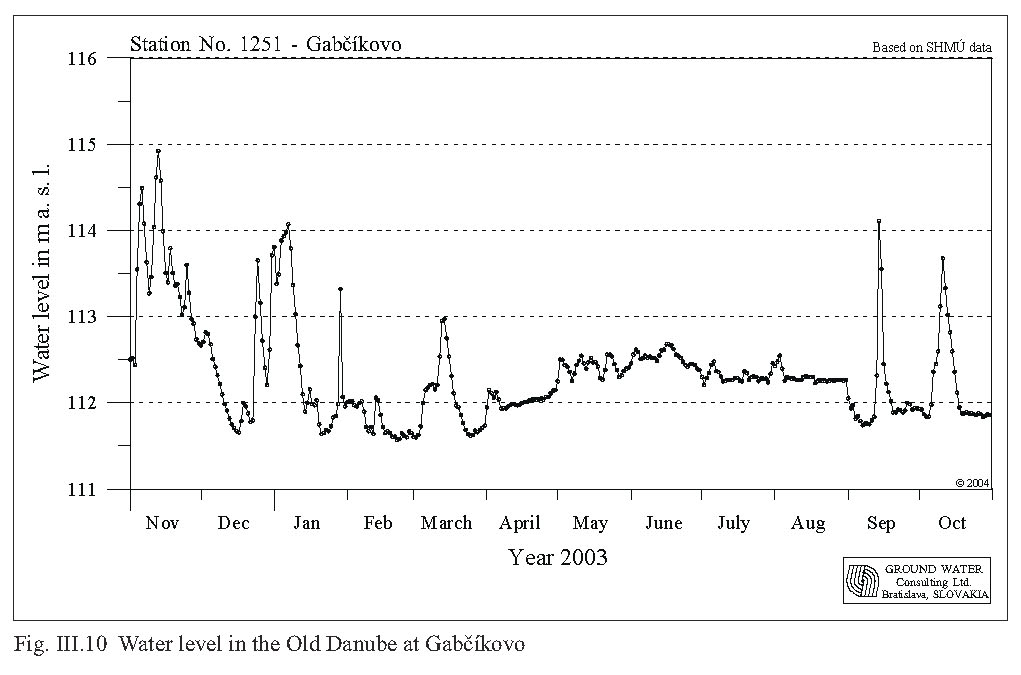
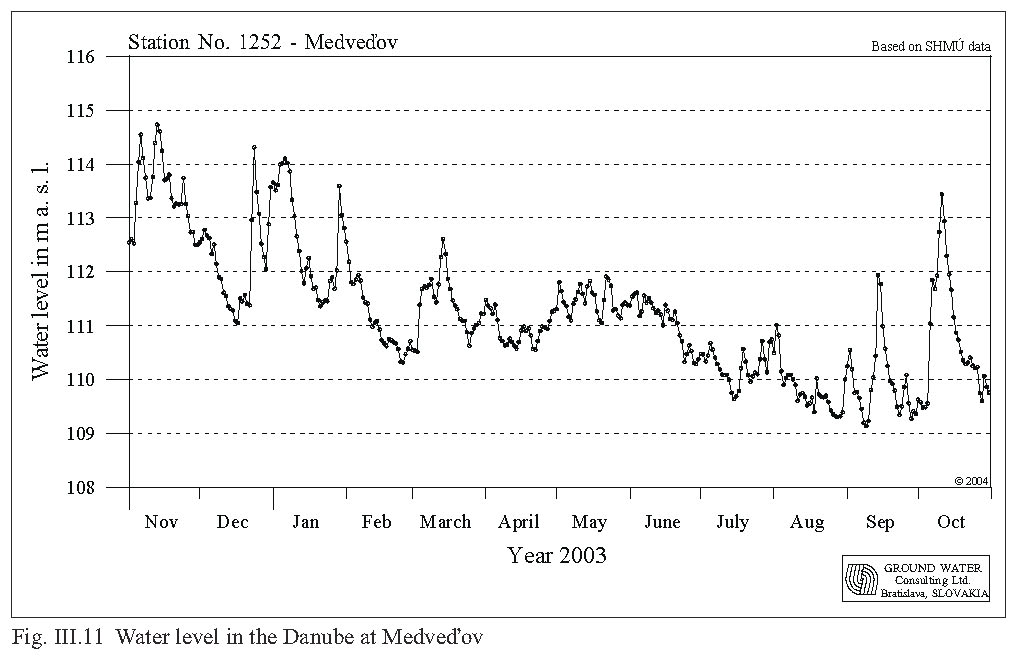
Discharge into the Danube downstream of Čunovo The determination of the average daily amount of water discharged into the Old Danube downstream of the Čunovo dam was based on average daily flow rates determined at stations Doborgaz and Helena Fig. III.4. The average annual flow rate in the Danube at the Bratislava-Devín profile in hydrological year 2003 was 2000.75 m3s-1. Taking into consideration obligations envisaged in the intergovernmental Agreement the Slovak Party was obliged to release an average annual discharge of 395.21 m3.s-1 into the Danube riverbed downstream of the Čunovo dam. The total average annual discharge released to the Danube downstream of Čunovo was 398.97 m3s-1. During hydrological year 2003 it was necessary to release an amount of water into the riverbed downstream of Čunovo higher than 600 m3s-1 on only one occasion, due to the high, November 2002 flow rate in the Danube. When subtracting the amount of water over 600 m3s-1 released during the flood events (one case), the average annual flow rate of 397.94 m3s-1 is obtained. When evaluating the amount of water discharged to the Old Danube riverbed downstream of Čunovo, it can be stated that the Slovak Party fulfilled the average annual discharge jointly agreed in the intergovernmental Agreement. Taking into consideration the minimal values prescribed in the Agreement (in the winter period not less than 250 m3s-1, in the vegetation period at least 400 m3s-1), it can be stated that the minimal daily average discharges in the winter period were lower during several days than the prescribed value. The minimal daily average discharges in the summer period, except on a few occasions (in April), was satisfied. These differences came from belated updates of Q-H curves (rating curve) at the reference profile on the Slovak side, where changes in riverbed morphology arose after floods in 2002. Discharge into the Mosoni branch of the Danube According to the Agreement, the discharge into the Mosoni branch of the Danube should be 43 m3s-1, which is composed of both, the discharge released to the Mosoni branch of the Danube through the intake structure at Čunovo, and the discharge through the seepage canal. Discharge measurements are carried out downstream of the intake structure on the Slovak territory at 0.160 rkm and also upstream of lock No. I, on the Hungarian territory. The average daily discharges were agreed after the joint evaluation of combined discharge measurements performed at both profiles. In this evaluation the data measured just downstream of the intake structure were considered Fig. III.5. The average annual discharge was 42.56 m3s-1. The flow rate in the right side seepage canal was measured at two sites as well. The first is on Slovakia at Čunovo; the second is on the Hungarian territory at lock No. II. In the evaluation, the data observed at lock No. II was considered. The average annual flow rate was 2.30 m3s-1. There had been a trend of a slow decrease in discharge observed in the seepage canal during previous years, so the hydrological conditions did not allow the continuous release of 3 m3s-1, envisaged in the Agreement. However, after the floods in March and August 2002, significant increases in seepage water amounts can be observed. The 2003 average annual flow rate in the seepage canal approaches the average annual flow rate observed in 1998. The total average flow rate was 44.87 m3s-1, consisting of the amount of water released by the intake structure at Čunovo and the amount of water in the right side seepage canal. Based on the evaluation it can be stated that the average annual discharge into the Mosoni Danube envisaged in the Agreement was fulfilled. Water distribution on the Hungarian territory The goal of distributing water on the Hungarian side is to provide a continuous water supply into the inundation area, into the river branches on the flood-protected area and into the Mosoni Danube. Water supply into the inundation area The inundation area on the Hungarian side can be supplied by water from two sources: a.) Through two openings in the Danube riverbank, by manipulating the water level increased by the submerged weir and the Dunakiliti dam. The total inflowing discharge is measured at Helena. b.) From the seepage canal through lock No. V. Joint flow rate measurements by both Parties were performed at the Helena profile. The measurements were jointly evaluated and the average daily flow rate data were accepted. The average annual flow rate (from the Old Danube via openings in the river banks) was 58.31 m3s-1. The average flow rate at the lock No. V (part of the water from Čunovo intake structure into the Mosoni Danube directed into the Hungarian inundation area) in hydrological year 2003 was 13.68 m3s-1. These two flows are summed to get the total 71.99 m3s-1, Fig. III.6. Water supply into the Mosoni branch of the Danube The water supply into the Mosoni Danube river branch is secured from the seepage canal through lock No. VI, Fig. III.7. The average annual flow rate in the Mosoni Danube at lock No. VI. was 27.41 m3s-1. During the non-vegetation period, a low water period was simulated in the Mosoni Danube as well. This was done by redirecting of a large part of the water from the seepage canal into the inundation area through lock No. V., while the amount of water taken from the Danube upstream of Dunakiliti was reduced. Besides its water supply function, lock No. I also has a flood protection function. It prevents floods entering the flood-protected area behind the protective dikes. The Danube water level characteristics on the Čunovo-Vámosszabadi stretch The characteristics of Čunovo-Vámosszabadi section in hydrological year 2003 are the following: a) Čunovo - Dunakiliti section. The water level has been impounded since construction of the submerged weir. This impounded section supplies the water into the right side river branch system. The amount of water released to the river branch system is determined by water level regulation at the Dunakiliti dam. The water level is upheld in the previous average level. Average flow velocity fluctuated between 0.25 - 0.60 ms-1. During hydrological year 2003 discharges over 600 m3s-1 into the Danube old riverbed were released on two occasions. On November 13, 2002 because of flood and September 14-15, 2003 to keep the water level in the Danube downstream of Čunovo higher due to technical reasons. The average daily water level at the Hamuliakovo gauging station (rkm 1850) fluctuated from 122.30 to 123.93 m a.s.l., and the average annual water level was 123.11 m a.s.l. The daily average water level in the Rajka profile (rkm 1848.4) fluctuated from 122.26 to 123.58 m a.s.l., and the average annual water level was 122.96 m a.s.l, Fig. III.8. b) Section between Dunakiliti and Dunaremete. This section of the Danube is not influenced by any measures and the water level is determined only by the flow rate in this riverbed section. In the upper part of this section the water level in the river branches is about 3 m higher than the water level in the main riverbed. The average daily water level at the Dobrohošť gauging station (rkm 1838.6) fluctuated in the range from 116.93 to 119.95 m a.s.l., and the average annual water level was 117.99 m a.s.l. The average daily water level at the Dunaremete profile (1825.5) fluctuated from 113.27 to 115.90 m a.s.l. and the average annual water level was 113.91 m a.s.l., Fig. III.9. The average flow velocities fluctuated in the range between 0.71 - 0.95 ms-1. c) Section between Dunaremete and Sap. The water level in this section is influenced by the backwater effect from the confluence of the tailrace canal and the Danube old riverbed (rkm 1811). The water level changes, especially in the lower part of this section, are influenced by the flow rates in the Gabčíkovo tailrace canal. The length of the upstream section influenced by the backwater effect depends on the actual flow rate distribution between the hydropower station and the Danube old riverbed. At regular operation it can be stated that the backwater effect reaches the Dunaremete profile (rkm 1825.5) at flow rates over 2500 m3s-1 at Medveďov. The average daily water level at the Gabčíkovo gauging station (rkm 1819) fluctuated in the range from 111.57 to 114.92 m a.s.l. and the average annual water level was 112.34 m a.s.l., Fig. III.10. The daily water level fluctuation at the Gabčíkovo gauging station in the Old Danube can reach app. 20 cm, as a consequence of hydropower station operation. d) Sap – Vámosszabadi section. The flow rate in this section approximately equals to the flow rate at Bratislava and is additionally influenced by the Gabčíkovo hydropower station operation. The daily water level fluctuation at this stretch (up to 30 cm) depends on the hydropower station operation. Higher changes occur at low flow rates in the Danube due to the ratio of the total flow rate and the capacity of one turbine, which may be put into operation or stopped. The average annual flow rate at the Vámosszabadi – Medveďov profile in 2003 was 1944,21 m3s-1. The average daily water level at Medveďov profile (rkm 1806.3) fluctuated in the range from 109.14 to 114.73 m a.s.l. and the average annual water level was 111.25 m a.s.l., Fig. III.11.
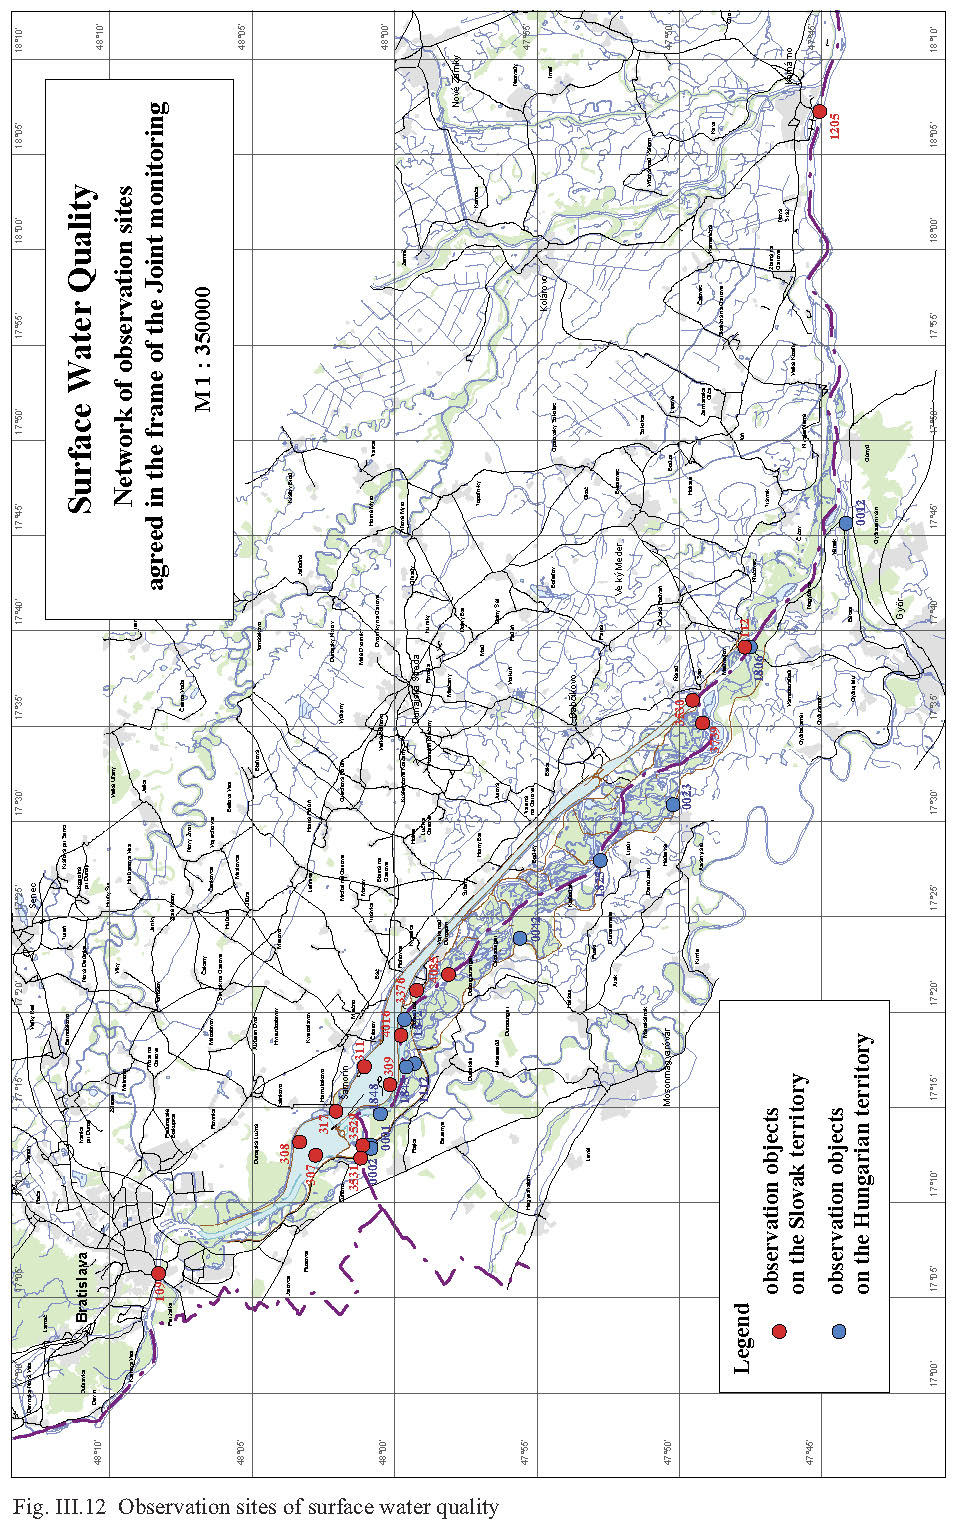
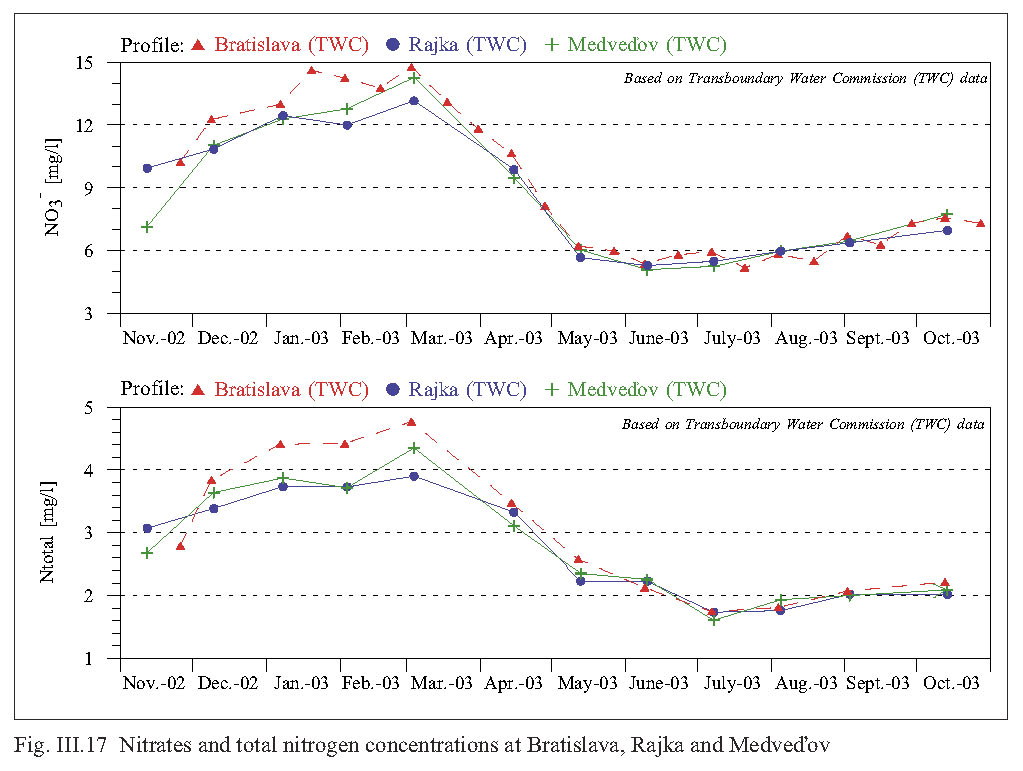
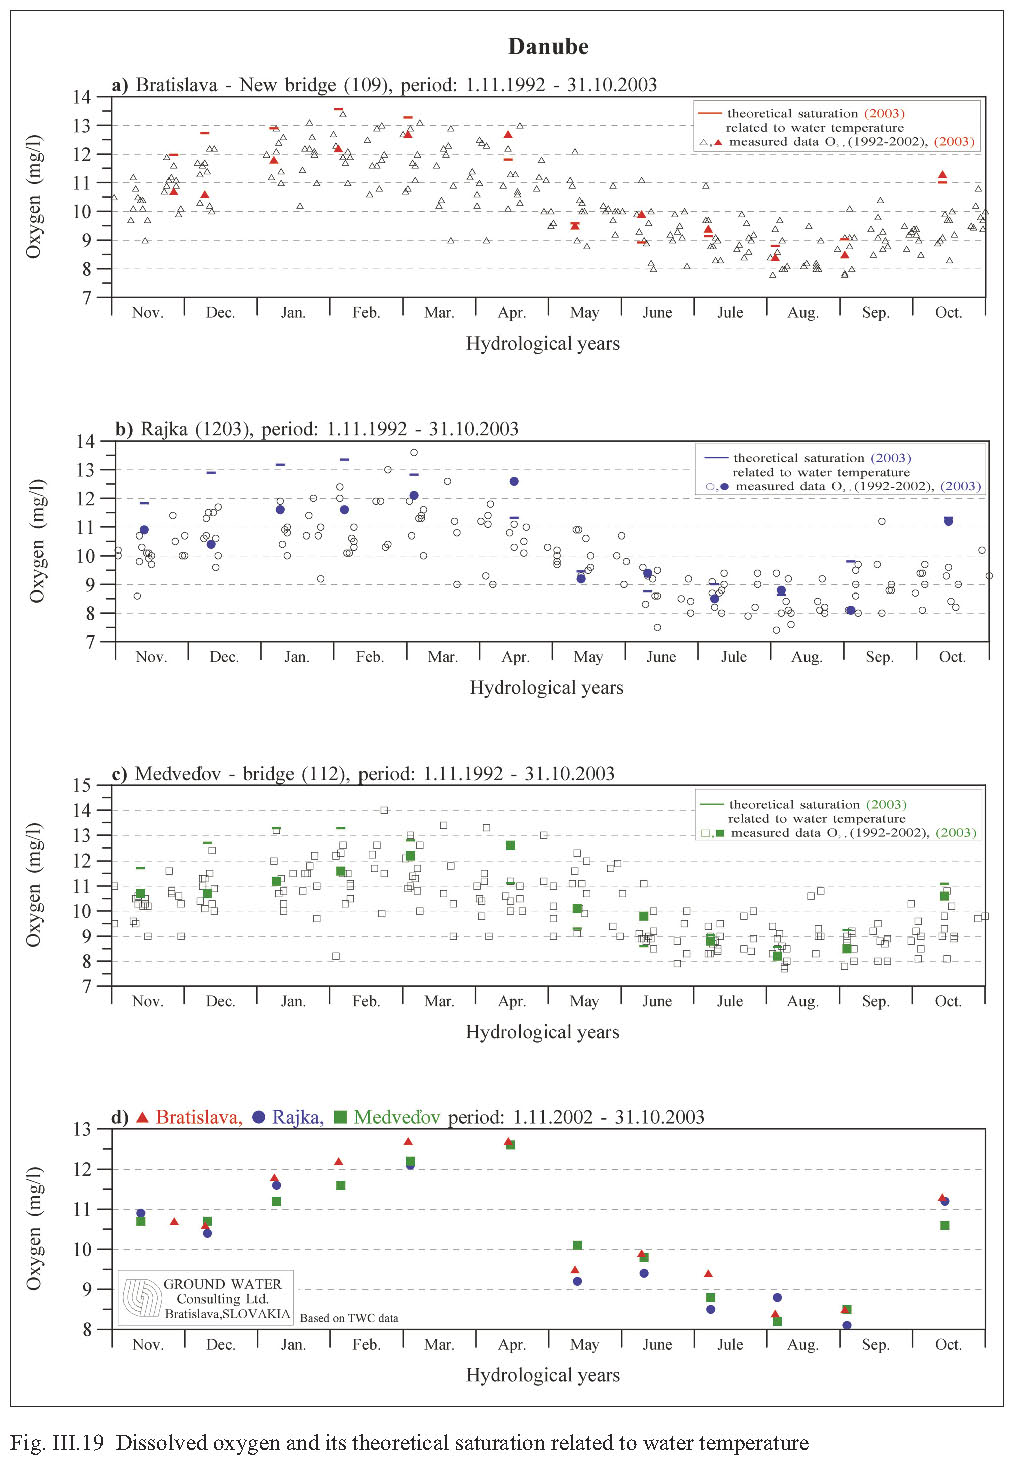
III.2.3 PART 2: Surface Water QualityIn accordance with the Agreement surface water quality measurements in 2003 were carried out at 11 monitoring sites on Hungarian territory and at 15 monitoring sites on Slovak territory, Fig. III. 12. Sampling and analysing were mainly performed according to the methods agreed by the Sub-commission for Water Quality Protection of the Slovak-Hungarian Trans-boundary Water Commission. Surface water quality and sediment quality data for the agreed monitoring sites, and time series diagrams for the respective parameters of the surface water quality, are given in the Annexes to the Slovak and Hungarian National Reports on the Environment Monitoring in 2003. Figures in this report present the data of selected parameters. In this evaluation new limit values for surface water quality were used, as agreed at the 78th session of the Slovak-Hungarian Trans-boundary Water Commission. Table 4: New agreed limits for surface water quality classification
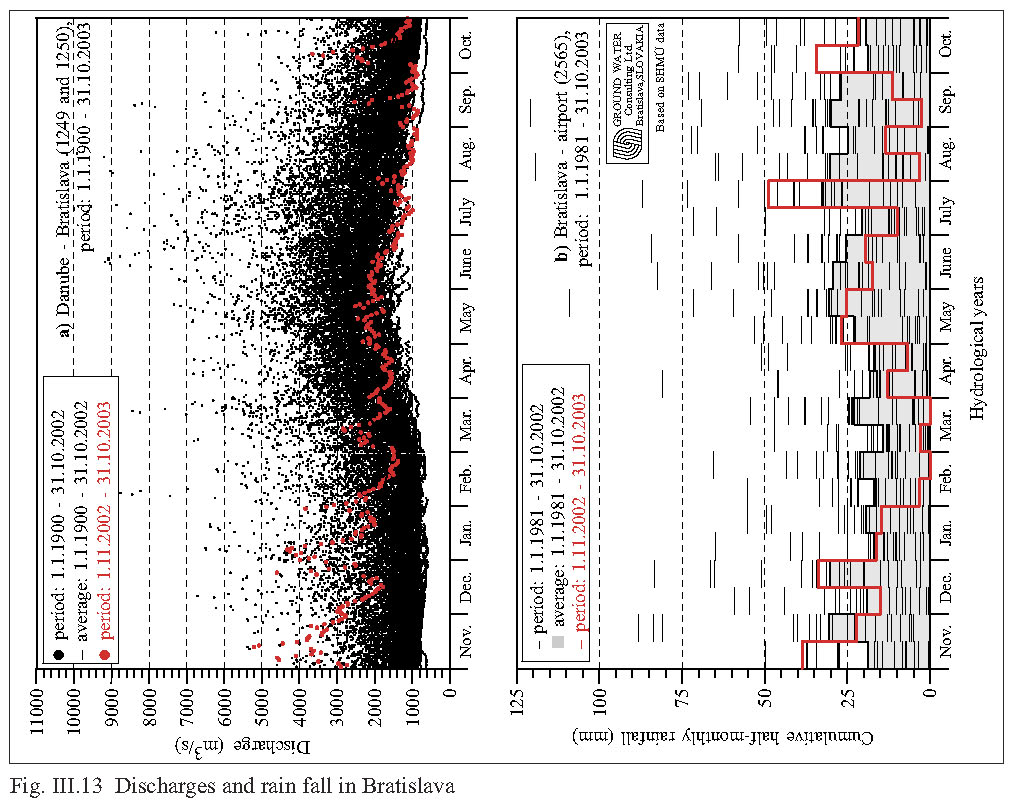
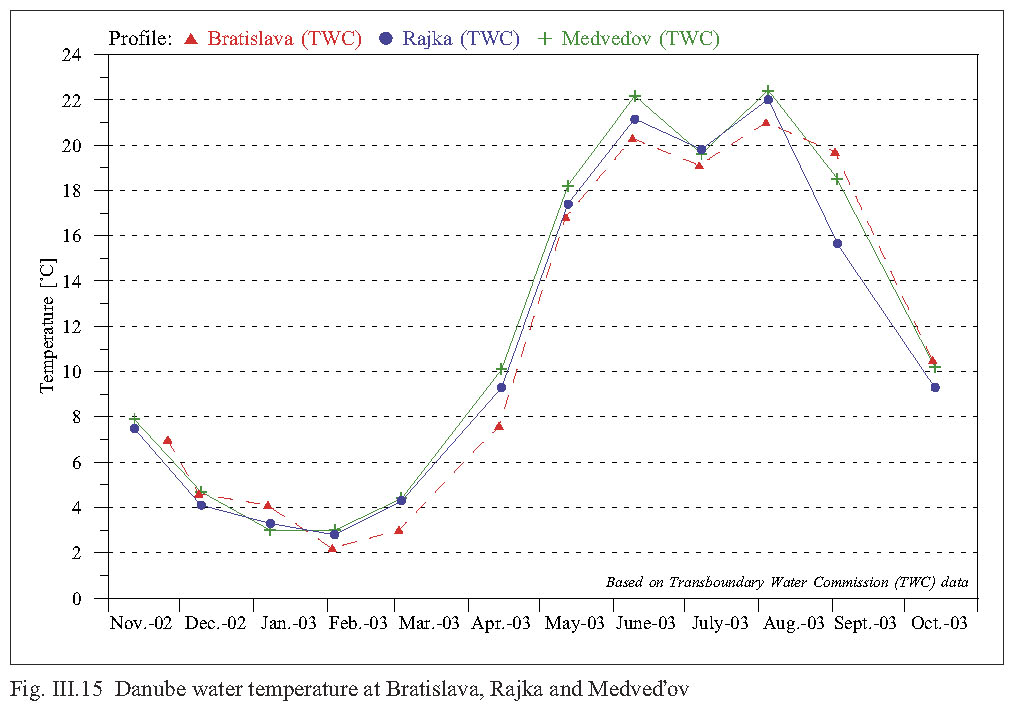
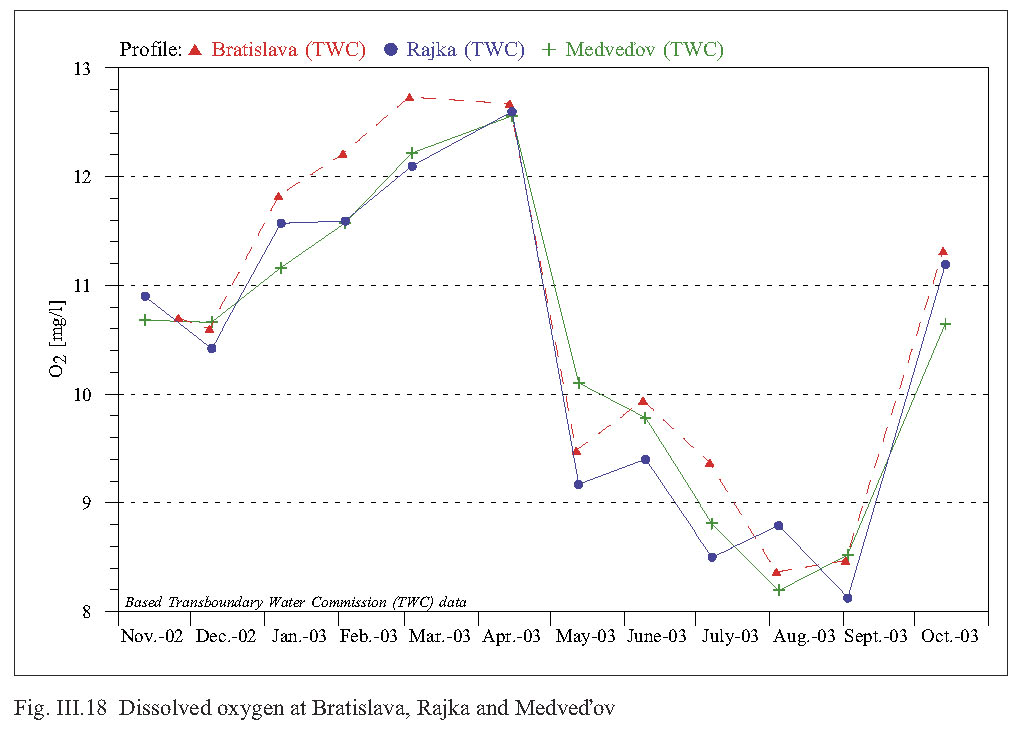
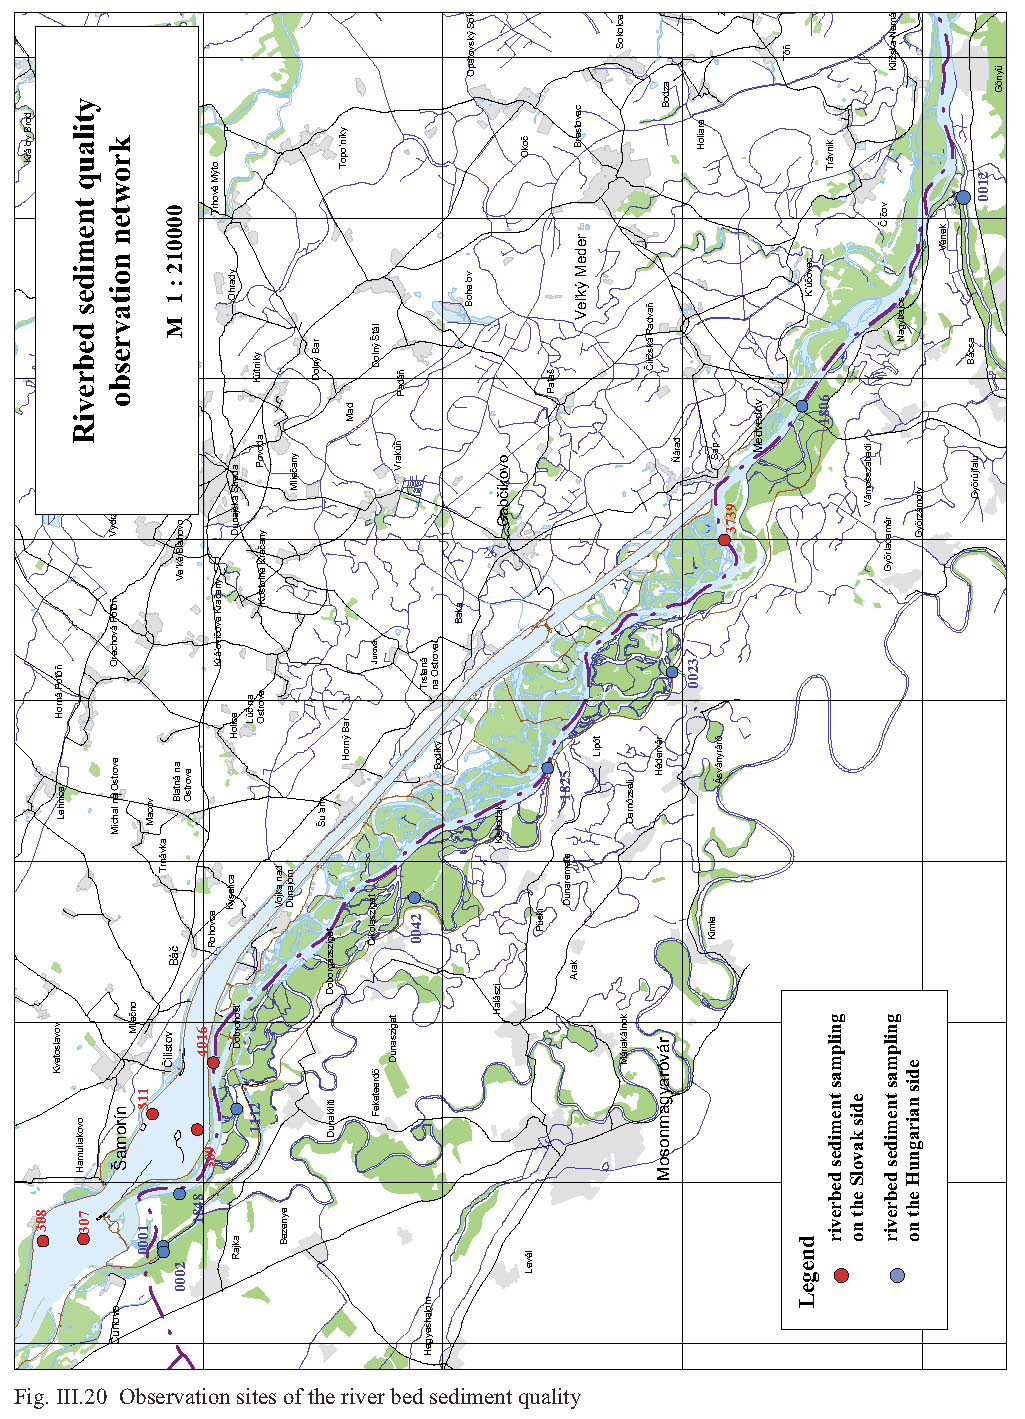
General evaluation of the actual hydrological year The year 2003 was extraordinary from the hydro meteorological point of view. Flow rates in the vegetation period, from April to October, were extremely low. Furthermore, in this summer period the lowest flow rates in the last 100 years occurred on some days. Moreover, a significant lack of precipitation occurred in the period from February to September. During the vegetation period extremely warm and long lasting time intervals occurred, similar to the previous year. This resulted in rather high water temperatures in the Danube, which were as well related to the low flow rates in this period. The monitoring results are described in [3] and shown in Fig. III.13 and Fig. III.14. Basic physical and chemical parameters Water temperature The water temperature fluctuation in the whole Danube stretch downstream of Čunovo follows the water temperature course observed in the Danube at Bratislava. In the actual year it fluctuated in the range from 1 to 21 °C, in the reservoir (at some places with nearly stagnant water) up to 25 °C. Maximal values occurred in June and August and minimal values in January. The water temperature in the seepage canal in the winter period was warmer (by 2 °C) and in the summer period cooler (by 2-4 °C), because the seepage canal is supplied by ground water. The water temperature in the Mosoni Danube at Čunovo was similar to the water temperature in the Danube and fluctuated from 2 to 22 °C, at Vének it fluctuated from 1 to 28 °C. The water temperature in the right side river branch system in the winter period was cooler than to the Danube water, the summer maximums reached values observed in the Danube water. The water temperature at some sampling sites for hydrological year 2003 is documented in Fig. III.15. pH Higher values of pH occur in seasons corresponding to periods of increased assimilation activity of phytoplankton. In winter the pH values were lower. The Danube water pH values in the hydrological year 2003 fluctuated in the range from 7.6-8.6, with the higher values occurring during the algae growth (mainly in April-May, and during the second culmination of algae growth in June). The pH values in the reservoir fluctuated between 7.2-8.4. The pH values in the river branch system and in the Mosoni Danube fluctuated between 7.5 and 8.5. The pH values in the seepage canal varied from 7.5 to 8.2. Specific electric conductivity The conductivity values (refer to the dissolved salts contents in the Danube and in the right-side river branch system in 2003 they followed the conductivity values at Bratislava and fluctuated between 32 and 53 mS.m-1. Higher salinity occurs in the period from November to February, with the minimal in June. The dissolved salts content in the Mosoni Danube at the Čunovo sampling site is similar to that in the Danube water. The Vének profile salinity was higher than the other water bodies (it is affected by the impact of the effluents and loads coming from the wastewater) and fluctuated in the range from 35 to 65 mS.m-1. The electric conductivity values in the seepage canal, similarly to previous years, fluctuated in the range from 33 to 47 mS.m-1, while during the period from April to October they were higher then the Danube water at Bratislava. Suspended solids The suspended solids content is closely related to the flow rate Fig. III.16. The suspended solids content fluctuation during hydrological year 2003 in the whole Danube stretch downstream of Čunovo follows the suspended solids content in the Danube at Bratislava. The suspended solids content fluctuated in the range from 2 to 56 mg.l-1. Higher values are related to periods with increased flow rates. In the seepage canal the content of suspended solids fluctuated between 1-18 mg.l-1. The suspended solids content along the longitudinal profile of the right side river branch system, similarly to previous years, fluctuated between 5-45 mg.l-1. One high value (70 mg.l-1) occurred in December at the Helena sampling site. In the Mosoni Danube at Čunovo the suspended solids content fluctuated from 6 to 42 mg.l-1, where one higher value occurred in January (app. 64 mg.l-1). At the Vének profile the suspended solids content fluctuated from 1 mg.l-1 to 22 mg.l-1, while one value in December reached 80 mg.l-1. Basic physical and chemical parameters - summary The Basic physical and chemical parameters in the Danube and in the river branch system connected to the Danube main riverbed show seasonal variations and some of them predominantly depend on the flow rate. The suspended solids content fluctuations in the whole Danube stretch downstream of Čunovo follow the suspended solids content fluctuation in the Danube at Bratislava, however the suspended solids content downstream of the reservoir shows the settling effect of the reservoir, especially during the higher flow rates. The fluctuation of basic physical and chemical parameters in the Mosoni Danube and in the right side seepage canal reflects the different characteristics of these water bodies. Tributaries and wastewater from Győr influence the water quality in the Mosoni Danube. The water in the seepage canal is influenced mainly by the seepage of ground water. No significant changes in water quality were recorded in hydrological year 2003 in comparison to the previous year. Cations and Anions The quantitative ratio of the ionic composition of the Danube water during the hydrological year 2003 showed high stability, just as in previous years. The seasonal fluctuation of the quantitative ratio of the ionic content followed the changes in salinity (first of all: changes of magnesium, calcium, sodium, chloride and hydro-carbonate ions content) related to the flow rate fluctuations in the Danube. Compared to the long-term measurements the values of basic cations and anions have not changed. The most stable ionic content was characteristic for the seepage water. Higher dissolved solids content in the Mosoni Danube downstream of Győr occurred in relation to higher sodium, potassium, chloride and sulphate concentrations. Nutrients Nitrate concentrations in 2003 at all monitoring sites in the Danube as well as in the right-side river branch system fluctuated in the range from 5 to 15 mg.l-1, Fig. III.17. Nitrate concentrations in the Mosoni Danube at Vének were mostly lower than the Danube water and fluctuated in a range from 4 to 21 mg.l-1, however one value in October reached 35.3 mg.l-1. Nitrates in the seepage canal in 2003 equally fluctuated in the range from 1 to 9 mg.l-1. In the hydrological year 2003 the ammonia ion concentrations at all measured sites in the Danube and in the river branch system reached their maximum values at the end of January (concentrations fluctuated up to 0.23 mg.l-1). In the following period concentration fluctuated from 0.01 to 0.15 mg.l-1. However, one October value at Bratislava reached 0.837 mg.l-1. In general, higher concentrations occur during the periods with lower water temperature due to the slower nitrification processes. In comparison to the previous year there was a slight decrease of ammonium content in the Danube. The lowest ammonia ion concentration is in the seepage canal, where it varied from 0.01 to 0.15 mg.l-1. In the Mosoni Danube at Čunovo varied from 0.04 to 0.16 mg.l-1, however one value in July reached 0.3 mg.l-1. At Vének profile the concentration of ammonium ion was on several occasions two times higher than the concentrations observed on the other profiles. However, the maximal values were lower in comparison to the previous year (0.6 mg.l-1 in February, 0.52 mg.l-1 in September). The nitrite ion concentrations, considered as a temporary product of nitrification and denitrification processes, showed a seasonal variation in the Danube and fluctuated in the range from 0.01 to 0.19 mg.l-1. The seepage canal concentrations were lower in comparison to the Danube, and mainly varied between 0.02 and 0.08 mg.l-1. The nitrite content at Čunovo in the Mosoni Danube was higher than that in the Danube at Bratislava. At the Vének profile and in the right side river branch system, the nitrite concentrations were higher than in the Danube and varied from 0.02 to 0.15 mg.l-1. The total nitrogen content, Fig. III.17, is predominantly affected by the fluctuation of the nitrate-nitrogen and organic-nitrogen concentrations, which result from the quantitative ratio of nitrogen forms. In hydrological year 2003 the phosphate concentrations decreased slightly, in comparison with the previous year. In the Danube they varied from 0.02 to 0.22 mg.l-1, in the reservoir from 0.03 to 0.28 mg.l-1. The phosphate concentrations in the right side river branch system fluctuated from 0.02 to 0.24 mg.l-1; however, one September value at The Szigeti river arm site reached 0.38 mg.l-1. The phosphate content in the Mosoni Danube at Čunovo fluctuated in the range from 0.02 to 0.22 mg.l-1; at the Vének profile the phosphate content was higher than in the Danube; varied from 0.1 to 0.86 mg.l-1. The lowest phosphate concentration occurred in the seepage water (from 0.01 to 0.21 mg.l-1). In general, higher values of orthophosphate concentrations occur in the winter period, lower values are characteristic for the vegetation period. Concentration changes of the total phosphorus followed the concentration changes of phosphates. The total phosphorus concentration on all profiles, except the profile at Vének, situated on the Mosoni Danube, fluctuated in the range from 0.02 to 0.27 mg.l-1. Total phosphorus concentrations at Vének fluctuated in the range 0.1-0.46 mg.l-1. The total phosphorus content in the seepage canal fluctuated in a narrow range from 0.02 to 0.13 mg.l-1. Nutrient content fluctuation in the Danube water (Bratislava and Medveďov), over eleven years of observation, can be divided into three stages: the period 1992-1996 is characterised by a gradual increase of concentrations; the period 1997-2001 is characterised by a gradual decrease of concentrations; and the period 2002-2003, which can be characterised as a stabilized nutrient content, in comparison to 2001 there were no significant changes. A decrease of nutrient content in the Bratislava section of the Danube is probably connected with a decrease of pollution coming from the upper watershed of the Danube to this area. Since the introduction of the water supply, the content of nutrients in the right-side river branch system mostly follows the fluctuations in the Danube. The mosaic character of water bodies along the path of the water supply decreased, as a consequence of changed water regime dynamics. The nutrient content in the Danube water is potentially sufficient for development of eutrophic processes under other suitable conditions. Oxygen and organic carbon regime parameters In hydrological year 2003 the dissolved oxygen concentration in the Danube water varied from 7.5 to 13.5 mg.l-1, in the reservoir it varied from 5 to 17 mg.l-1. Maximum and minimum values occurred at site No. 308, a shallow, nearly stagnant water body close to the Kalinkovo reservoir bank. Fluctuation of the dissolved oxygen content at selected profiles in the Danube is documented in Fig. III.18. The dissolved oxygen content proportionally decreased with increasing water temperature in the Danube. Besides this, the dissolved oxygen content depends on the assimilation activity of phytoplankton. A comparison with previous years and theoretical saturation of oxygen in 2003 is in Fig. III.19. In the right-side river branch system, due to the continuous water supply, the dissolved oxygen content follows the course of the Danube values. The concentrations fluctuated in the range from 6 to 14 mg.l-1. The oxygen concentrations in the Mosoni Danube at Čunovo varied from 8 to 14 mg.l-1, at Vének, similarly to the previous year, the oxygen content was slightly higher in comparison to the long-term values and fluctuated from 5.11 to 14.25 mg.l-1. The oxygen content in the seepage canal fluctuated from 6 to 12 mg.l-1. CODMn and BOD5 parameters are used for expressing the organic content (partial contamination) of the water, they indicate the chemically and biologically degradable organic matter. In the hydrological year 2003 the COD values fluctuated from 0.5 to 6 mg.l-1. The COD values in the right side river branch system fluctuated from 2 to 9.6 mg.l-1, one value in November 2002 at Helena profile reached 13 mg.l-1. The organic matter content in the seepage canal has been low over the long term and in 2003 fluctuated from 0.5 to 3 mg.l-1, however one value in December 2002 reached 4.8 mg.l-1. The BOD values of the Danube water fluctuated in the range from 1 to 5 mg.l-1, one higher value occurred during the higher flow rate in November 2002 at Rajka and Medveďov (7.2 and 7.6 mg.l-1 respectively). The BOD values in the right side river branch system were mostly higher in comparison to the Danube water and varied in the range from 0.5 to 7 mg.l-1. The BOD in the seepage canal varied from 0.4 to 2.6 mg.l-1, at sampling site No. 0002 on the Hungarian side, there were recorded values up to 4.6 mg.l-1. In the Mosoni Danube at Čunovo the COD values varied in the range from 1.4 to 7 mg.l-1 and the BOD from 1.37 to 3.6 mg.l-1, while during higher discharges in the Danube in November 2002 one value reached 6.6 mg.l-1. At the Vének profile the COD and BOD values were, similarly to the values in previous years, higher, because of the partially treated wastewater from Győr (COD range 3-7 mg.l-1, with one extreme value in December 2002 – 19.6 mg.l-1, BOD range 1-6 mg.l-1, with one extreme value in May 2003 – 11 mg.l-1). Higher COD and BOD values usually occur in periods with increased flow rates in the Danube, when the water contains higher amounts of natural or semi natural organic matter. A summary of oxygen and organic carbon monitoring shows that in 2003, with the long-term data comparison at Bratislava and Medveďov, maximal values of dissolved oxygen content were higher than in years 2001-2002. BOD values in 2003 increased in comparison to the years 1999-2002 and reached values of the period 1996-1998. The COD values, after a slight increase in the 2001-2002, decreased below the long-term average values. TOC values, after an increase in the period 1993-1997, started to decrease in 1998 and in the period 2000-2003 fluctuated in a stable range. The oxygen and organic carbon related parameters in the Danube reflect the seasonal assimilation activity of the phytoplankton and organic carbon oxidation processes. The measured data (1992-2003) indicate a generally decreasing tendency in the organic load of the Danube at Bratislava, which is related to the substantial wastewater treatment improvement in the upstream Danube countries. Higher values of CODMn, BOD5 occur in periods of higher flow rates in the Danube. Parameters at Vének are influenced by local pollution (primarily from Győr). Metals The amount of suspended solids influences the total iron content in the surface water. The mutual coherence of iron concentrations and suspended solids content in surface water is documented by the highest concentrations of iron measured at the time of highest suspended solids content. In hydrological year 2003 the iron concentrations on all measured sites on the Danube fluctuated mainly up to 1 mg.l-1. However, on two occasions it reached values up to 1.2 and 1.5 mg.l-1, in January and October, respectively. The iron concentrations in the right side river branch system mostly fluctuated up to 0.5 mg.l-1. The iron concentration in the seepage water fluctuated in a lower range up to 0.4 mg.l-1, however one extreme value of 0.8 mg.l-1, occurred in January at the Čunovo profile In the Mosoni Danube at Čunovo the iron content varied from 0.1 to 0.5 mg.l-1. In November 2002, August and October 2003, three values up to 2.3 mg.l-1 occurred. At Vének the iron content is usually higher due to the tributaries (the water in the Rába river is rich in iron). However, in the hydrological year 2003 the iron concentrations were similar to the Danube water; they varied from 0.1 to 0.85 mg.l-1. Manganese, similarly to iron, occurs in surface water mainly in a solid phase. The manganese concentrations in the Danube water mostly fluctuated in the range up to 0.08 mg.l-1, at Bratislava one value of 0.1 mg.l-1 occurred in October 2003. The manganese concentrations in the Mosoni Danube at Čunovo fluctuated in a range up to 0.05 mg.l-1. At the Vének profile, in comparison to the previous year, three extreme values occurred (max. 0.5 mg.l-1), while the remaining values ranged up to 0.24 mg.l-1. In the right side river branch system, except the Helena site, and in the seepage canal at Čunovo low concentrations were measured up to 0.1 mg.l-1. At Helena the manganese content fluctuated from 0.02 to 0.97 mg.l-1. The heavy metals concentrations in hydrological year 2003 fluctuated in the range of limits corresponding to the I. class of surface water quality. The mercury content varied below the detection limit value (0.1 mg.l-1). Biological and microbiological parameters The number of Coliform bacteria determines the bacteriological pollution. In the year 2003 the number of Coliform bacteria at Bratislava varied up to 200 NrC.ml-1, which represents some increase in comparison to the previous year. The Coliform bacteria numbers at Rajka and Medveďov follow the fluctuation of values at Bratislava. The numbers of Coliform bacteria were in the long run lower compared to the Bratislava site. The bacteriological pollution at Medveďov in the main riverbed is lower than in the Rajka. The bacteriological pollution in the river arms is lower than in the Danube water and fluctuated in the range from 1 to 50 NrC.ml-1. As in the previous year, some improvement was observed in microbiological parameters along the flow path in the right side river branch system. The bacteriological pollution at the Čunovo on the Mosoni Danube varied from 1 to 200 NrC.ml-1. At the Vének profile it fluctuated in the range from 20 to 2000 NrC.ml-1, which can be regarded as an improvement at this sampling site. The seepage canal can be considered as the cleanest, the number of bacteria range up to 20 NrC.ml-1, however one extreme value (590 NrC.ml-1) occurred in June at profile No. 0002. The chlorophyll-a concentrations refer to the quantity of phytoplankton and provide information about the eutrophic state of water. The growth of algae on the respective section of the river is represented by the relative increase of chlorophyll-a concentration between two compared profiles. According to the observations in the Danube in 2003, the spring algae growth maximum, as in the previous year, occurred from April to June, when values fluctuated around 75 mg.m-3. In the following period the chlorophyll-a concentration decreased. The situation in the right side river branch system and in the Mosoni Danube at Čunovo was similar to the situation in the Danube. However, the spring algae growth culminated earlier (March-April) that in the Danube water. The chlorophyll-a concentrations during the spring period were a little bit higher in comparison to the Danube water. The situation at the Vének profile was similar to the situation in the Danube as well. However, the spring culmination occurred in May (181 mg.m-3), which was caused by a huge amount of algae transported by the Rába River as well as a critically low flow rate. The chlorophyll-a concentration in the seepage water remained low and fluctuated mainly from 1 to 11.8 mg.m-3. The highest values were measured during the spring algae growth in May. The saprobic index represents the self-purification ability of water, the ability to degrade organic pollution. The saprobic index in relation to the respective stretch of river also represents the water quality in the river. Based on measured data on the Slovak side, the saprobic index values in the inspected water bodies (Danube river, reservoir and seepage canals) in 2003 fluctuated in the range from 1.7 to 2.4, which correspond to a beta-mezzosaprobic state. According to the data on the Hungarian side, the saprobic index values in the Danube, the right side river arm system, and the Mosoni Danube ranged from 2.3 to 2.7, which correspond to an alpha-beta mezzosaprobic state. These saprobic index values are typical for this stretch of the river. The self-purification processes, at this level of the saprobic index, run mainly as oxidising processes. Time series data of saprobic index indicate the slightly decreasing tendency (improvement) during the last ten years. The saprobic index in the right side river branch system varied from 2.2 to 2.6, which correspond to alpha-beta mezzosaprobic state. The saprobic index in the Mosoni Danube at the Vének fluctuated from 2.35 to 2.75, which correspond to alpha-mezzosaprobity (A higher saprobic index indicates higher pollution.). Minimal values of the phytoplankton abundance were recorded during the autumn and winter period, while the maximal values occurred in the spring. According to the recorded data along the longitudinal profile from Bratislava to Komárno, a continuous increase of the trophic status in the Danube water is evident, similarly to the previous years. The species diversity in 2003 was rich. The population densities were also high as in the previous year, especially due to the climatic conditions –high temperatures and low flow rates were characteristic in the vegetation period. Maximal values of phytoplankton abundance in the Danube occurred mostly in May and varied from 14150 NrC.ml-1 (Bratislava sampling site) to 15556 NrC.ml-1 (Medveďov). Maximal values in the reservoir mostly occurred in March and the abundance of phytoplankton ranged up to 40360 NrC.ml-1 (sampling site No. 308, Fig. III.12). The Diatoms (Bacillariophycea-Centrales) dominate; they constitute 78-90% of the phytoplankton in the Danube water. During the spring and summer period other algae groups occurred as well (Cryptophyceae, Chrysophyceae, Volvocales, Chlorococalles). The composition of phytoplankton in the seepage canal differs from the composition in the Danube. The percentage of different groups was the following: Bacillariophycea-Centrales – 12-32 %, Bacillariophycea-Pennales – 16-24 %, Cyanophyceae – up to 24 %, Chrysophyceae – up to 19 %, Volvocales – up to 16 % and Chlorococalles – up to 14 %. The water in the seepage canal was relatively poor in algae; the abundance of phytoplankton varied from 14 NrC.ml-1 (sampling site No. 317) to 1096 NrC.ml-1 (sampling site No. 3531). More intensive algae growth in the right side river branch system was observed from March to June along the main river branch between the Szigeti (18658 NrC.ml-1) and the Ásványi arms (41433 NrC.ml-1); the most intensive algae growth occurred in March. The amount of phytoplankton in Mosoni Danube followed the changes in the Danube water. In the Vének profile downstream of Győr the rate of algae accumulation was partly influenced by other hydrological conditions and partly by nutrients delivered by the partially treated wastewater and by watercourses joining the Mosoni Danube at Győr. In the year 2003, a similar composition of zooplankton of Rotatoria and Crustacea groups occurred in the Danube as in the previous year. No increase in the number of individuals of species downstream of the Danube was recorded this year. The zooplankton consists of Rotatoria – 70-96 %, Copepoda – 3-29 % and Cladocera – 1-3 %. According to the species composition the most abundant were families Keratella, Brachiomus and Polyarthra in the Rotatoria group, Daphnia and Bosmina families in the Copepoda group, and the Cyclopidae family in the Cladocera group, similarly to the previous year. The number of species and the abundance of individuals in comparison with the previous year did not change much in the Danube. However, some rare species occurred in the samples as well (e.g. Cypelogapis vorax, Kellikottia longispina, Lecane quadriedentata, Acroperus harpae, Chydorus ovalis, Eurytemora velox). The number of individuals in the seepage water shows a continuous slight decrease in the last 3-4 years. In the Mosoni Danube at Vének the abundance peaked from May to July, the abundance throughout the rest of the year was balanced again, which can be explained by the even flow rate in the Mosoni Danube. The faunistic result of aquatic macroinvertebrate communities of the Danube River remained very similar to those of previous years. At Bratislava a decrease of diversity was detected (12 taxons). The prevailingly common Danube species of the Malacostrata group were observed. At Rajka a community rich in species was found (30 taxons). At the Medveďov site a decrease of species diversity was detected (9 taxons). The results of saprobic index of the Danube water from Bratislava to Komárno correspond to the beta mezzosaprobic state, which is typical for this stretch of the river. Average values of saprobic index in 2003 varied from 1.88 (at Dobrohošť) to 2.31 (at Bratislava). The improvement of the water quality in the Danube is shown also by the occurrence of species demanding clean water: Ancylus fluviatilis, Theodoxus fluviatilis, Heptagenia sp. div., Brachycentrus montanus. The saprobic index at sampling sites in the reservoir varied from 2.04 (at Kalinkovo-navigation line) to 2.69 (at Šamorín No. 311), which correspond to a beta-alpha mezzosaprobic state. Altogether 79 invertebrate taxa were found in the year 2003 in the four profiles of the Danube, as well as in the two profiles at Locks I. and II. The majority of animals belonged to Molluscs and Bivalvia. However, the most characteristic animals in the Danube belonged to Malacostrata. In the right side river branch system in the inundation area various rheophile communities of molluscs, crustaceans and insects were observed. Common presence of rheophile species and species of stagnant water shows that the water supplied to the flood plain became a gradually richer and diverse habitat. The lowest number of invertebrate taxons characterized the Vének sampling site on the Mosoni Danube. Species preferring sediments rich in organic material were dominant (Criodrilus lacuum). Based on the obtained results it can be stated that the saprobic indexes of periphyton on every sampling site in the Danube in 2003 varied in the range of a better beta-mezosaprobic state. The saprobic index of periphyton ranged from 1.61 (at Rajka) to 2.1 (at Dobrohošť). The range of values was wider than in the previous year. According to the species diversity of the periphyton the Diatoms were dominant. Families of the Fragilariaceae group as well as the families of the Achnanthaceae group were frequent, but the most frequent were the families of the Naviculaceae group and the Bacillariaceae group. The Cyanophyta were sparse. Quality of sediments Sampling of riverbed sediments in the frame of joint Slovak-Hungarian monitoring had been performed in September 2003 by the Hungarian and Slovak Parties, Fig. III.20. Inorganic and organic micro components were analysed and the content of total phosphorus and nitrogen was also determined. In 2003 the Hungarian and Slovak Parties in their National Annual Reports from environmental monitoring used different standards for sediment quality evaluation. The Slovak Party used the “Canadian Sediment Quality Guideline for Protection of Aquatic Life” published in 2002. The Hungarian Party used for sediment quality evaluation the “Provincial Sediment Quality Guidelines”, the so-called “Canadian list”. Detailed evaluations are parts of the respective National Annual Reports. According to the “Canadian Sediment Quality Guideline for Protection of Aquatic Life”, used by the Slovak Party, contents of heavy metals and organic pollution in sediments at designated sampling sites did not reach the limits of the Probable Effect Level (PEL) in any case. According to the “Provincial Sediment Quality Guidelines”, used by the Hungarian Party, contents of heavy metals and organic pollution (PAH) at designated sampling sites did not reach the limits of the “Severe Effect Level” (SEL) in any case. However, there were sampling sites where the concentrations of heavy metals, except cadmium, exceeded the bottom limits of the “Lowest Effect Level” (LEL). According to obtained results it can be stated that the highest accumulation of heavy metals was recorded at the Vének profile on the Mosoni Danube, and the lowest concentrations were observed in the seepage canal. The PAH contamination did not exceed the respective limits for the “Lowest Effect Level” at any of the examined sampling points (2000 mg.kg-1). The total phosphorus content in sediments slightly exceeded the limit value of “Lowest Effect Level” (600 mg.kg-1) at all sampling sites, except the sampling sites at Rajka and Dunaremete on the Danube and in the seepage canal. The total nitrogen content in sediments exceeded the limit value of “Lowest Effect Level” (600 mg.kg-1) on all sampling points. However, the total nitrogen contents did not exceed the “Severe Effect Level” (4800 mg.kg-1) at any of sampling sites. Differences in the data measured by the Slovak and Hungarian Parties According to results obtained in the hydrological year 2003, it can be stated that at sampling sites that were sampled at the same time and at the same place, a good concordance was reached in the major part of examined parameters. However, there exist parameters where parameter values measured by the Parties are different (e.g. Ntotal, suspended solids, Coliform bacteria, NH4+ and dissolved oxygen). In the hydrological year 2003 we can find differences in the data measured by the Slovak and Hungarian Parties in case of pH, sulphates, chlorides, Fe, Mn, heavy metals, BOD and saprobic index. In the frame of the Transboundary Water Commission, a new methodology and mode of evaluation has been accepted, which was applied starting in January 2004, so further improvement in data concordance is expected. Conclusions Increased or decreased values of some parameters in the Danube, seen from the long-term evaluation, were already observed at Bratislava where the Danube water quality generally improved. This influences the surface water quality in the territory monitored according to the Agreement. The hydrological year 2003 differed from the previous year by long lasting high air temperatures, an extremely low flow rate during the vegetation period, and a shortage of precipitation. Fluctuation of individual parameters characterising the surface water quality in the right-side river branch system, due to the continuous water supply since 1995, was in most cases modified, and follows their fluctuation in the Danube water. The tessellation character of water bodies along the path of the water supply decreased, as a consequence of changed water regime dynamics. The tributaries and local pollution of settlements, besides the water supply influence, determine the water quality in Mosoni Danube. Before the confluence with the Danube the water quality state is labile (variable in time), which is proved by unfavourable values of some parameters (Coliform bacteria, BOD, nitrates, total phosphorus sulphates and saprobic index), while in parameters characterising the oxygen regime, dissolved solids, iron concentration and COD improvement can be observed. In the following table an orientational classification of the sampling sites into the quality groups was done according to the trans-boundary water quality criteria. It has to be mentioned that the classification criteria significantly changed in 2003. In the frame of the Transboundary Water Commission the classification of six quality groups changed to five quality groups. Besides this, significant changes in limit values for several parameters were introduced as well (e.g. nitrates, total nitrogen, etc.). In the case of manganese, Cd, As, Hg and saprobic index the classification to quality groups was done according to the agreed limit values. However, there are differences in the measured data between the Hungarian and Slovak sides, so that they could be classified into different quality groups. Differences in other parameters (heavy metals, Fe, etc.) are not reflected by classification into different quality groups. The quality classes are determined according to the 90% durability of measured values (C90). This classification does not differentiate according to the specific conditions the respective values were recorded (e.g. hydrological conditions – floods, high or extremely low flow rates, oscillation of parameters). The given orientational classification gives only a comparison of the water quality inflowing to the influenced area (sampling site at Bratislava) and the water quality leaving the system (sampling site at Medveďov). The classification of the sampling sites in the Danube old riverbed and sampling sites on the Mosoni Danube, right side river branch system and in the seepage canal were done in a similar way. From the Table 5 is clear that the water quality entering the hydropower system and the water quality leaving the system is very similar. Table 5: Parameters, or groups of parameters, according to the agreed limits for classifying surface water quality
This classification is taken from enclosure IV. of Protocol [8]. From the ecological viewpoint some estimated quality classes are misleading. In the Danube at Bratislava at least temperature, pH, conductivity, Cl, suspended solids, and some others, are natural background values, including fluctuations. Some others are characteristics of denitrification and some of so called self-purification processes. Some parameters are products of photosynthetic processes, where the process is characterized by change and not a value of parameter. In reality, the Danube water is of better quality, than it appears the Table 5 (rem. red.).
|
||||||||||||||||||||||||||||||||||||||||||||||||||||||||||||||||||||||||||||||||||||||||||||||||||||||||||||||||||||||||||||||||||||||||||||||||||||||||||||||||||||||||||||||||||||||||||||||||||||||||||||||||||||||||||||||||||||||||||||||||||||||||||||||||||||||||||||||||||||||||||||||||||||||||||||||||||||||||||||||||||||||||||||||||||||||||||||||||||||||||||||||||||||||||||||||||||||||||||||||||||||||||||||||||||||||||||||||||||||||||||||||||||||||||||||||||||||||||||||||||||||||||||||||||||||||||||||||||||||||||||||||||||||||||||||||||||||||||||||||||||||||||||||||||||||||||||||||||||||||||||||||||||||||||||||||||||||||||||||||||||||||||||||||||||||||||||||||||||||||||||||||||||||||||||||||||||||||||||||||||||||||||||||||||||||||||||||||||||||||||||||||||||||||||||||||||||||||||||||||||||||||||||||||||||||||||||||||||||||||||||||||