PART 5
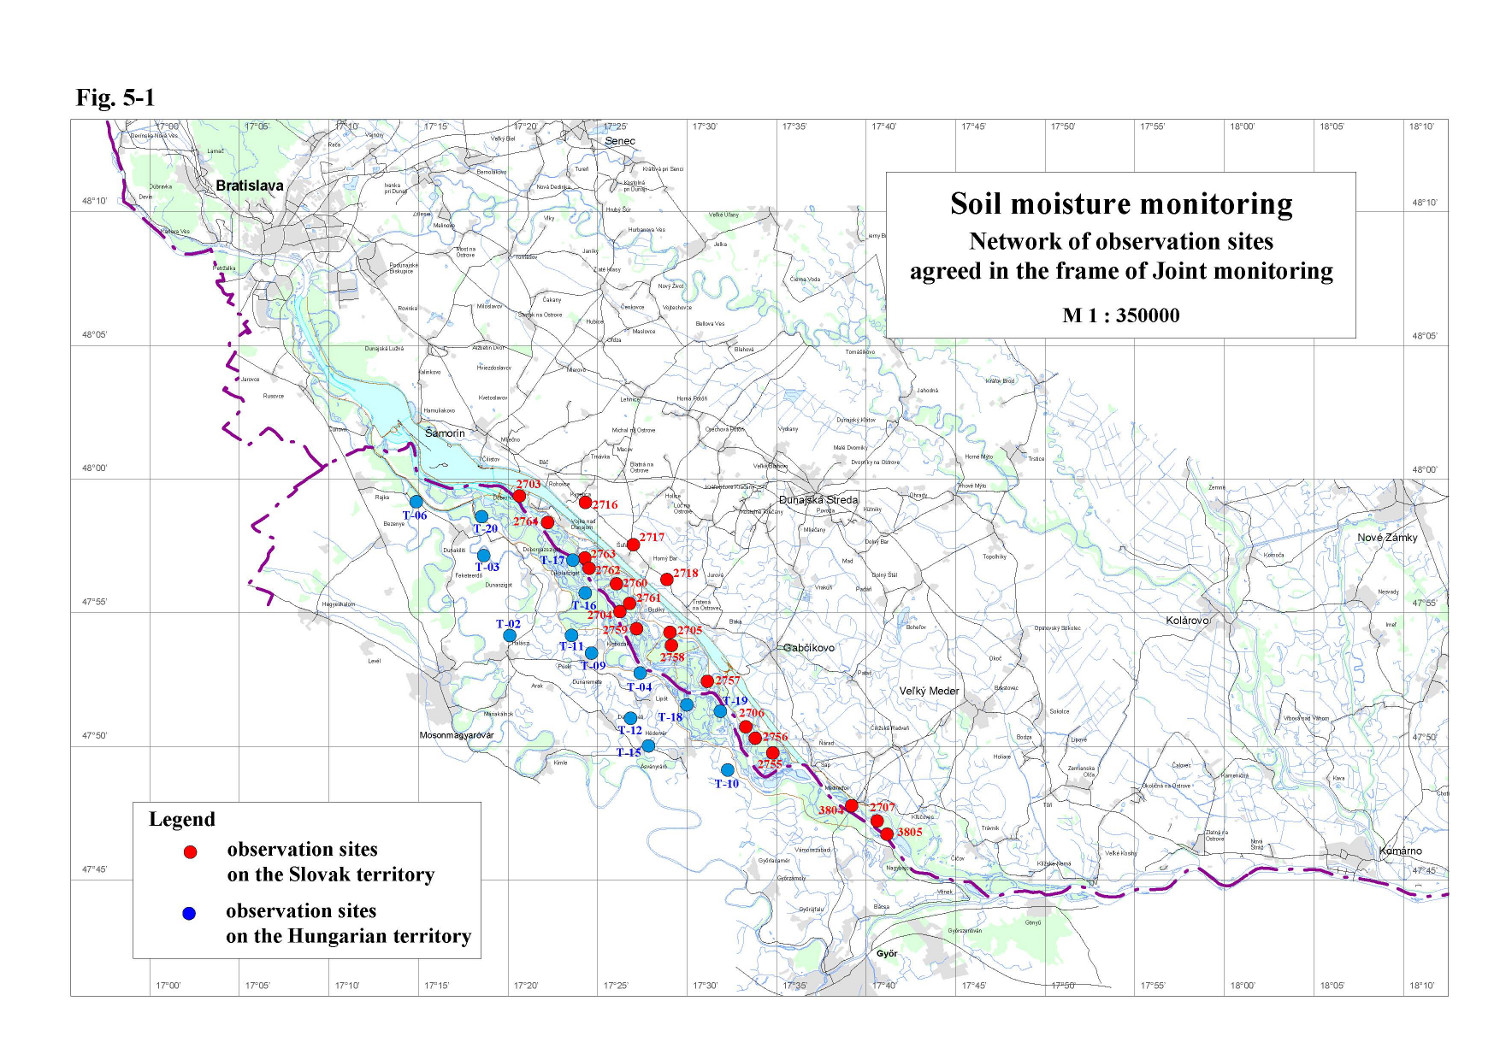
Soil Moisture Monitoring5.1. Data collection methodsThe soil moisture monitoring in the year 2011 continued without changes. The Slovak side measures the soil moisture by a neutron probe up to a prescribed depth or to the depth of the groundwater level. The Hungarian side measures the soil moisture with a capacity probe to the depth of maximum 3 m. The soil moisture is expressed by the total soil moisture content in volume percentage. Measurements are performed in 10 cm depth intervals. There are 20 monitoring areas on the Slovak side (12 forest monitoring areas, 5 biological monitoring areas and 3 agricultural areas) – Table 5-1. On the Hungarian side there are 14 monitoring areas (6 forest monitoring areas and 8 agricultural areas) – Table 5-2. The situation of observation objects is displayed on Fig. 5-1. Table 5-1: List of monitoring stations on the Slovak side
Table 5-2: List of monitoring stations on the Hungarian side
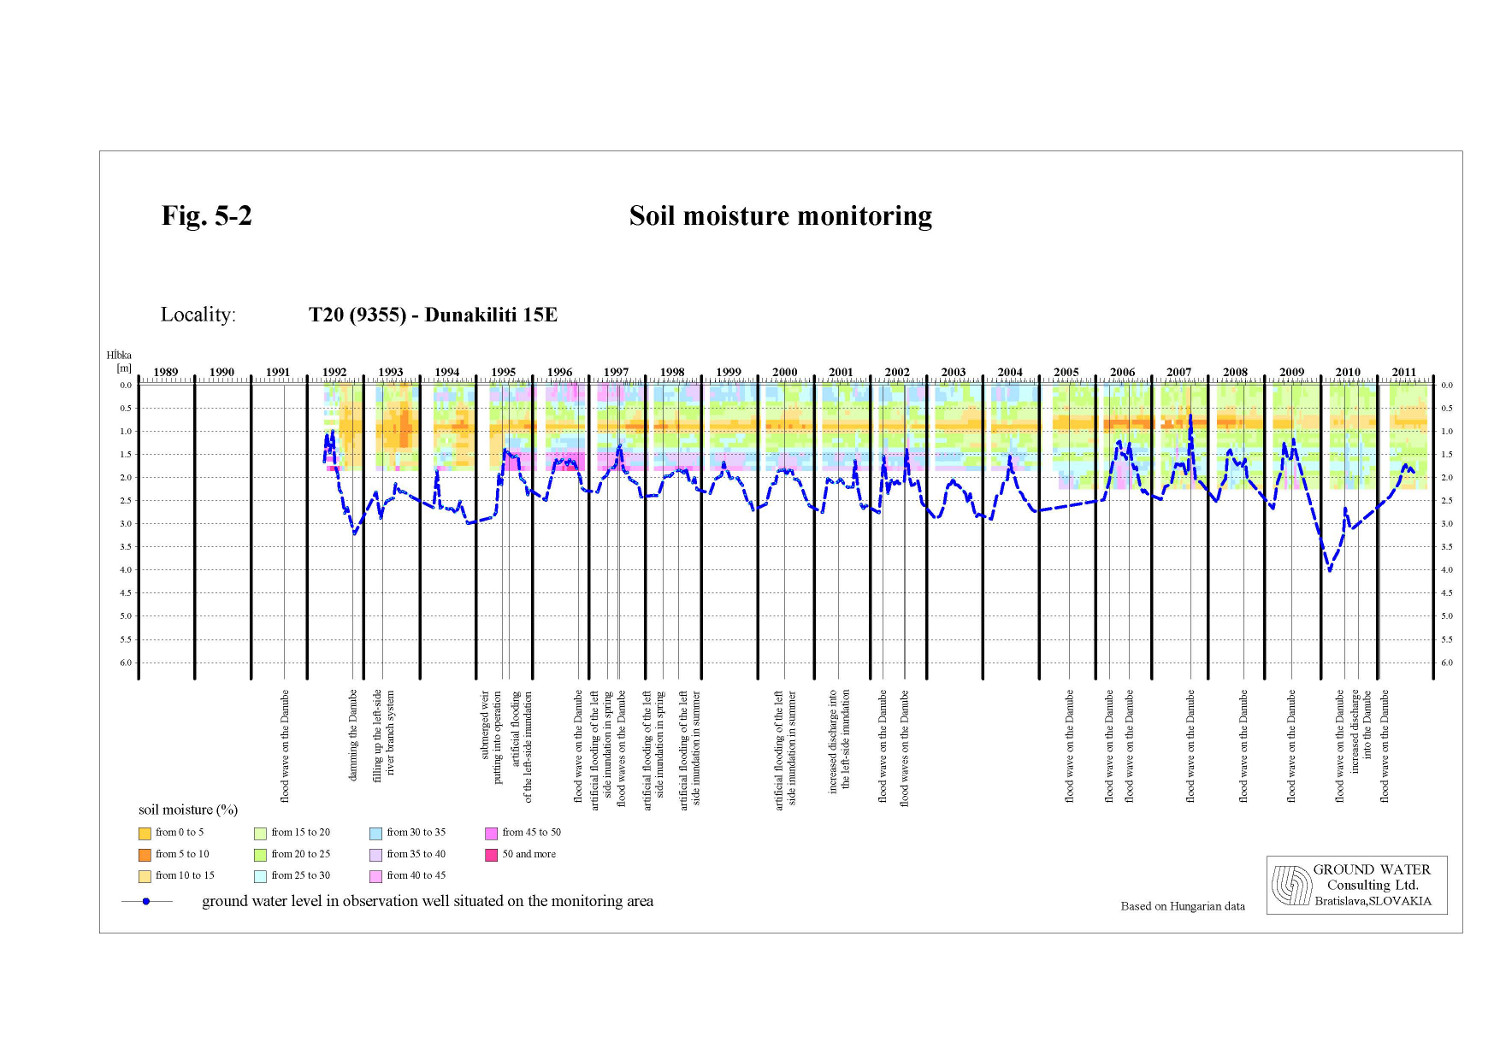
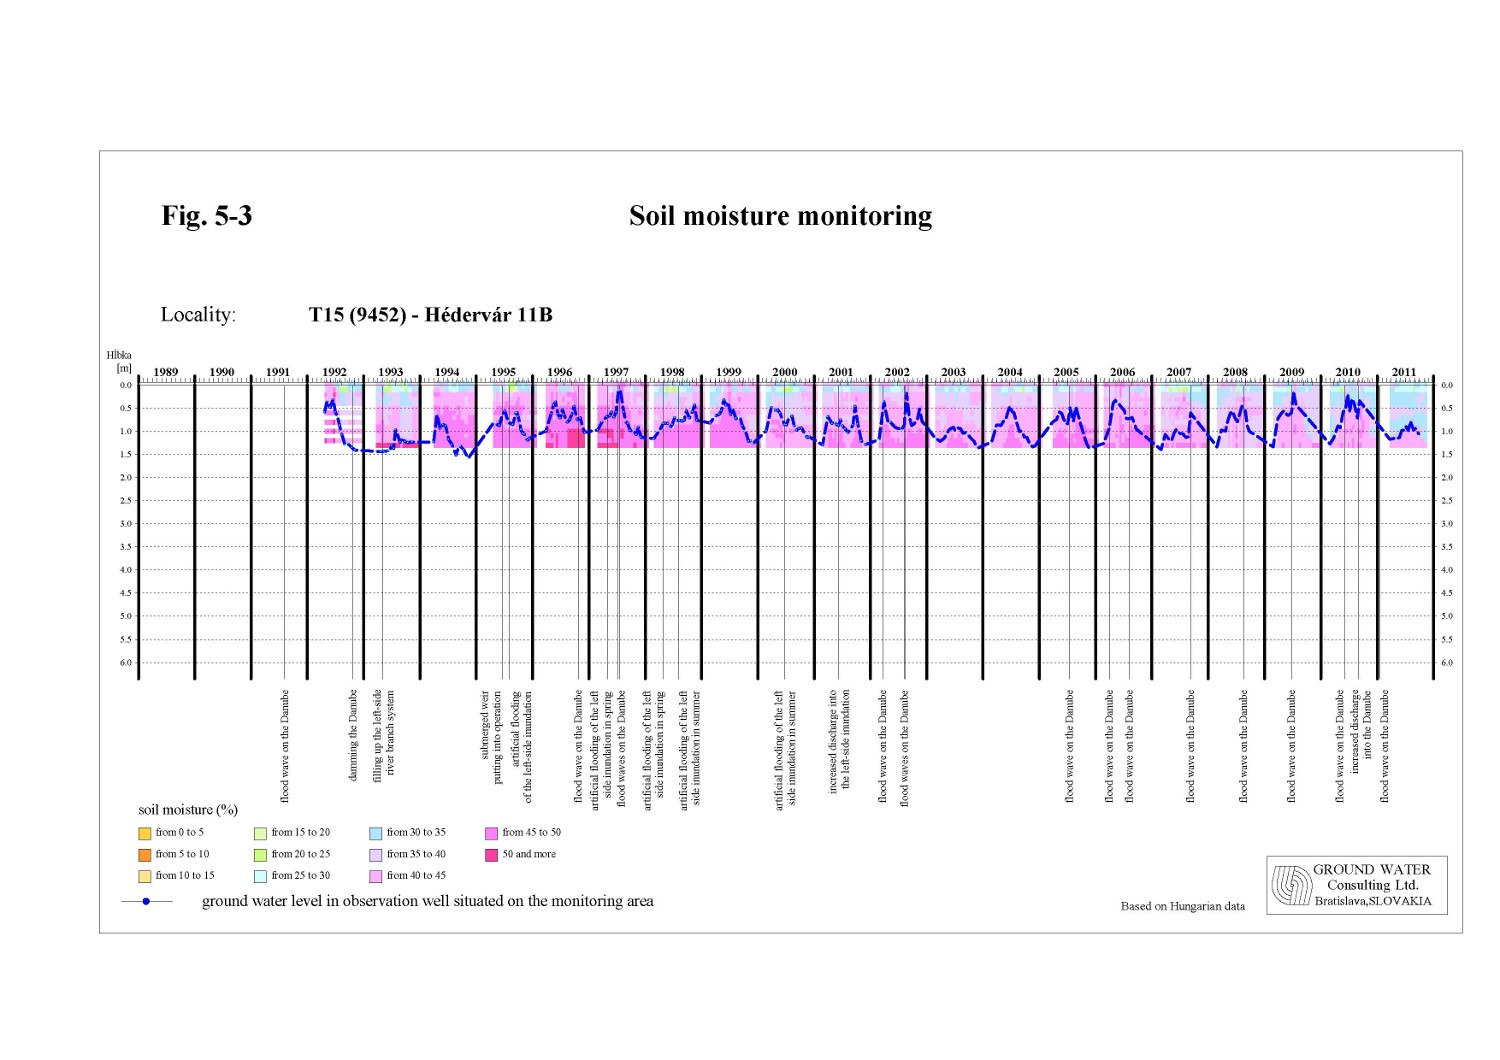
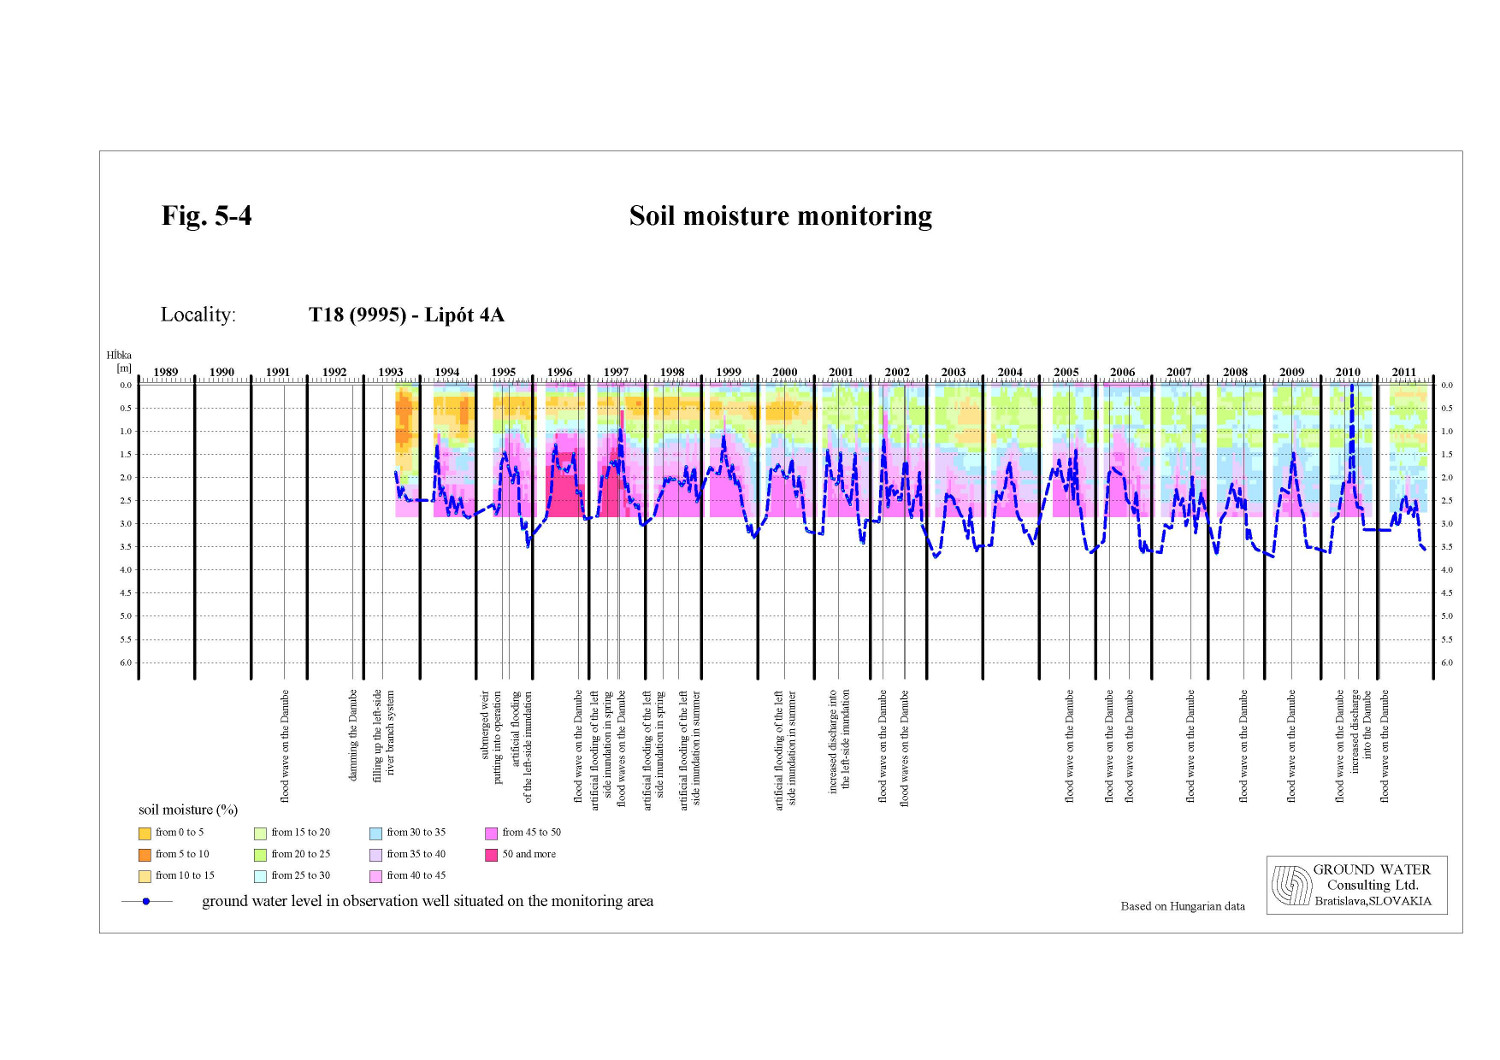
5.2. Data presentation methodsThe soil moisture content is displayed in figures showing the average volume percentage for the depth interval from 0 to 100 cm and from 110 to 200 cm. Slight difference is in the Hungarian data presentation, where the value for a depth interval under 110 cm can represent the average value from less than 10 measured values. At selected sampling sites the exact soil moisture measurements are presented in colour figures with soil moisture time distribution for the whole measured depth. The graphical presentation of every monitoring sites is given in the Slovak and Hungarian National Annual Reports. 5.3. Evaluation of results on the Hungarian sideIn the year 2011 14-cycles of soil moisture measurements were performed on the Hungarian side. Measurements were performed at forest monitoring sites in the floodplain area and at agricultural sites in the flood-protected area (Fig. 5-1). The moisture conditions of soils are essentially influenced by the rainfall conditions, by the soil layer thickness and its composition, as well as by the groundwater level position. The soil moisture content at the end of March was slightly lower in comparison with the year 2010. The initial soil moisture content continuously decreased due to insufficient precipitation during the year. In the upper part of the soil layers the soil moisture content was lower during the whole year in comparison to the previous year. To the end of the vegetation period the difference in soil moisture content exceeded 10 %. Similar situation was also in layers below 1 m depth. The soil moisture content was also lower in comparison with the previous year. The difference in soil moisture content exceeded 10 % at sites where the groundwater did not reached soil layers. The highest soil moisture values were mostly recorded at the beginning of measurements in March. Minimal values of soil moisture were registered at the end of the vegetation period (September to November). Generally it can be stated that the average soil moisture in 2011 was lower than in the previous year. The soil moisture on forest monitoring sitesIn general, the soil moisture content at forest monitoring areas was lower or significantly lower in comparison with the previous year. At the beginning of the vegetation period the soil moisture content reached similar or slightly lower values than in the previous year. Significantly lower soil moisture content was recorded at the monitoring site T17, and at monitoring sites T16, T19 and T20 in the layer below 1 m depth. The minimal average values in layers to one-meter depth, depending on the position of monitoring site, occurred mostly at the end of the vegetation period (between September and November – T16, T17, T18, T19, T20), at the monitoring site T15, where the soil moisture content was influenced by the groundwater, the minimal average value occurred in May. The minimal average values in the layer below one-meter depth similarly occurred mostly at the end of the vegetation period (October and November). Only at the monitoring site T20 the minimal average value occurred in July. The maximal average soil moisture values in both layers, down to one-meter depth and below one-meter depth mostly occurred in March. Only in case of monitoring site T15 the maximal average value occurred in July in the layer down to 1 m depth and in August and September in the layer below 1 m depth. The groundwater level all over the year supplied the soil layers on monitoring site T15 (Fig. 5-3), on monitoring sites T16, T18 and T20 the groundwater supplied the soil layers from June to September (Fig. 5-2, Fig. 5-4). Table 5-3: The minimal and maximal average soil moisture contents at forest monitoring sites
The soil moisture on agricultural monitoring sites on the flood protected side Similarly to forest monitoring sites the soil moisture content was lower or significantly lower in comparison with the previous year. At the beginning of the vegetation period the soil moisture content reached similar or slightly lower values than in the previous year. Significantly lower soil moisture content was recorded at the monitoring site T02, and at monitoring sites T09 and T10 in the layer below 1 m depth. The soil moisture content at monitoring sites T02, T06 and T09 mostly depend on precipitation and weather conditions. The groundwater level influenced the soil profile at monitoring sites T10, T11 and partially at monitoring sites T02 and T12. The minimal values of the soil moisture in the layer down to one-meter depth were recorded during autumn months in September and October. The minimal average values in the soil layers below 1 m depth occurred from May to November, depending on the monitoring site location, groundwater level fluctuation and also irrigation. The maximal average soil moisture values in the layer down to one-meter depth occurred in March. In the layers below one-meter depth the maximal values mostly occurred in March and April. Only in case of monitoring site T03 and T10 the maximal average value occurred in November and July respectively. Monitoring sites T02, T10, T11 and T12 represent agricultural areas in the Middle and Lower Szigetköz. These monitoring sites have a thick covering layer and throughout the vegetation period the groundwater level moisturised the bottom part of soil layers. Table 5-4: The minimal and maximal average soil moisture contents at agricultural monitoring sites
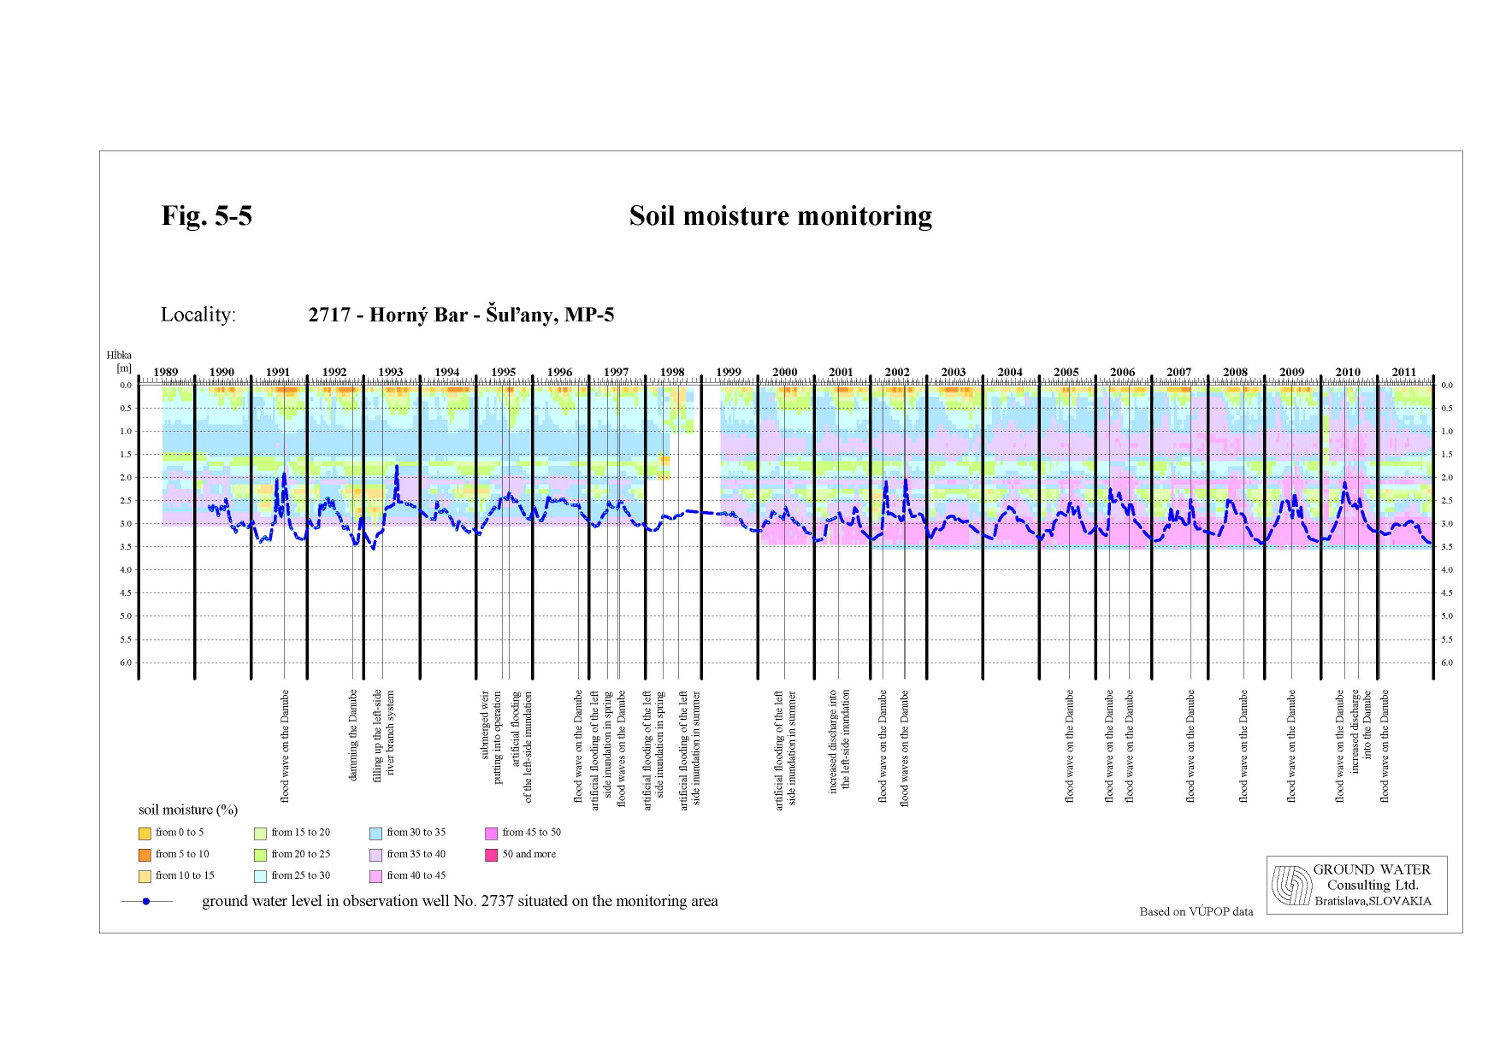
5.4. Evaluation of results on the Slovak sideMonitoring sites on the Slovak side are situated in the inundation area and flood-protected agricultural area (Fig. 5-1). The soil moisture at monitoring sites situated behind the derivation channel in the agricultural area (sites No. 2716, 2717, 2718) is stable during the whole observation period. Since the year 2004 slight increase in the soil moisture content can be observed, while the groundwater level position and fluctuation remained unchanged (Fig. 5-5). In the year 2011 the groundwater level at monitoring site No. 2716 fluctuated in depths of 3.5-4.2 m and for the first time the groundwater level did not raise above 3.5 m. The groundwater level at site No. 2717 fluctuated in depths of 3.0-3.5 m, and also here it did not raise above 3.0 m for the first time. At monitoring site No. 2718 the groundwater level fluctuated in depths of 2.5-3.0 m, and for the first time it did not raised above 2.5 m. The unfavourable groundwater level position in the year 2011 was caused by low flow rates in the Danube during the vegetation period. In the year 2011 the fluctuation of soil moisture content in both depth intervals depended on climatic conditions. Only at the monitoring site No. 2718 the layers in the depth from 1 to 2 m were partially influenced by the groundwater level. The average soil moisture content in the depth down to 1 m in the year 2011 fluctuated in the range from 5.1 to 21.5 % at monitoring site No. 2716, in the range from 23.3 to 35.9 % at monitoring site No. 2717 and in the range from 25.1 to 36.3 % at monitoring site No. 2718. When comparing these values with the previous year it can be stated that the soil moisture content in 2011 was lower regarding the minimal and also the maximal values. The soil moisture was well supplied only during the winter period. Generally, the soil moisture content started to decrease significantly in the second half of March and the decrease continued till the end of the year. The minimal average values occurred in December 2011, the maximal average values were registered in January 2011. In the depth between 1 and 2 m, the soil moisture content mostly varied from 15.0 to 20.6 % at monitoring site No. 2716, in the range from 28.9 to 34.8 % at monitoring site No. 2717 and in the range from 13.4 to 23.9 % at monitoring site No. 2718. The situation regarding the minimal and maximal average values average values was similar as in the upper layer. The minimal average values were recorded at the end of the year 2011 and the maximal average values in January 2011. Table 5-5: The minimal and maximal average soil moisture contents at agricultural monitoring sites
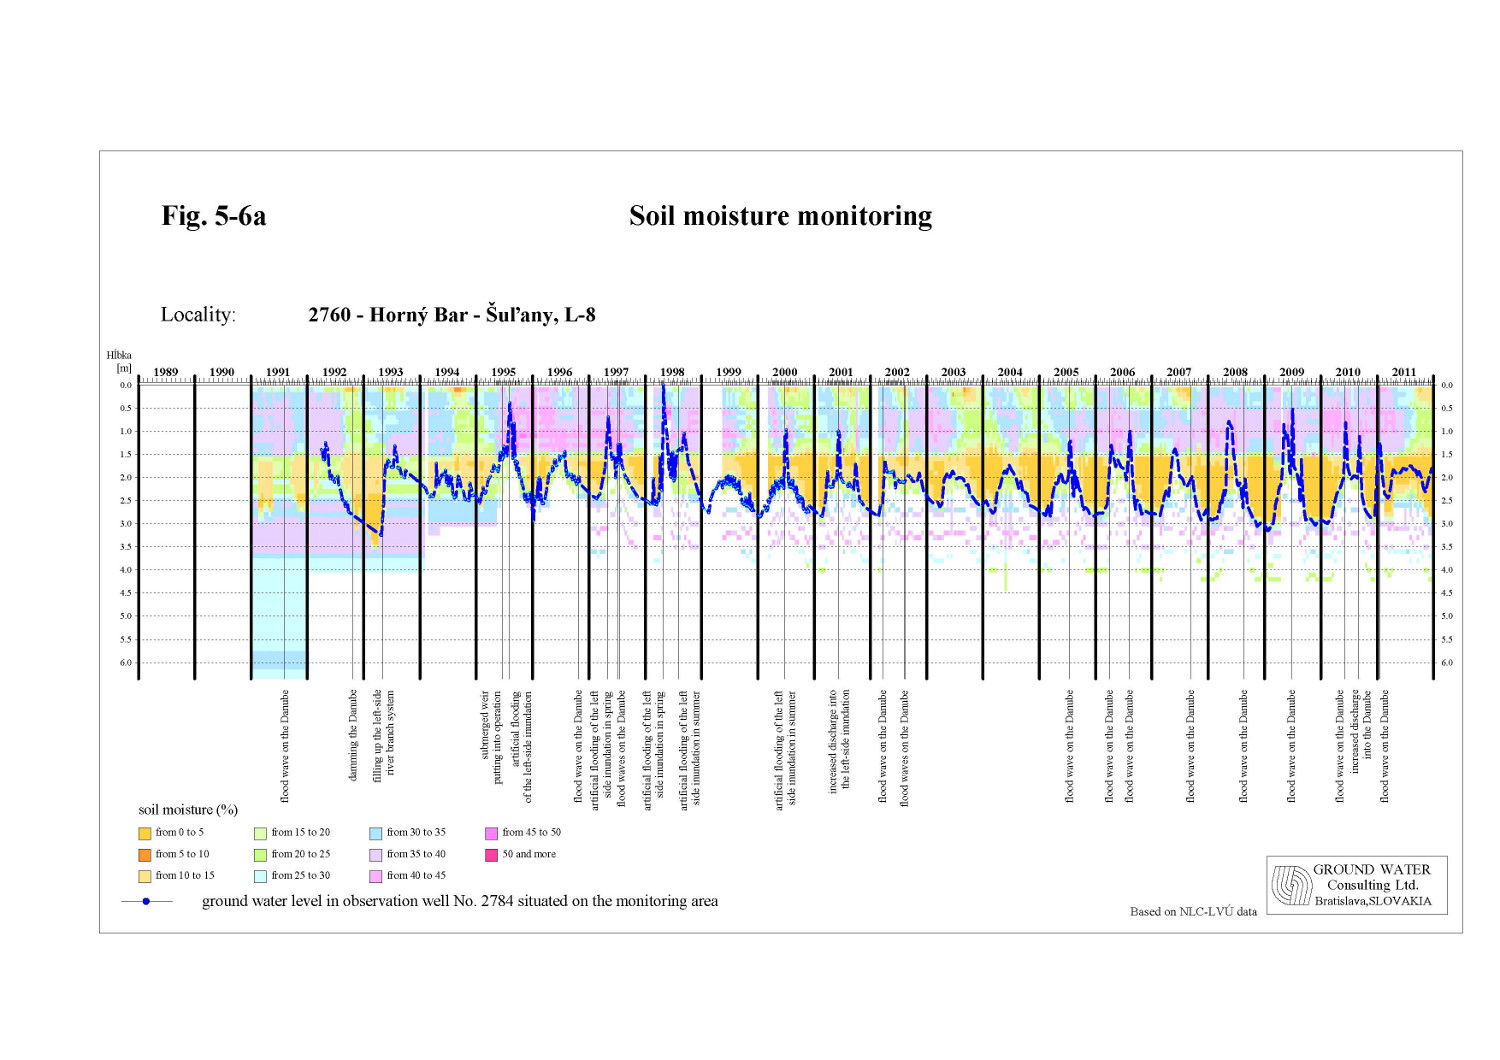
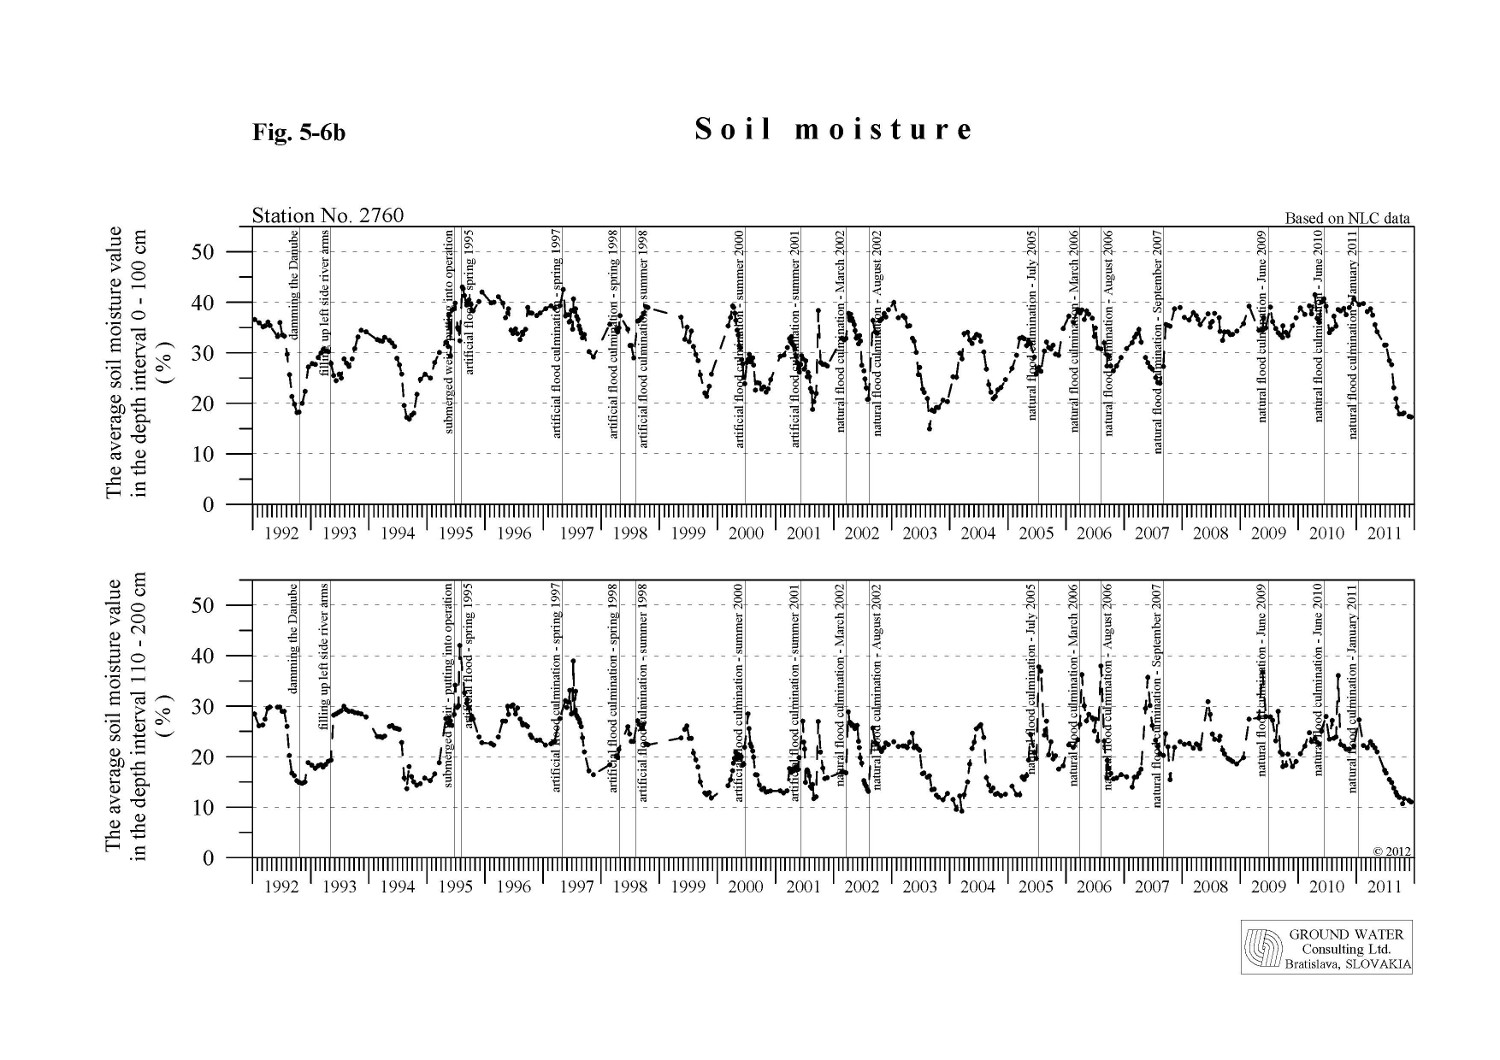
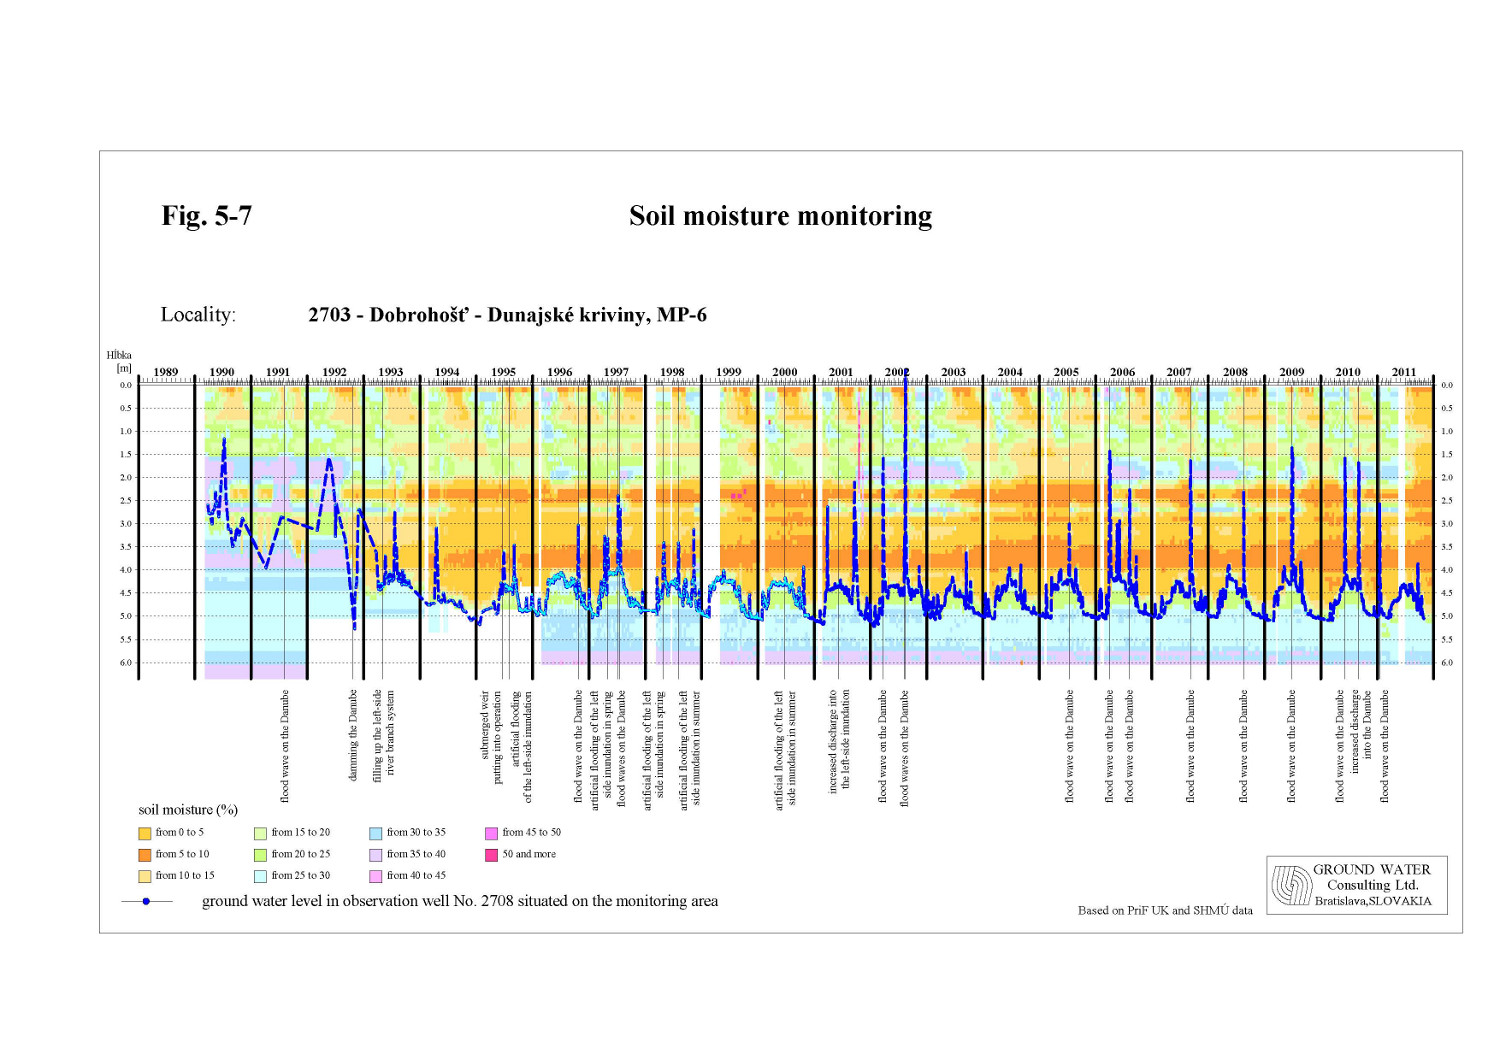
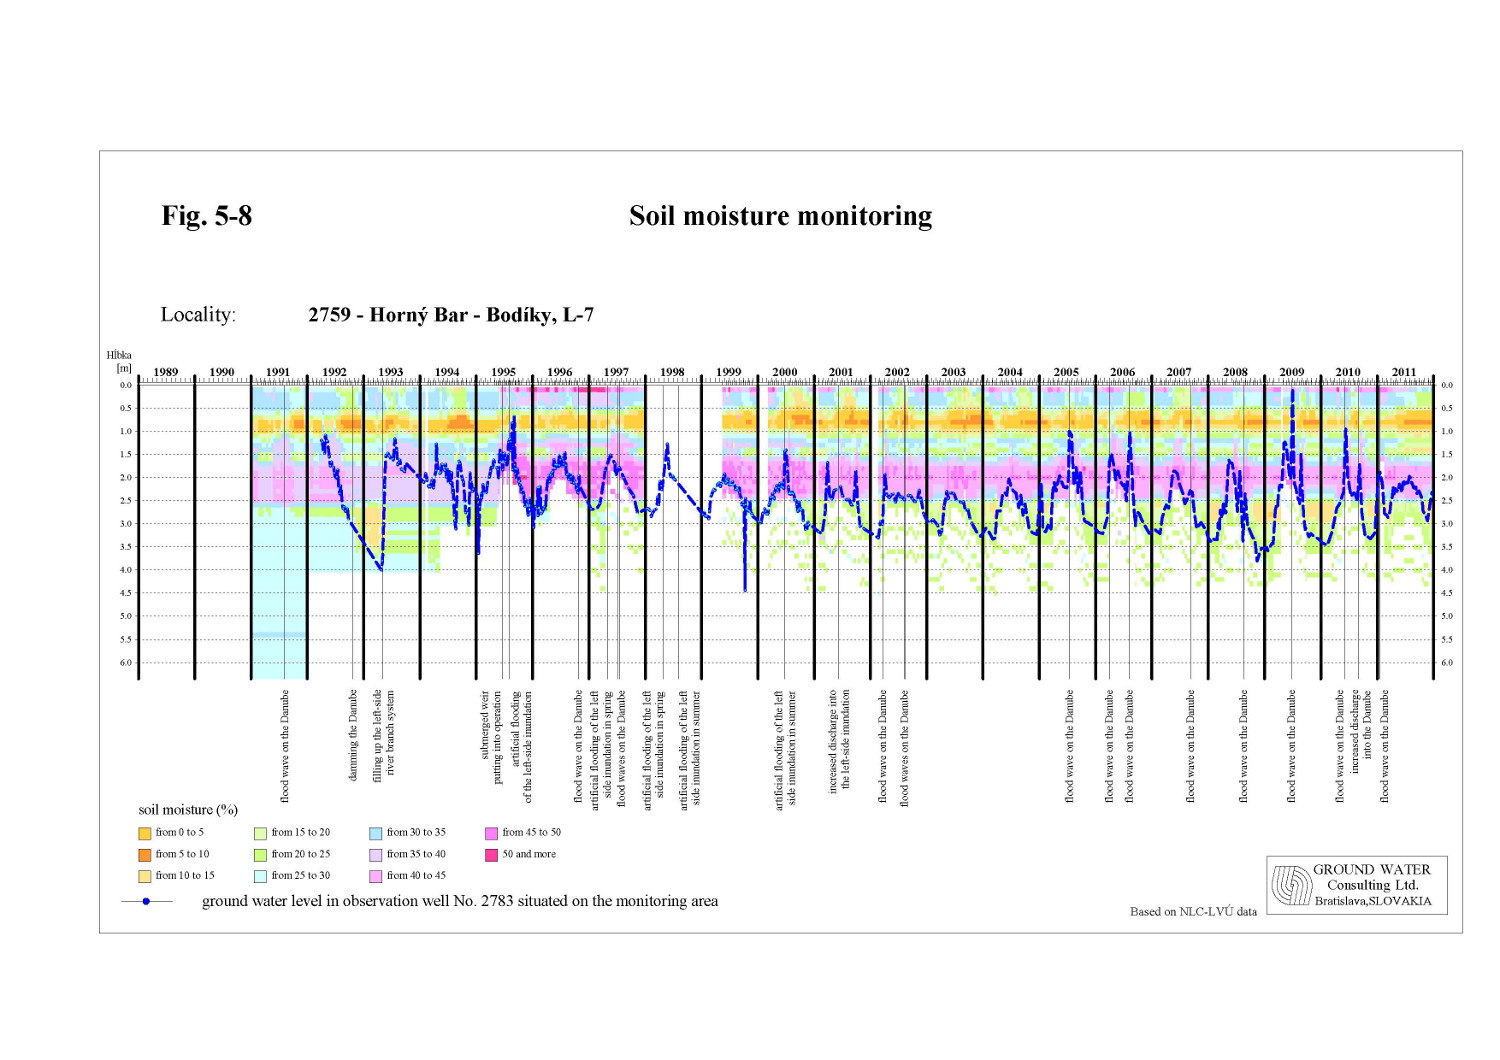
The soil moisture in the inundation area, along with the groundwater level and precipitation, is highly dependent on natural or artificial floods. In the year 2011 partial flooding of inundation occurred during the winter period in January. The highest flow rate reached 7214 m3.s-1, what means that the lower part of the inundation area was flooded. The soil moisture content at the beginning of the year was rather high, thanks to the flood wave in January, but generally it was lower than in the previous year. The maximal average values mostly occurred in the period from January to March. However, at monitoring sites influenced by the water level fluctuation in the Danube, the maximal average soil moisture values occurred during discharge waves in July and August, especially in the layer below 1 m depth (monitoring sites No. 2755, 3804 and 3805). The lowest average values in both, the layers down to 1 m depth and below the 1 m depth, were mostly recorded at the end of the year in November and December. However, significant decrease of soil moisture content was already recorded from the end of August. At monitoring sites No. 2703, 2704, 2705, 2707, 2755, 2758, 2759 and 2761 the soil moisture content at the end of the year reached the lowest or almost the lowest values recorded in the whole period of observation. Concerning the minimal and the maximal average values it can be generally stated that they were lower than in the previous year on most of monitoring sites. Higher values were recorded only at monitoring sites No. 2761, 2763 and 2764 in the layer below 1 m depth. The thickness of soil profile at monitoring sites No. 2703, 2764, 2763, 2762 and 2761 in the upper part of the inundation area is low, similarly to the Hungarian side. The groundwater level at these places fluctuates only in the gravel layer. In 2011 the groundwater level on area No. 2703 fluctuated from 2.5 to 5 m, on areas No. 2764, 2763, 2762 and 2761 changed from 0.8-4.5 m. Layers to 1 m depth were strongly dependent on climatic conditions, however the flood wave in the Danube in January had a great influence on groundwater level and the soil moisture content (Fig. 5-7). Layers below 1 m depth were also influenced by the groundwater at the time of increased discharge into the Danube old riverbed in July and August. Maximal average soil moisture contents occurred after flooding the area, minimal average values occurred at the end of the year (from October to December). The thickness of the soil profile in the middle part of the inundation area is higher. In general the groundwater regime in this region is influenced by the water supply of the river branch system, introduced in May 1993. Moreover, the natural or artificial floods have significant influence on the groundwater level. The groundwater level in 2011 fluctuated slightly above the boundary between the soil profile and gravel layers - monitoring sites No. 2704, 2705, 2758, 2759, 2760 (Fig. 5-6a, Fig. 5-6b, Fig. 5-8) and partially supplied the soils with water in the vegetation period. The maximal values of average soil moisture content in both, in the layer down to 1 m depth and in the layer below 1 m depth occurred from January to March 2011, minimal values were mostly reached in November and December 2011. Table 5-6: The minimal and maximal average soil moisture contents at forestry monitoring sites
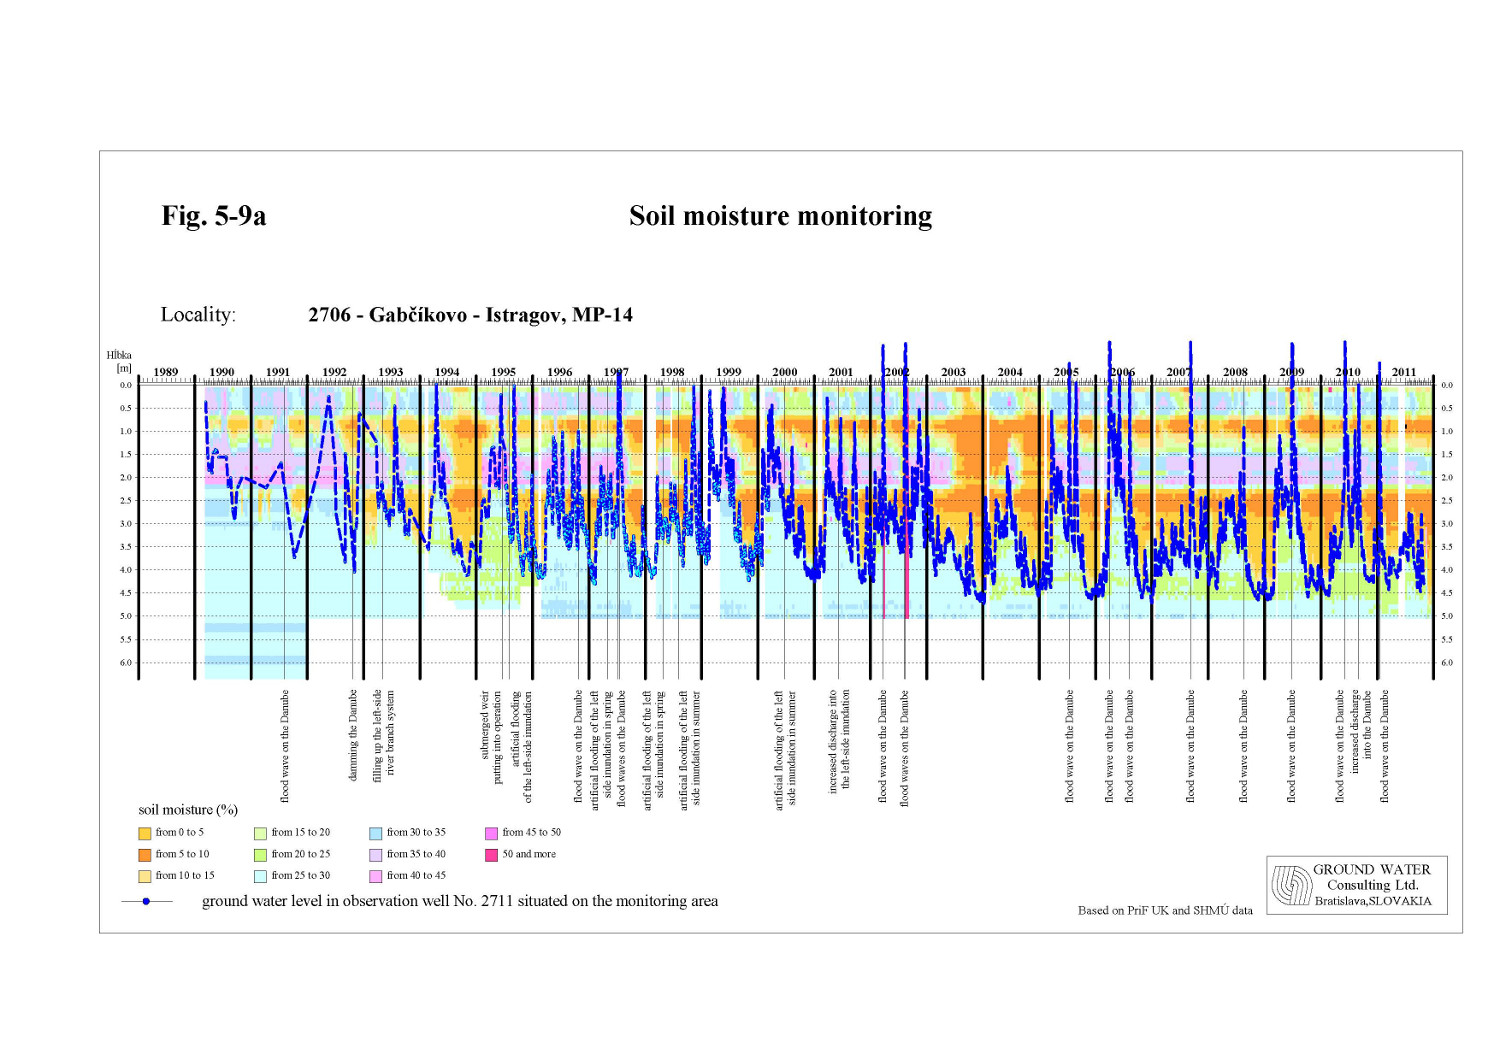
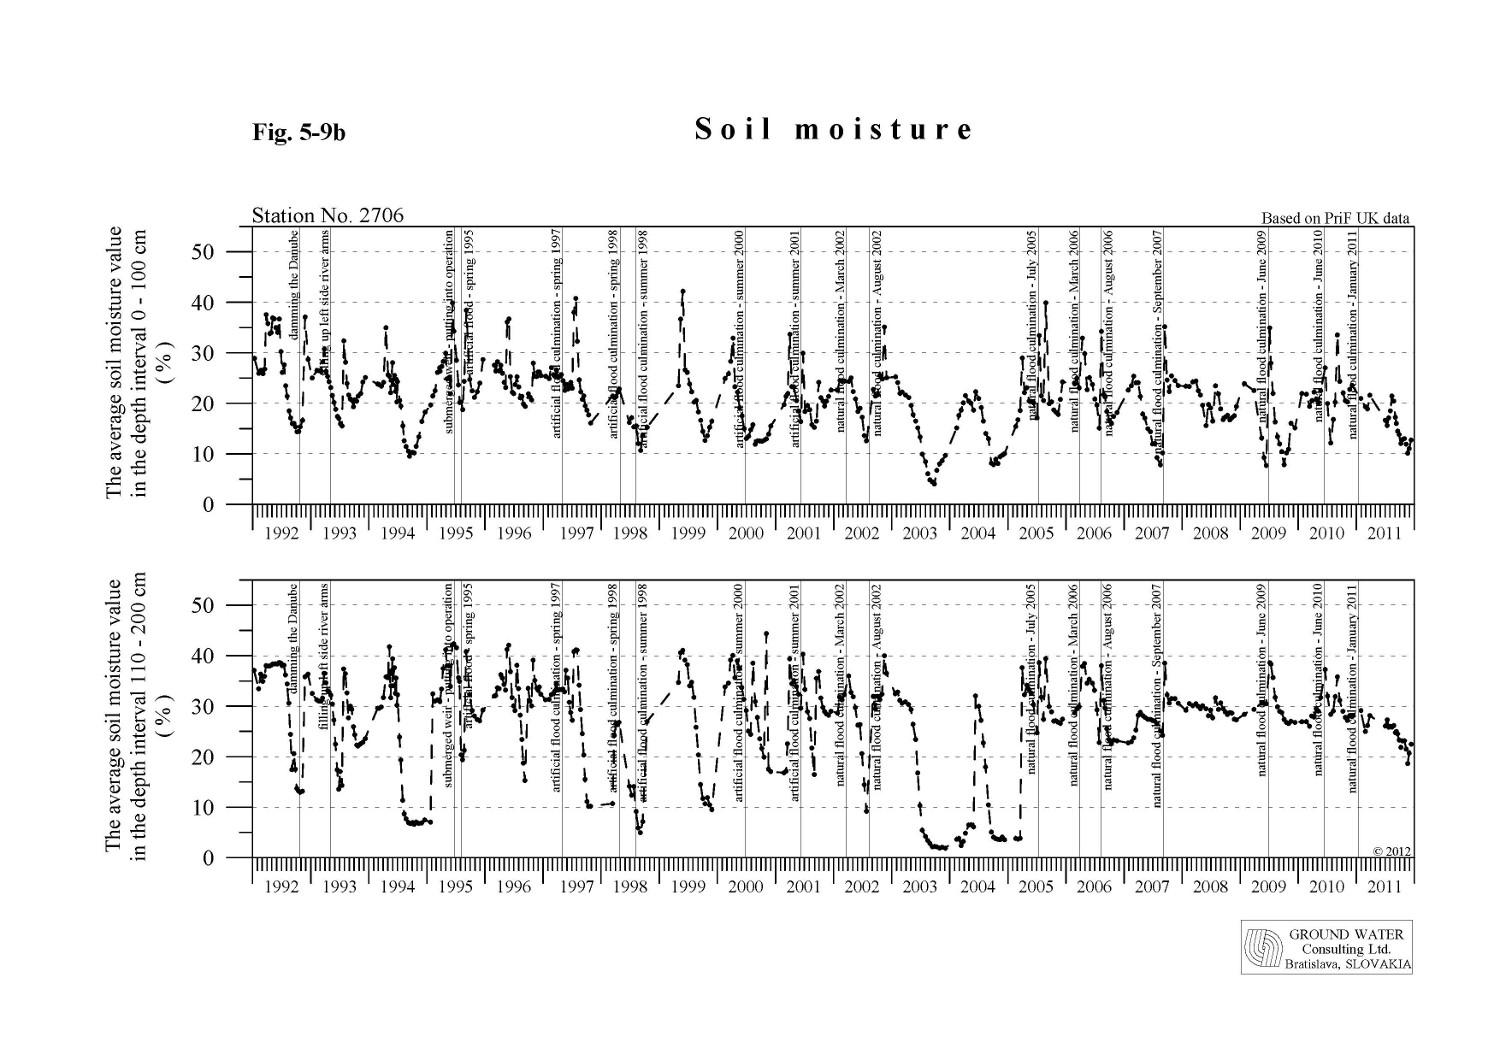
In the lower part of inundation area, downstream of confluence of the river branch system and the Danube (monitoring sites No. 2706, 2756, 2755), the groundwater level usually fluctuates around the boundary between the soil profile and gravel layer. Since the discharges in the Danube in 2011 were rather low, except the flood wave in January, the groundwater level fluctuated mostly below this boundary. Monitoring sites were flooded during the flood wave in January. Due to riverbed erosion the groundwater level, except the flood wave, fluctuated in the depth between 2.2 and 4.5 m. As a result of this, the soil moisture in 2011 was mostly dependent on precipitation. Significant refill occurred in July and August during discharge waves on the Danube, but these influenced only the lower parts of the soil profile. Generally the soil moisture content continuously decreased during the whole year. At the monitoring site No. 2755 the minimal average value of soil moisture in both layers occurred at the end of August, at the monitoring sites No. 2706 and 2756 in November 2011. The maximal average values of soil moisture were reached after the flood wave in January 2011 (Fig. 5-9a, Fig. 5-9b). The soil moisture contents at monitoring sites No. 2707, 3804, 3805, that are located in the inundation below the confluence of the tailrace canal and the Danube old riverbed, are highly influenced by the flow rate regime in the Danube. The maximum average values in 2011 in both, the layer down to 1 m depth and in the layer between 1 and 2 m depth, occurred in January, while the minimum values occurred at the end of the year 2011. The groundwater level at monitoring sites No. 2707, 3804 and 3805 fluctuated in the depth 0-3.5 m. The riverbed erosion negatively influences also these monitoring areas. During low flow rates the groundwater level does not supply the soil profiles sufficiently.
|
|||||||||||||||||||||||||||||||||||||||||||||||||||||||||||||||||||||||||||||||||||||||||||||||||||||||||||||||||||||||||||||||||||||||||||||||||||||||||||||||||||||||||||||||||||||||||||||||||||||||||||||||||||||||||||||||||||||||||||||||||||||||||||||||||||||||||||||||||||||||||||||||||||||||||||||||||||||||||||||||||||||||||||||||||||||||||||||||||||||||||||||||||||||||||||||||||||||||||||||||||||||