PART 3
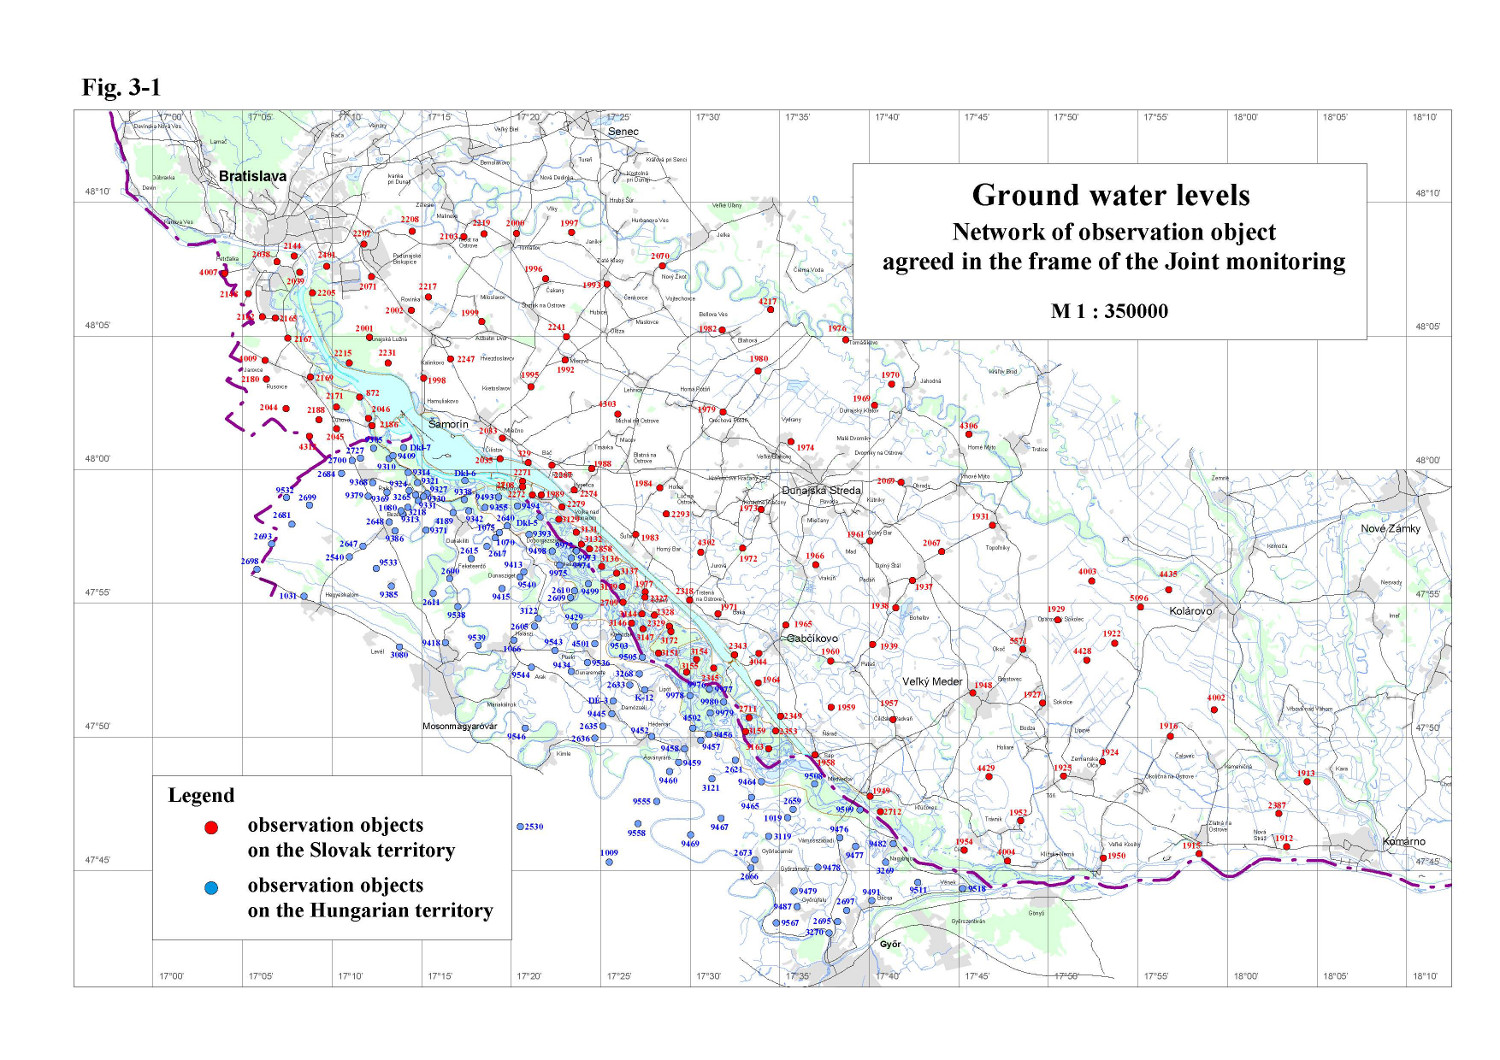
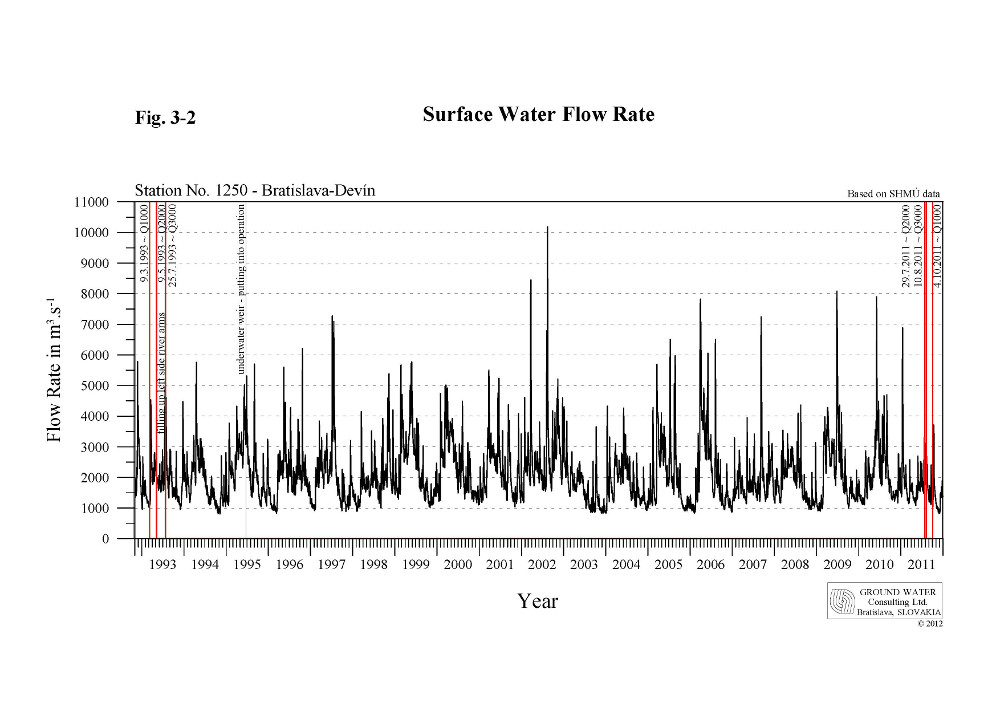
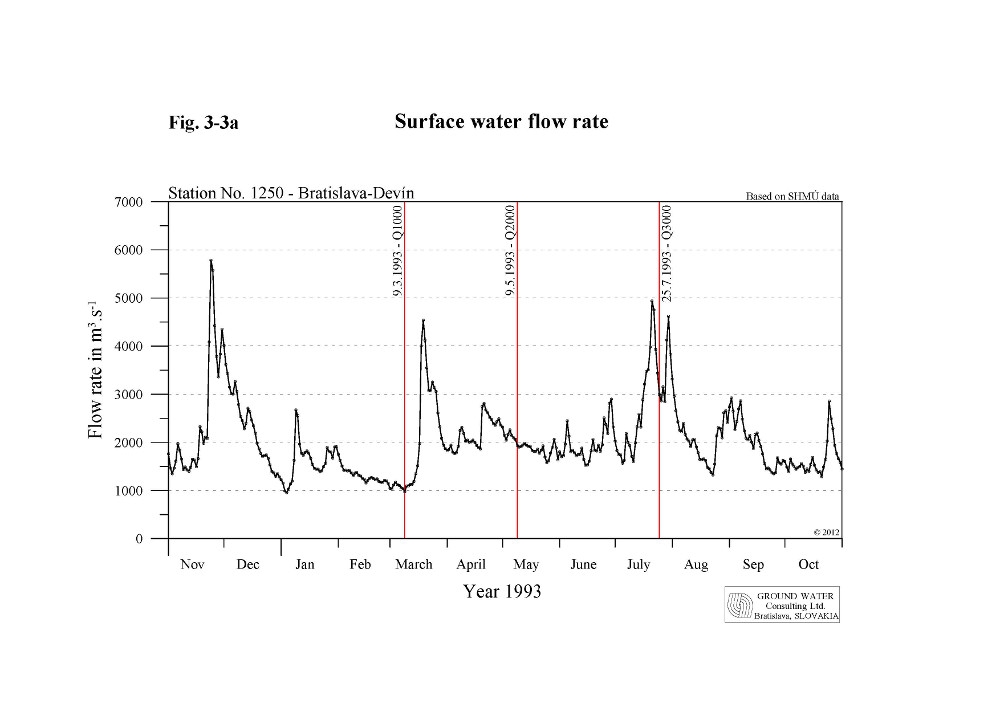
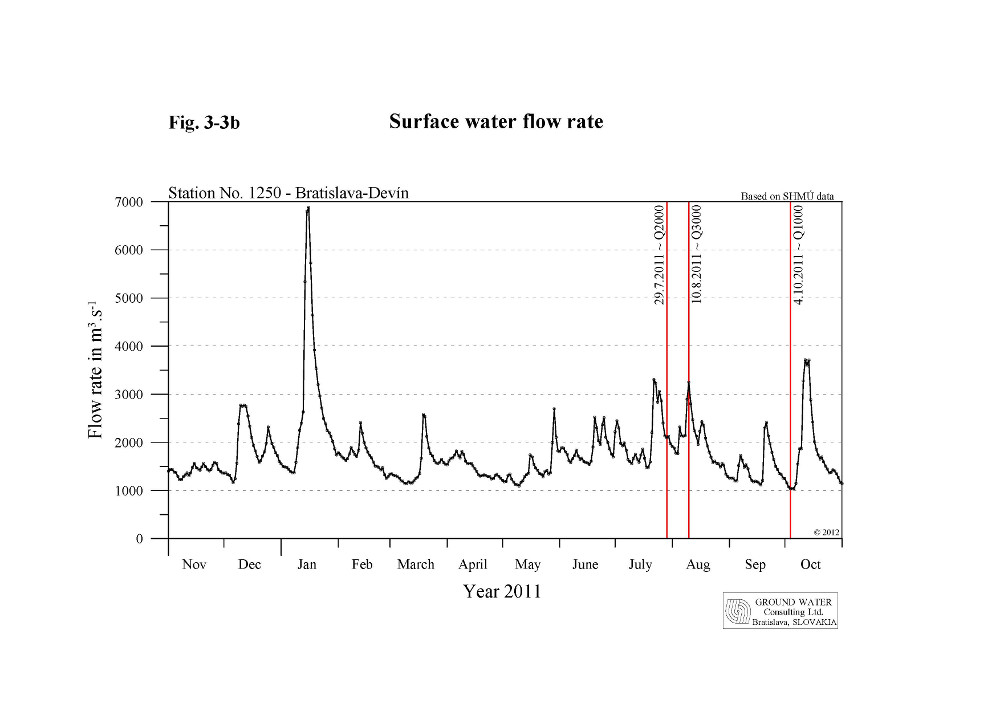
Ground Water RegimeThe monitoring of groundwater levels continued also in hydrologic year 2011. Based on observed data the impacts of technical measures and discharges into the Danube and the Mosoni branch of the Danube, and impact of water supply on the groundwater regime can be evaluated. Groundwater levels were monitored by 262 observation wells on the Slovak and the Hungarian territories (136+126), however, similarly to the previous year, part of the Hungarian objects (23) were not observed for longer period due to limited funding. Monitoring objects are situated in the area of Žitný ostrov and in the Szigetköz region. List of observation wells is given in respective National Annual Reports on environmental monitoring. The situation of the observation networks on both sides is shown in Fig. 3-1. The evaluation of groundwater level data in 2011 in a local scale was done by the Parties themselves and is given in their National Annual Reports. The jointly elaborated regional evaluation given in this report was prepared according to the jointly constructed groundwater level equipotential lines. The equipotential lines were constructed for comparison of groundwater levels in the influenced area in the current year and groundwater levels before construction of submerged weir and introducing the water supply into the river branches on Hungarian side. 3.1. Joint evaluation of groundwater regimeThe groundwater levels in observed area are primarily influenced by surface water levels in the Danube and reservoir. The hydrologic regime of the Danube was not typical in hydrologic year 2011. Flow rates in the winter period mostly fluctuated around the long-term average daily values, in mid of January a flood wave occurred. Since February the flow rates fluctuated mostly below the long-term daily average values. This fact strongly influence the overall groundwater regime. During the year several discharge waves occurred, when the flow rates exceeded the long-term daily average values. From the groundwater level fluctuation point of view, the most significant were the discharge wave in March, July, August and October. However, none of them had greater influence on groundwater level. The groundwater levels from November 2010 to mid of January 2011 slightly decreased, but fluctuated on a rather high level thanks to rich precipitations at the end of the previous hydrological year. The greatest influence on groundwater levels had the flood wave in January. In observation objects close to the Danube the maximal groundwater levels were registered. However, because of the short duration of the flood wave the maximal groundwater levels in more distant observation objects in the inland area occurred another time. Mostly at the beginning of the hydrologic year 2011 (November 2010) and in August and September under the influence of summer discharge waves on the Danube. The other discharge waves during the year had only limited or no influence on groundwater level fluctuation. The highest influence of the flood wave was expressed in the area of the confluence of Danube old river bed and the tail-race canal, where the groundwater level raised up to 5.5 meters. In other sections along the Danube the groundwater level raise varied from 0.5 to cca 3.0 m. Another significant influence on groundwater level was observed in the inundation area due to the artificial water supply. With respect to the position of the observation object the minimal groundwater levels occurred during March or at the end of the hydrologic year 2011. The groundwater regime at distant observation wells reflected to a great extent other conditions (e.g. climatic conditions, surface or groundwater levels on boundaries, etc.). Regarding the overall groundwater level fluctuation similar values were reached as in the previous year. In the upper part of the observed territory and in the inland area the groundwater level fluctuation ranged from 0.3 to 1.0 m, in the vicinity of the reservoir maximally up to 0.8 m. In the lower part of inundation area the fluctuation reached 3-5.0 m. At the end of hydrologic year the position of groundwater levels mostly reached lower levels as at its beginning. Similarly to previous years three hydrologic situations were chosen in the period before and after introducing the water supply for computing the groundwater level differences. The selected hydrologic situations characterise the low, average and high flow rate conditions in the Danube, corresponding to flow rates approximately 1000, 2000 and 3000 m3s-1. The selected dates and the corresponding flow rates in the Danube at Bratislava-Devín gauging station are the following (Table 3-1, Fig. 3-2, Fig. 3-3a, Fig. 3-3b): Table 3-1: The selected dates and the corresponding flow rates in the Danube at Bratislava-Devín gauging station
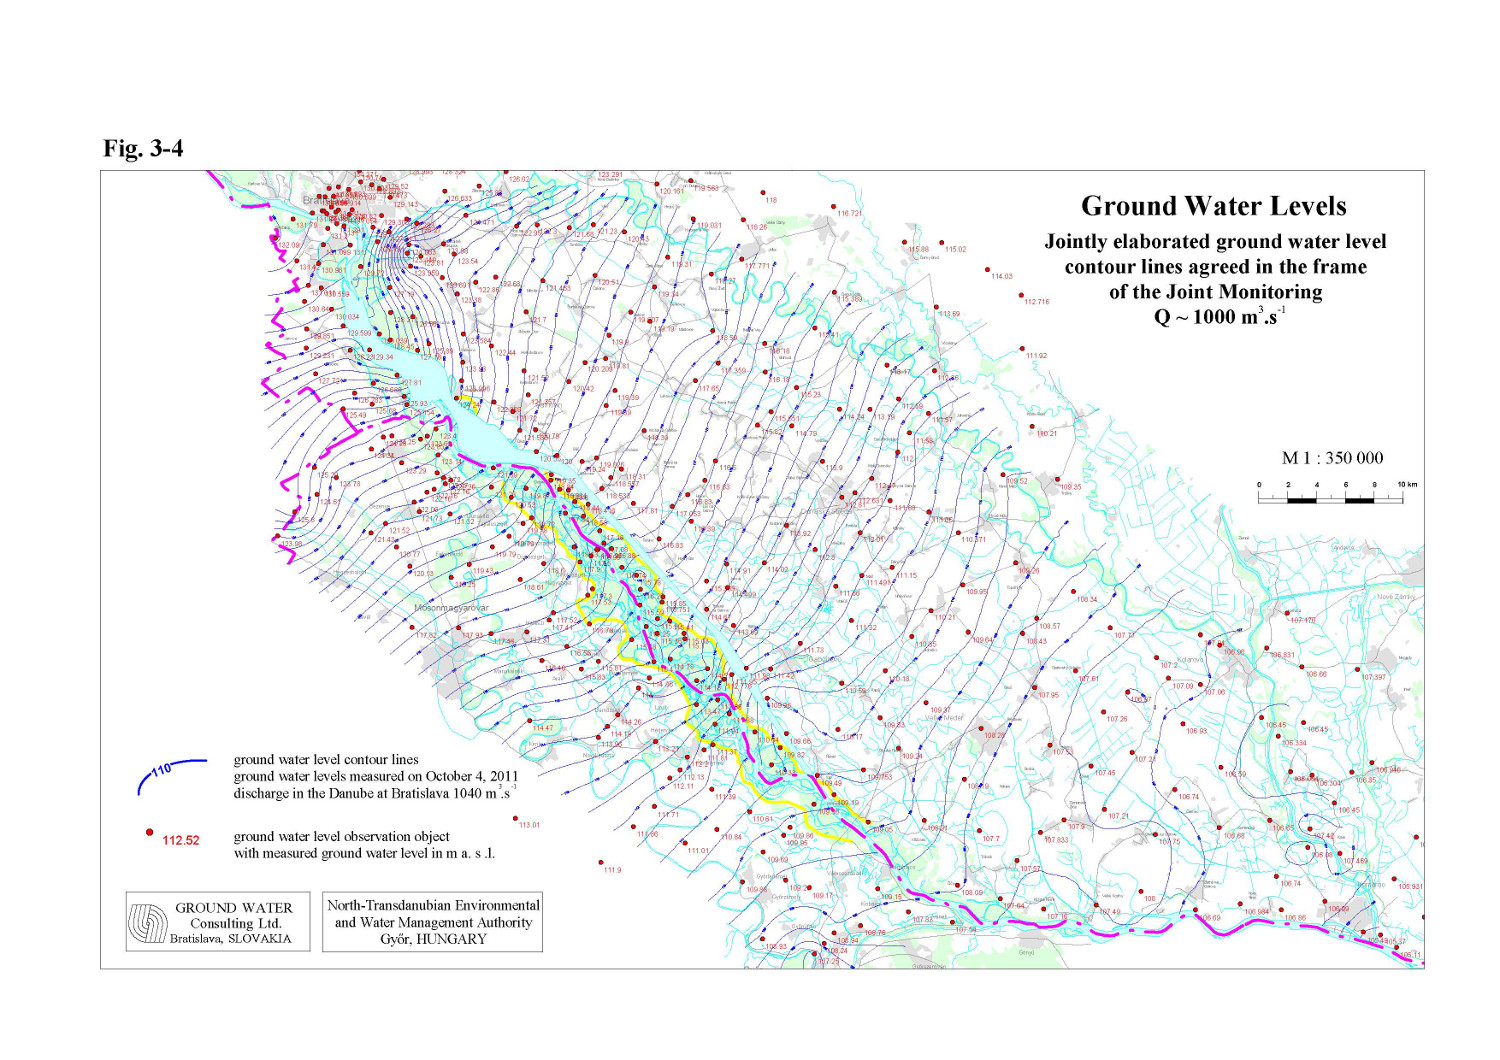
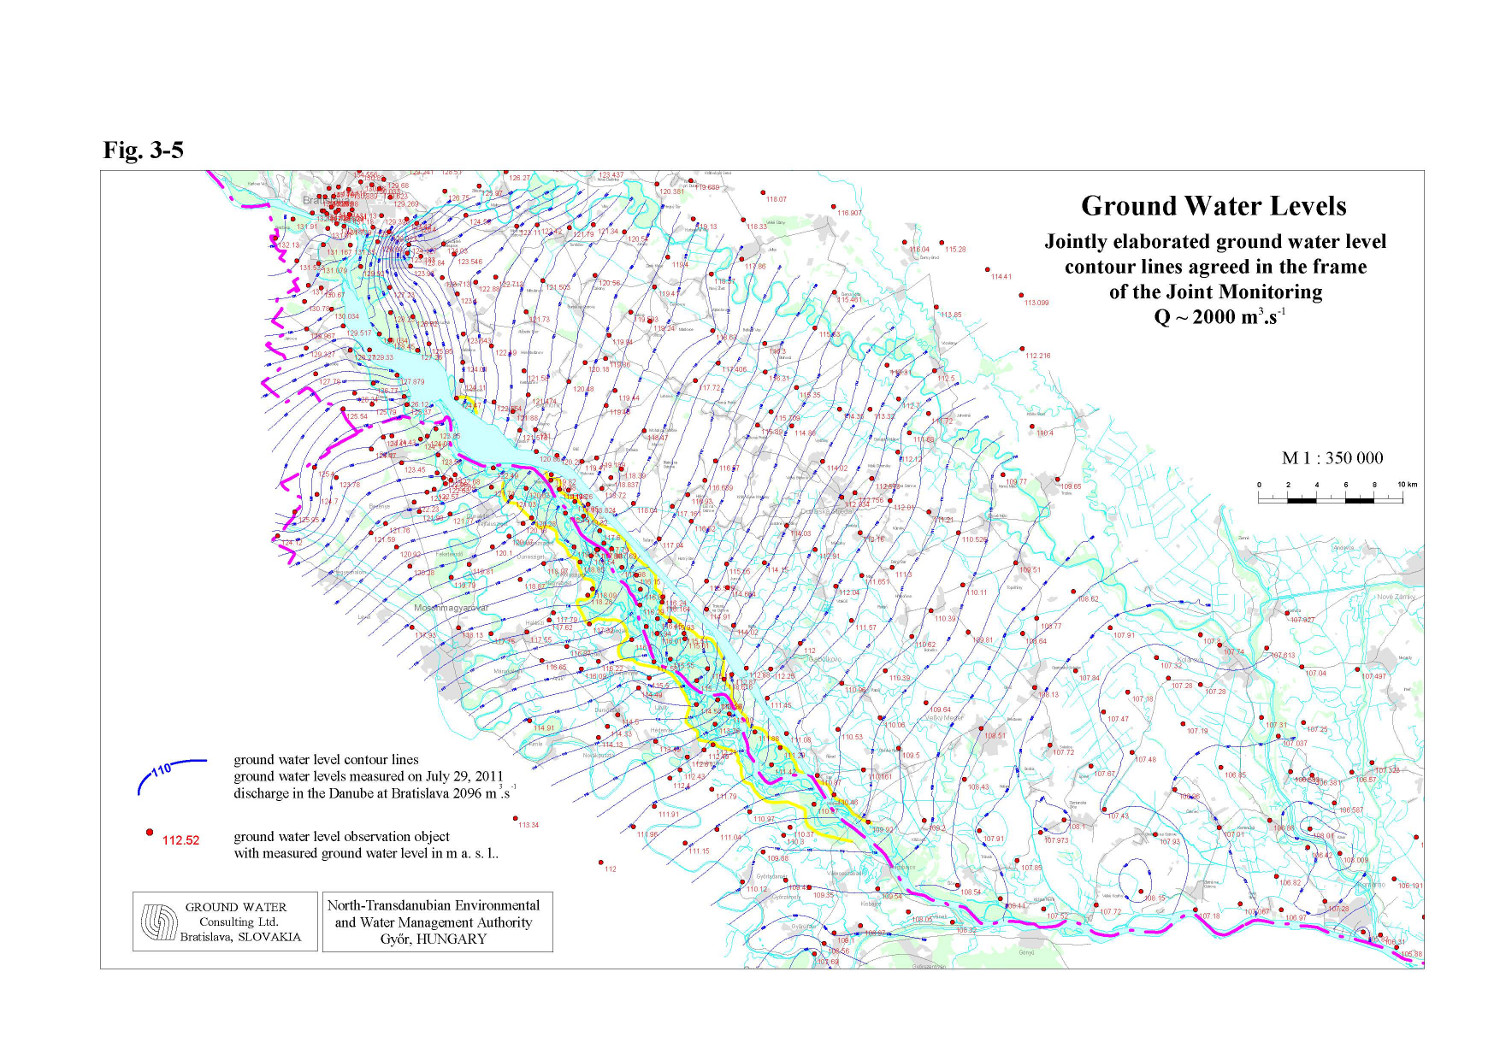
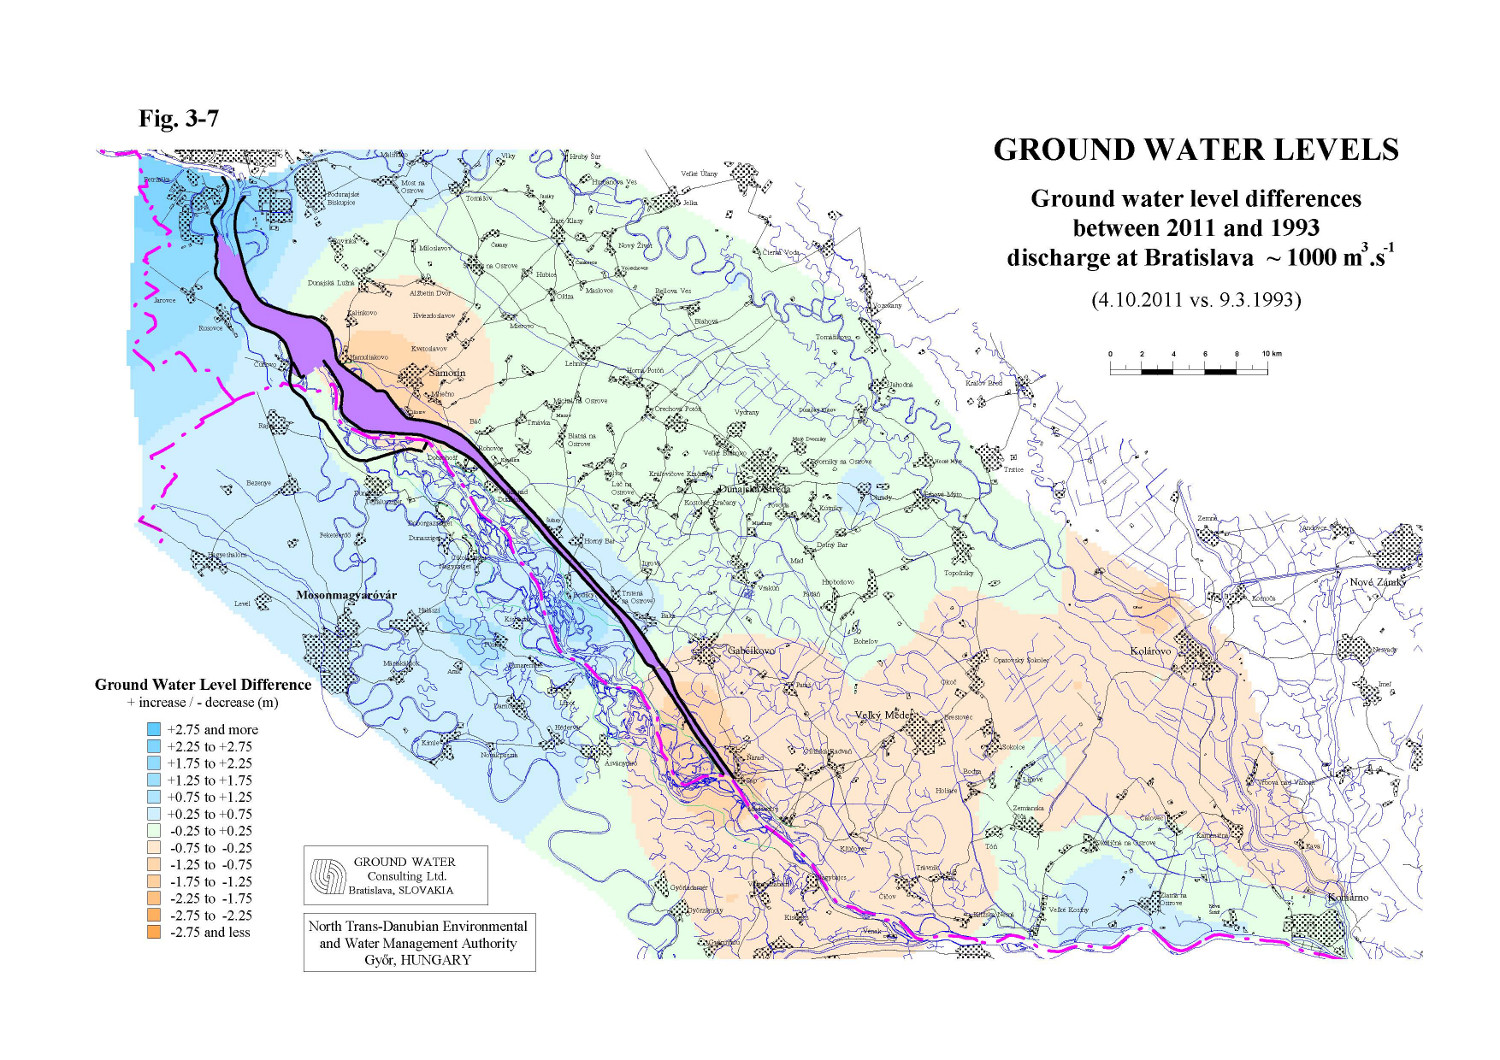
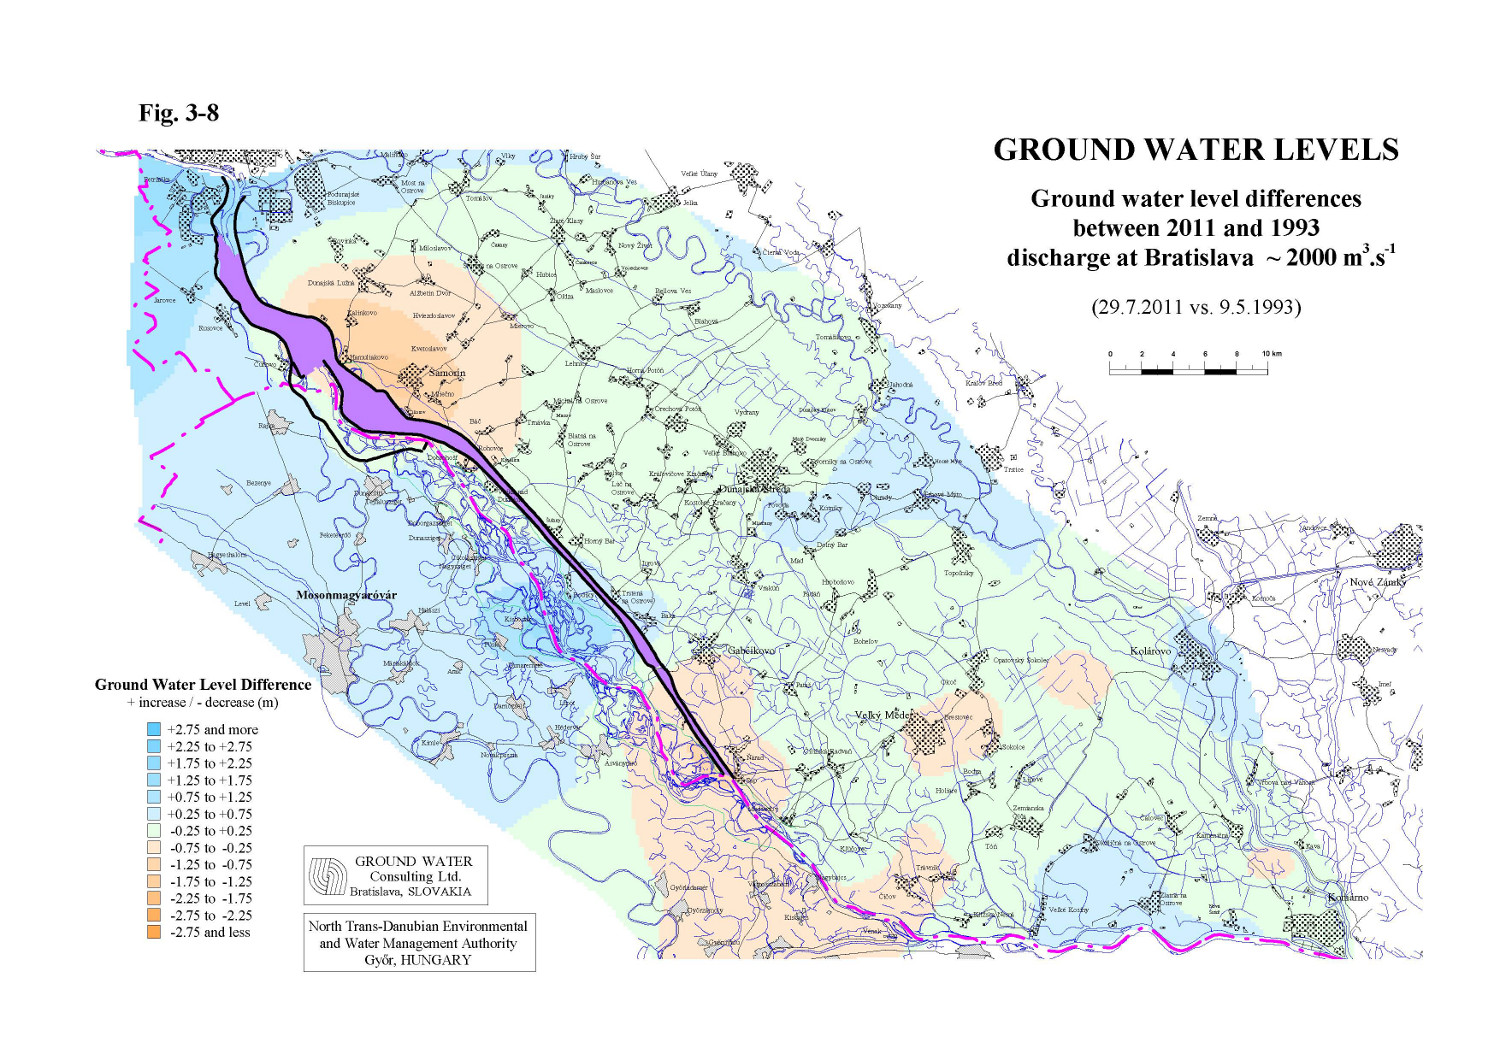
Low flow rate period was chosen in autumn because the flow rates in the winter period did not decrease below 1140 m3.s-1. The flow rate at the beginning of October 2011 dropped down to 1040 m3.s-1. Although the air temperature was higher, the overall climatic conditions can be regarded as comparable. Unfortunately, due to the atypical flow rate regime on the Danube, no satisfactorily comparable hydrologic conditions for the average and high flow rate periods were found. Partially comparable hydrologic conditions for the average flow rate period was chosen in mid summer, however the climatic conditions differed. In case of high flow rate the chosen period can not be regarded as comparable at all, due to the Danube flow rate regime in 2011. Thus, only the equipotential lines were constructed in this case and no groundwater level differences were calculated.. Moreover, in case of all three hydrologic situations 23 observation wells were missing on the Hungarian side. This means that for low, average and high flow rate conditions certain part of the whole set of observation objects on the Hungarian side were not used for equipotential lines computing. Maps of equipotential lines were jointly constructed for the selected dates using the measured groundwater levels (Fig. 3-4, Fig. 3-5 and Fig. 3-6). In wells where the water level is measured once a week, the groundwater level for the selected dates was computed by linear interpolation. In all other wells the daily average values were used. The altitudes of groundwater levels are given on maps for each observation object used for the equipotential line construction. For constructing equipotential lines computed surface water level data in the Danube was used as well. This level was computed by calibrated model, using river morphology data and measured water levels data on a given stretch. The other surface water levels were not used for constructing the equipotential lines. The constructed equipotential lines represent general groundwater levels and flow direction, and do not show the local influences of channels or river branch systems. Differences between groundwater levels for selected hydrologic situations in years 1993 and 2011 are expressed in Fig. 3-7 and Fig. 3-8. The evaluation is mainly focused on the area influenced by technical measures and discharges according to the intergovernmental Agreement and by the water supply realised on Hungarian side. In this sense the inundation and the flood-protected area on the Hungarian side, and partly the inundation area on the Slovak side, represent the influenced area. Low flow rate conditions Comparing the hydrologic situation at low flow rate (approximately 1000 m3.s-1) in the period before implementing technical measures and releasing discharges according to the Agreement and the low flow rate period in the year 2011 (2011 versus 1993), it can be stated that no change or slight increase can be seen in the upper part of the Szigetköz area (Fig. 3-7). The groundwater level increase in the upper part of the Szigetköz area between Rajka and Dunasziget is reduced by groundwater level decrease in the area around the reservoir caused by decrease of permeability of the reservoir bottom between the compared periods. The adverse change in sediment transport detected in 2009 and 2010, which is probably related to measures in the riverbed taken on the Austrian stretch of the Danube just upstream of Bratislava, have been partially mitigated to the end of the year 2011 by measures taken in the reservoir (removal of sediments). In the middle part of the Szigetköz area between Dunasziget and Dunaremete, higher groundwater levels were created at low flow rate conditions as a response to continuous water supply of river branch system and inland channels. An increase in the groundwater level also occurred along the Mosoni Danube. In the lower part of the Szigetköz, downstream from Ásványráró and around the Bagoméri river branch system the groundwater levels were slightly lower than in 1993, because of not completed water supply system. Lower groundwater levels were recorded also on the left side of the reservoir, in the upper part of the Žitný ostrov, due to the difference in the permeability of the reservoir bottom. However, the decrease became lower thanks to the measures taken in the reservoir in 2011. The groundwater levels at present are much higher than before constructing the dam. Significant decrease in groundwater levels occurred along the tailrace channel and downstream the confluence of the tailrace channel and the Danube old riverbed. The riverbed erosion influences this region. On a large part of the Slovak side there were no changes in groundwater levels observed. Slight decrease in lower part of the Žitný ostrov area reflects the different water level in the channel system maintained in autumn. In general the increase of average groundwater levels mostly vary between +0.2 and +0.7 m in comparison to groundwater levels in 1993. This occurs mainly in the upper and middle part of the Szigetköz area. There is an increase of groundwater levels in the inundation area on the Slovak side as well, which is evoked by the water supply on the Slovak side, however this is independent on measures according to the Agreement. The groundwater levels on a great part of the Žitný ostrov area (upper and middle part) remained unchanged. The decrease of groundwater level around the confluence of the Danube old riverbed and the tail-race canal vary from -0.25 to -1.2 m. The groundwater flow direction in the upper part of the river up to Dunakiliti shows infiltration from the river and the reservoir into the surrounding area. Along the Danube old riverbed from Dunakiliti up to the confluence with the tail-race canal the groundwater flows into the riverbed and the river is draining the adjacent area, but the groundwater in the inland area is flowing parallelly with the Danube. Average flow rate conditions Comparing the groundwater levels in the period before realising technical measures, after increasing the discharges into the Danube according to the Agreement and introducing the water supply on the Hungarian side, at average flow rate conditions in the Danube (approximately 2000 m3.s-1), the actual results are similar as at low water conditions. A significant increase in the groundwater levels occurred in mainly in the middle part of the Szigetköz area and along the Mosoni Danube. The groundwater level increase in the upper part of the Szigetköz area is slightly reduced by the groundwater level decrease in the area around the reservoir caused by decrease of permeability of the reservoir bottom. The average groundwater level changes vary between +0.2 and +0.7 m (Fig. 3-8). The groundwater level increase in the middle part of the Szigetköz area (including inundation) reaches 0.7-1.5 m. Compared to 1993, the groundwater levels along the Danube in the lower part of the Szigetköz (at the mouth of Bagoméri river branch system) were lower. The decrease of groundwater levels is due to not completed water supply system and due to riverbed erosion in this Danube stretch. On the Slovak territory no impact from the technical measures according to the Agreement appears. Higher groundwater levels in the left side inundation area reflect the different water supply regime in the river branch system in 1993 and 2011. Decrease in the groundwater levels can be observed around the left side of the reservoir. This results from a lower water level in the reservoir than in 1993 and a decrease in the permeability of the reservoir bottom as well, but in general the groundwater levels are higher than before damming the Danube. On a large part of the Slovak side there were no change in groundwater levels observed. The groundwater flow direction in the upper part of the river up to Dunakiliti shows infiltration from the river and the reservoir into the surrounding area. Along the Danube from Dunakiliti up to the Gabčíkovo the groundwater flows into the riverbed and the river is draining the adjacent area, but the groundwater outside the inundation is flowing into the inland area. In the lower part of Žitný ostrov area the Danube and Váh rivers supplied the adjacent area. High flow rate conditions No groundwater level differences for high flow rate conditions in the Danube (approximately 3000 m3.s-1) were calculated because of the lack of comparable hydrologic situation in 2011. Generally, decrease of groundwater levels occur along the Danube old riverbed including the inundation area on both sides. On a great part of the flood-protected area in Szigetköz no change or an increase of groundwater levels can be supposed, due to the continuous water supply into the Mosoni Danube and the inland channel system. Another decrease in the groundwater levels can be expected on the left side of the reservoir, caused by the decrease in the permeability of the reservoir bottom. The groundwater flow directions along the Danube, except the upper and middle part of the inundation, show water supply from the Danube into the adjacent area (Fig. 3-6). The groundwater flow direction in the inland area also documents the water supply from the Danube. 3.2. ConclusionsBased on the evaluation of groundwater regime it can be stated that the water supply into the right side river branch system plays an important role in influencing groundwater levels over the Szigetköz region. As a result of measures realised according to the intergovernmental Agreement, a significant increase in the groundwater levels occurred for low and particularly for average flow rate conditions in the Danube. The increase is reduced in the upper part of the Szigetköz region and around the reservoir due to the decrease of permeability of the reservoir bottom. Certain influence have also had the adverse changes in sediment transport regime in the Danube, that are probably related to measures realized on the Austrian stretch of the Danube just upstream of Bratislava in last years. A decrease in the groundwater levels along the Danube riverbed can be registered for high flow rate conditions, however in certain distance from the Danube old riverbed no change was observed in inundation area and increase of groundwater levels in the inland area of Szigetköz. The monitoring results still proves the necessity to solve the water supply in the lower part of the inundation area on both sides. The groundwater level increase in the lower part of Ásványi river branch system and in the Bagoméri river branch systems and on the Istragov island on Slovak side could be solved by measures applied in the Danube old riverbed upstream of confluence with the tail race channel. Such measures can improve the overall situation in this region. An increase of groundwater levels in the strip along Danube old riverbed on both sides could be ensured only by increase of water level in the Danube by some measures realised in the riverbed.
|
|||||||||||||||||||||||||