PART 2
Surface Water Quality
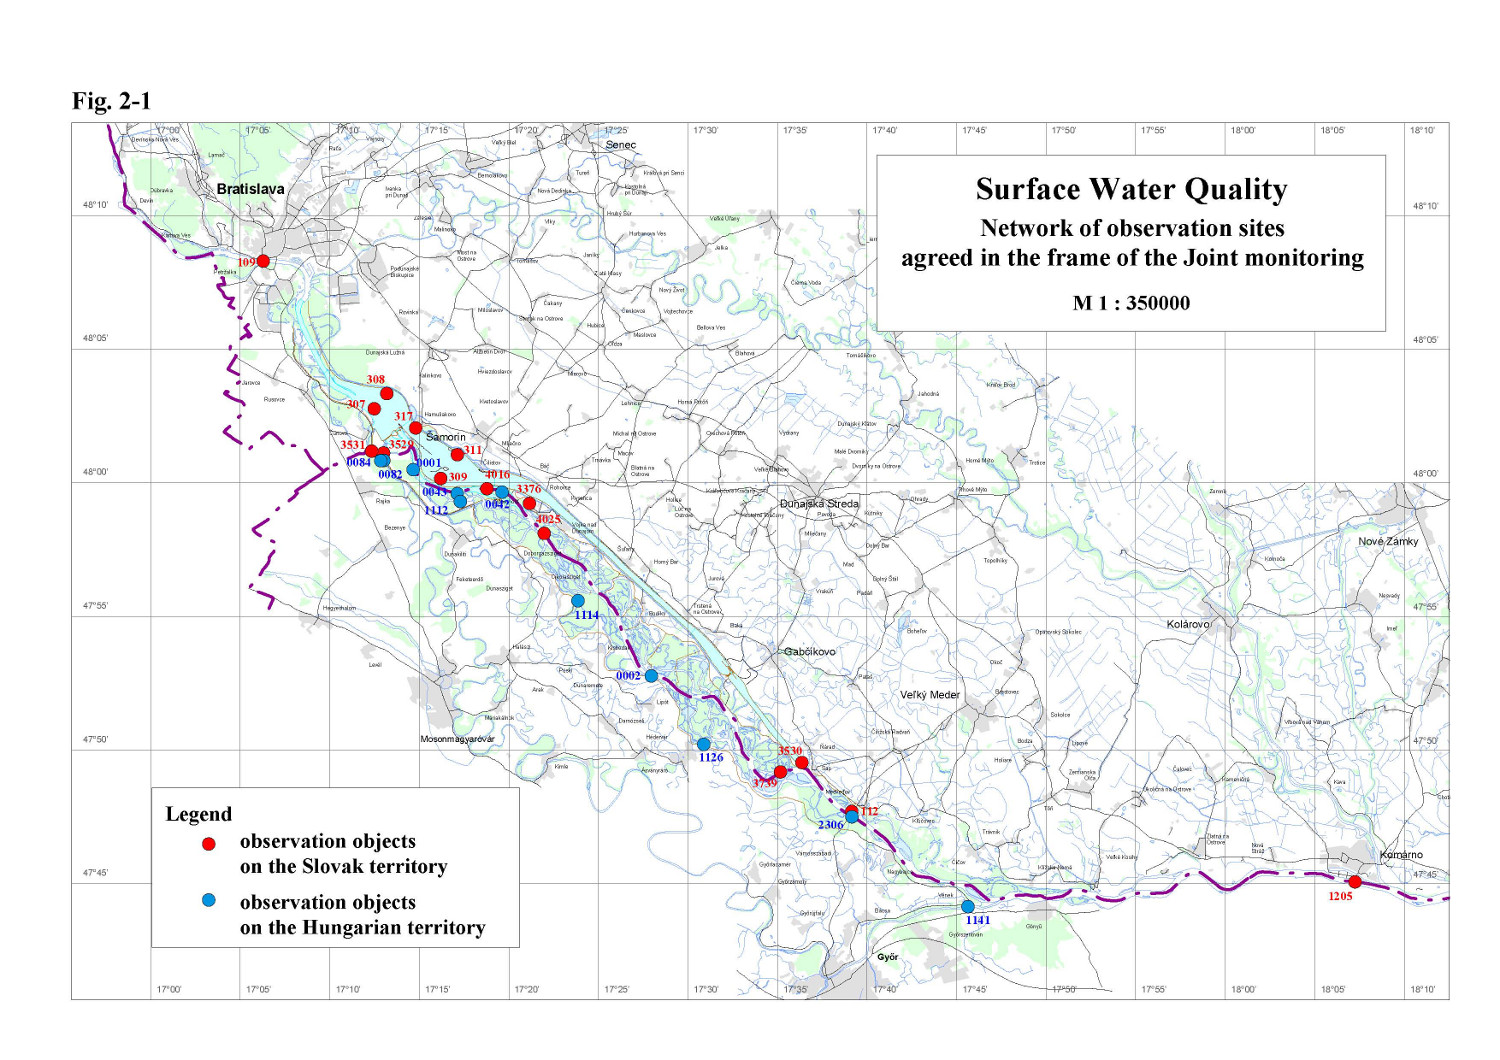
The surface water quality in the year 2011 was monitored at 15 sampling sites on
the Slovak territory and at 11 sampling sites on the Hungarian territory. The
list of sampling sites is given in Table 2-1, and their location is
presented in Fig. 2-1.
At all monitoring sites the influence of measures, described in the Agreement, on surface water quality was observed. The main factors that could influence the water quality, are: the backwater effect upstream of the submerged weir, increased discharges into the Danube downstream of Čunovo dam and into the Mosoni branch of the Danube, the water supply into the right side river arm system, and morphological changes in the riverbed. Table 2-1: List of monitoring sites
* - jointly observed monitoring sites Surface water quality and sediment quality data for the agreed monitoring sites, and time series diagrams of individual surface water quality parameters, are given in the Slovak and Hungarian National Reports on the Environment Monitoring in 2011 or in their Annexes. Figures in the Joint Report represent the data of selected parameters at selected monitoring sites. At jointly monitored sampling sites national data were taken into account. Table 2-2: Agreed limits for surface water quality classification
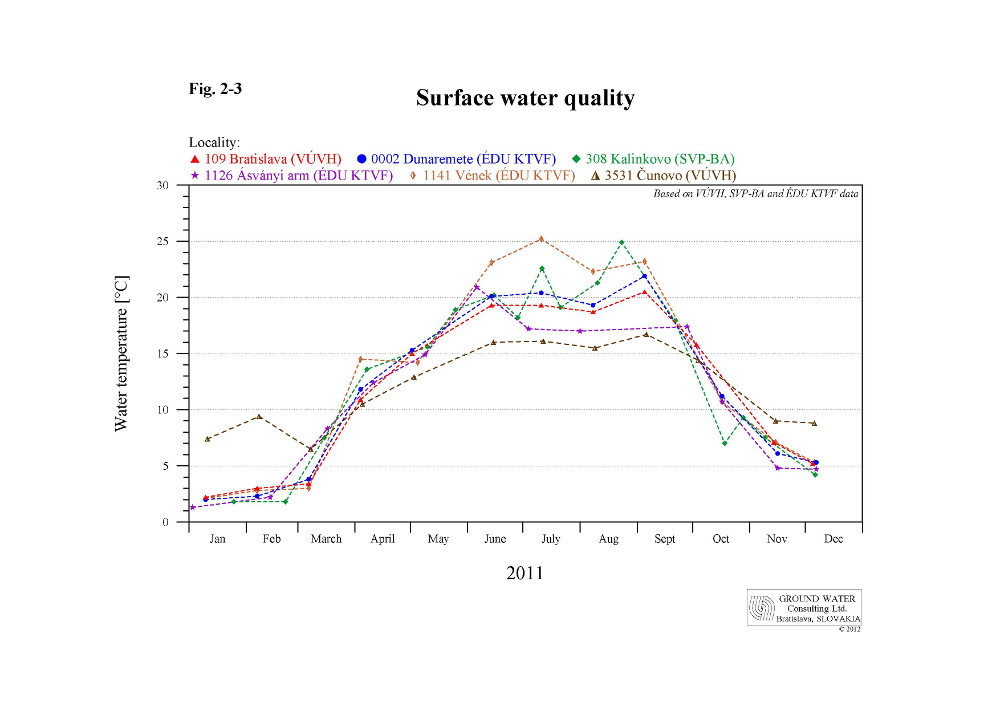
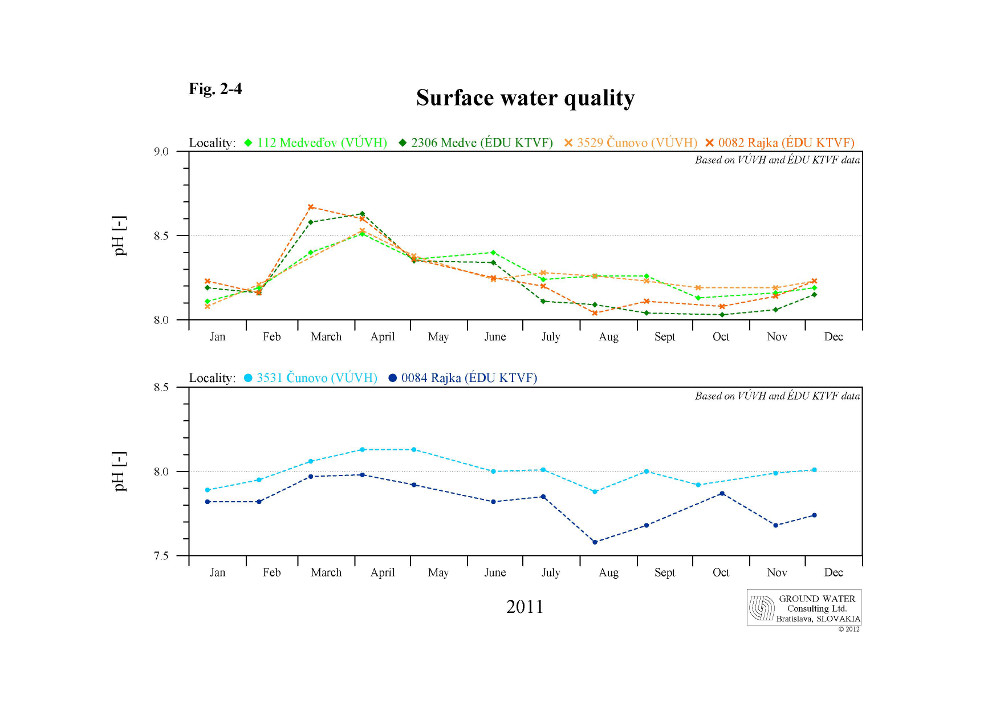
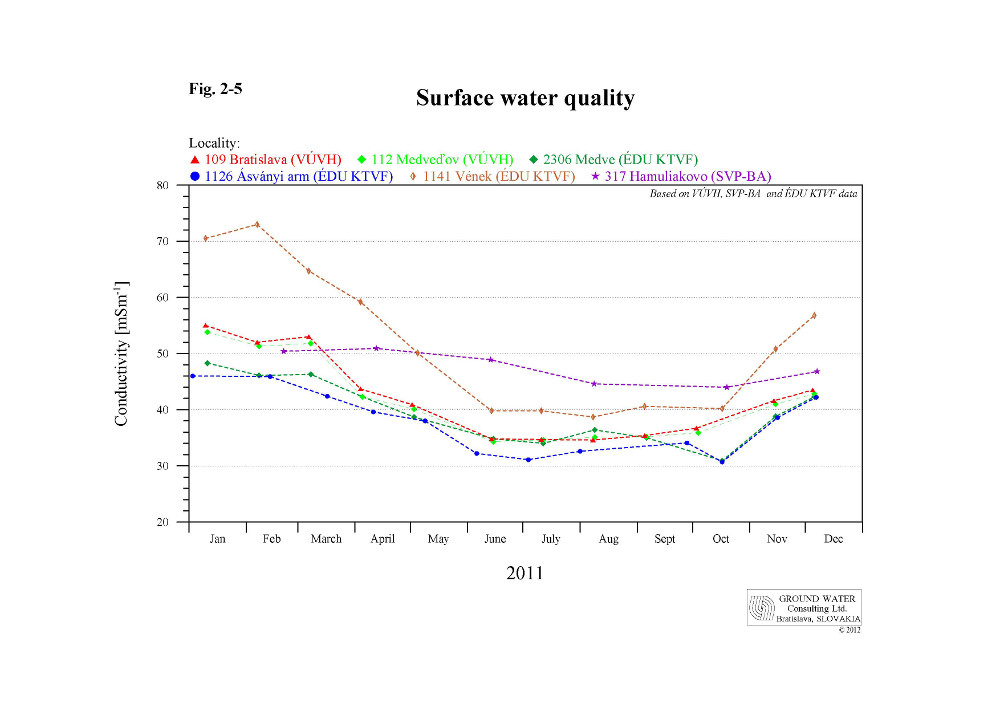
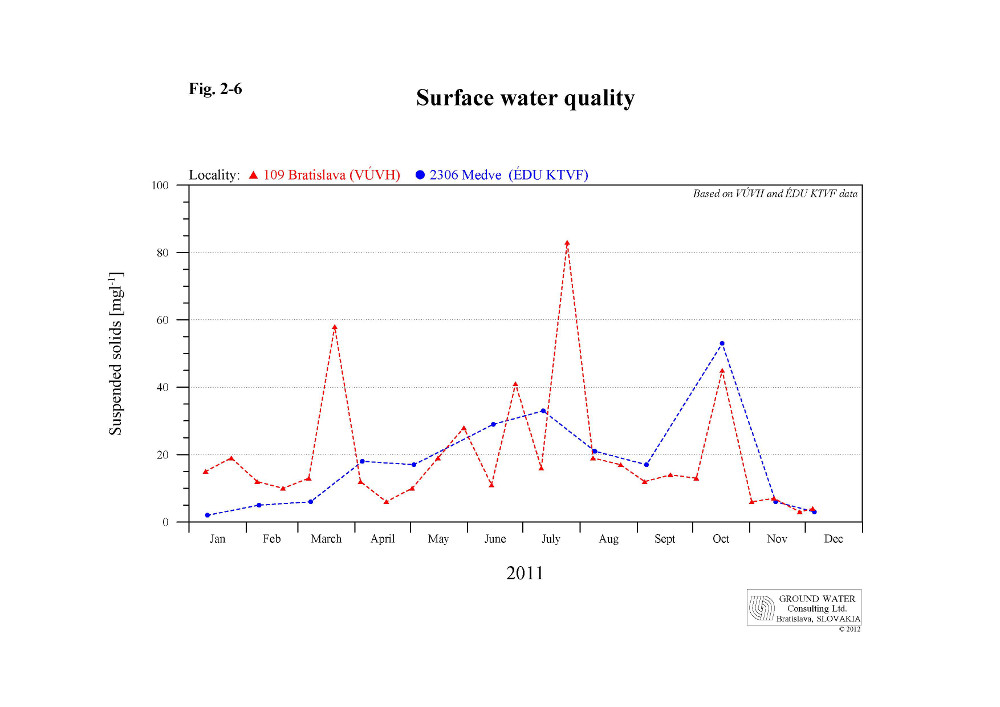
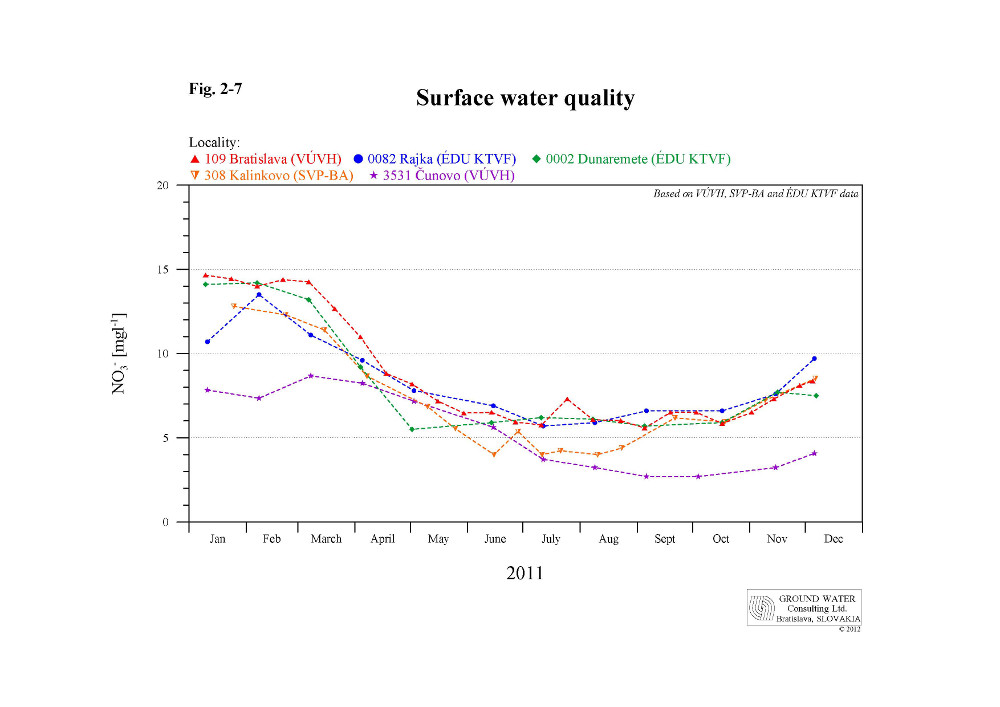
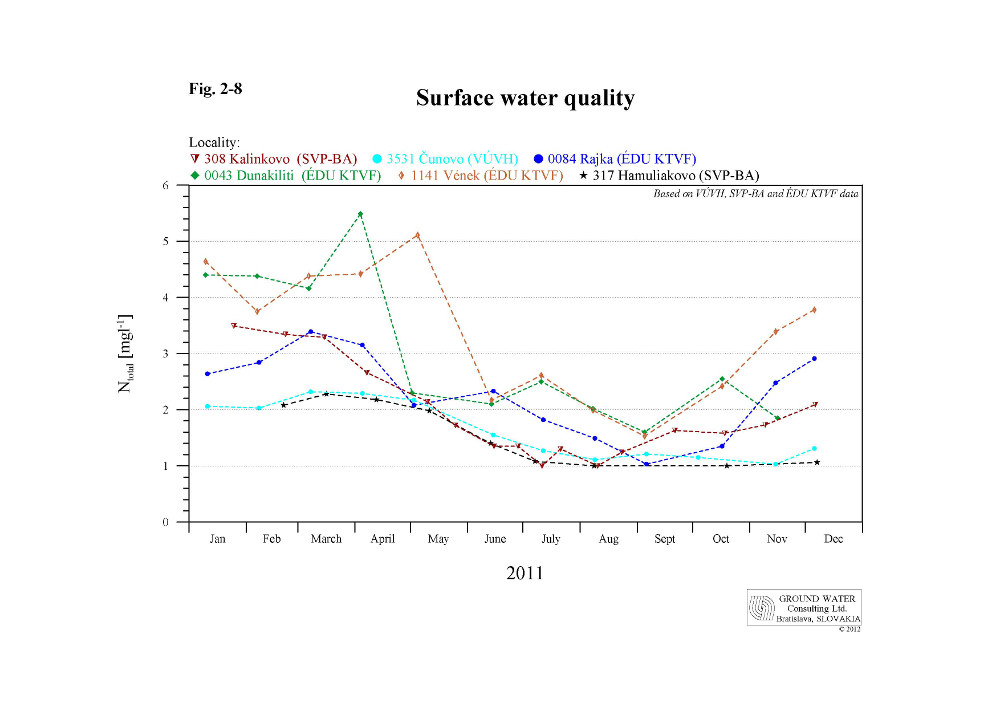
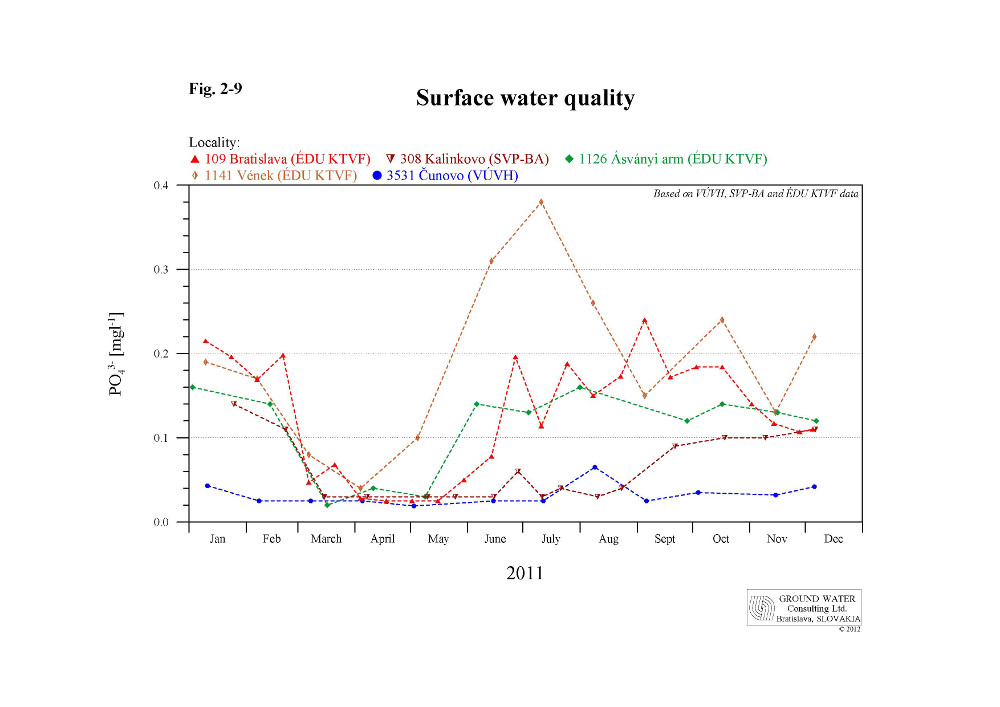
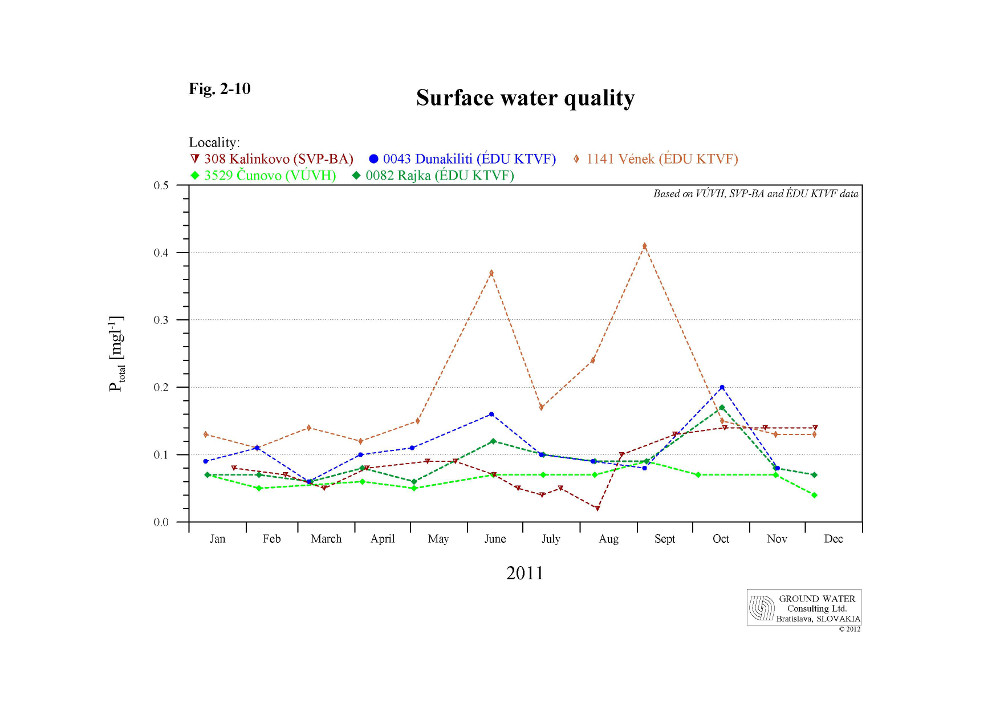
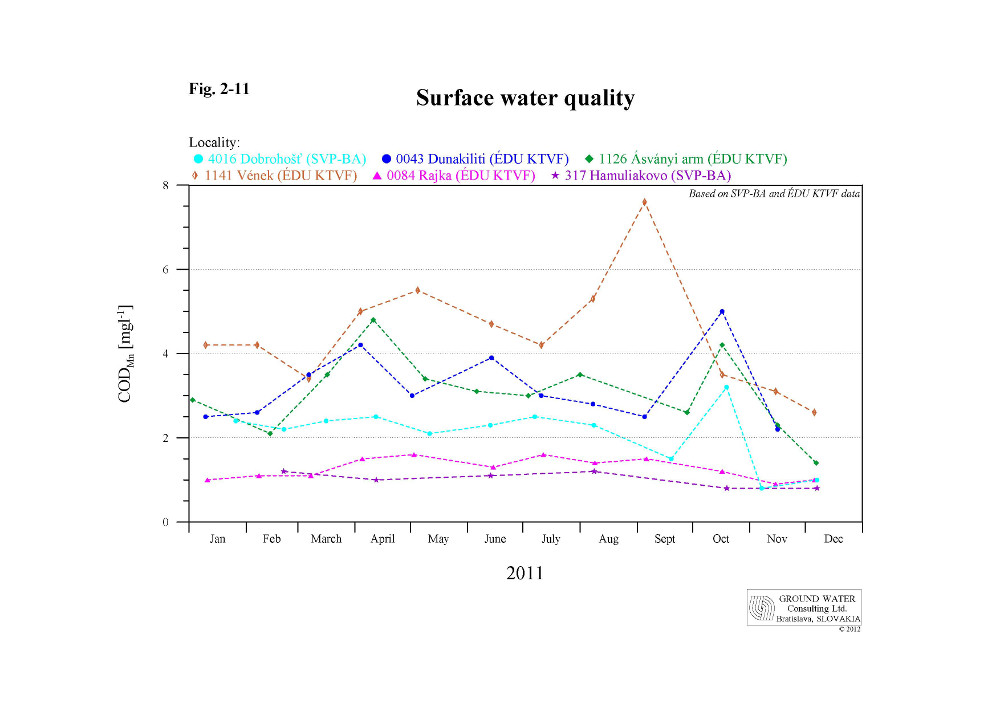
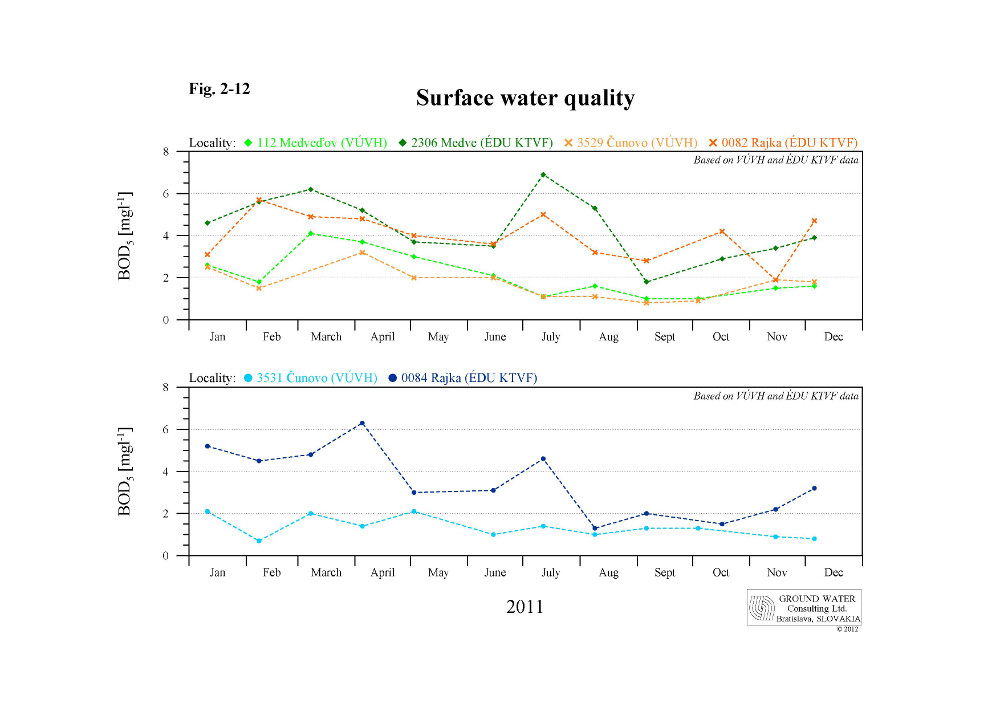
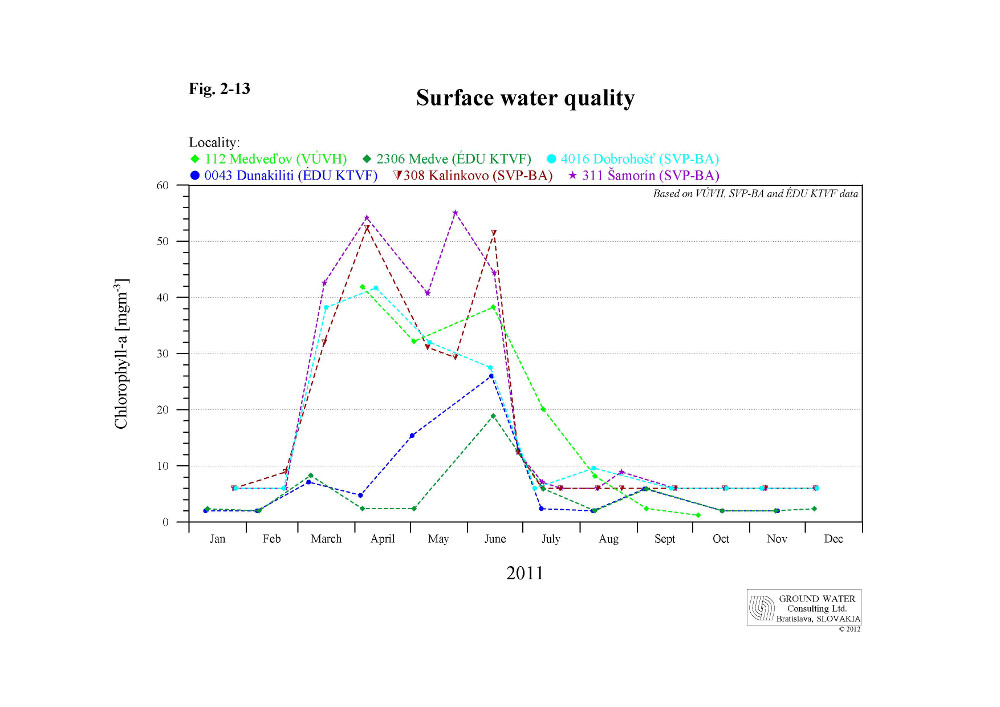
At the end of this chapter surface water quality monitoring results at selected sampling sites were evaluated according to the agreed limits given in Table 2-2. These limits have been transposed from the “Surface water quality observation directive for Slovak-Hungarian boundary waters and for extended water quality monitoring on the Danube”, approved by the Slovak-Hungarian Trans-boundary Water Commission at its LXV. meeting. At the meeting of Monitoring Agents (April 2007 in Győr) it was agreed that the joint evaluation of exchanged data will cover one calendar year, and that the monitoring of hydro-biological quality elements will be carried out in accordance with the methodology agreed in the frame of Transboundary Water Commission. The Hungarian Party in its National Annual Report for the year 2011 carried out the evaluation in two ways. On the one hand it considered the system of limit values with five classes (Table 2-2). On the other hand it assessed the ecological status of surface waters under the Water Framework Directive according to the national methodologies and quality schemes, which are briefly described in the Hungarian National Annual Report for the year 2011. 2.1. General evaluation of the actual yearThe year 2011 from the water bearing point of view belonged to dry years. Extremely dry months were April, May and June. The average daily flow rates in particular months often ranged between 1000 and 2000 m3.s-1. Big flood wave occurred atypically in the winter period, with culmination on January 16, when the flow rate at Devín achieved 7214 m3.s-1. Since February to mid of July the flow rates mostly ranged below long-term average daily values without occurrence of more significant discharge wave, typical for this period. Later, under the influence of heavier precipitations, flow rates exceeding 3000 m3.s-1 occurred (in July, Augusta and October), but prevailing part of daily flow rates again ranged below long-term average daily values. The end of the year was poor on rainfall and after passing the discharge wave in October the flow rates gradually declined to the lowest values, below 1000 m3.s-1 (in the second half of November and in December 2011). The air temperature ranged above the long-term average daily temperatures in the prevailing part of the year. In March, there was a sharp warming, with temperatures above the long-term averages, which lasted till the mid of July, with minor breaks (at the turn of April and May and late of June). Longer period with temperatures below the long-term averages occurred only in the summer due to precipitations and lasted from mid of July to mid of August. Then the temperatures raised again above the long-term average daily temperatures and decreased at the end of September. Then, until the end of the year they fluctuated around the average daily values. The above hydrologic and climatic conditions influenced the surface water quality in the evaluated year. 2.2. Basic physical and chemical parametersWater temperature The course of measured water temperature values shows a seasonal character and the fluctuation of their values is similar at most of sampling sites. The highest water temperature is measured in the summer period. In the year 2011 the maximal temperatures at particular sampling sites were lower in comparison with the previous year. Exceptions were the seepage canals, where slightly higher maximal temperatures were recorded. The occurrence of maximal temperature values at particular sampling sites was connected with climatic and hydrologic conditions of the actual year. Due to higher flow rates and cooling in the period from mid of July to mid of August the maximal values occurred either at the beginning of June, at the end of August or at the beginning of September. Examples are shown in Fig. 2-3. Maximal value in July occurred only at one sampling site - Mosoni Danube at Vének (No. 1141). This temperature (25.2 °C) represented the highest water temperature recorded in the year 2011. The lowest values were recorded in January at all sampling sites. The water temperature in the Danube fluctuated from 2.0 to 21.9 °C. The spread of values in the reservoir was greater - from 1.8 to 24.9 °C. The highest temperature in the reservoir (24.9 °C) was measured at sampling site No. 308, similarly as in the previous year. The water temperature in the Mosoni Danube reached higher values at sampling site No. 1141 at Vének (2.1-25.2 °C) than at sampling site No. 3529/0082 at Čunovo/Rajka (2.0-19.9 °C). The water temperature values in the river branch system were similar to that in the Danube (1.2-21.4 °C). The most balanced temperature was characteristic for the water in seepage canals, where it fluctuated from 6.1 to 17.7 °C. In the evaluated year higher water temperatures (above 15 °C) occurred at particular sampling sites from May to September, at sampling sites in the Danube at Bratislava (No. 109), Medveďov (No. 112) and in the Mosoni Danube at Čunovo/Rajka (No. 3529/0082) also in early October. The water temperature in comparison with the previous year reached not only lower maxima, but also higher minima. pH In the year 2011 the pH reached higher values than in the previous year. The measured values varied in the range from 7.40 to 8.80, in contrast to the year 2010, when they fluctuated from 6.71 to 8.53. At sampling sites in the reservoir and in the left-side river branch system the pH values fluctuated in a wider range of values than in the previous year, the fluctuation at other sampling site was lower. Higher pH values occur in seasons corresponding to periods of increased assimilation activity of phytoplankton. Mass development of phytoplankton was registered from March to June and at most of sampling site the maximal pH values occurred in these months. The highest values were measured in the reservoir and in the river branch system, where the pH fluctuated from 7.70 to 8.80. The highest pH (8.80) was recorded in the sample taken at sampling site No. 308 in the reservoir, where the highest abundance of phytoplankton and the most extensive development of macrophytes was documented. In connection with the rapid decline of phytoplankton in June and early July, also the pH values significantly decreased at most of sampling sites. Subsequently, the development of pH values was balanced till end of the year, except some sites. On the right side of the reservoir at sampling site No. 309 in relation with the second wave of phytoplankton development in this section, the pH rose to 8.50 in August. Different development of pH have been documented in the Mosoni Danube at Vének (sampling site No. 1141) and in the river branch system (sampling site No. 1114 - Szigeti arm). At Vének high pH value was recorded in early April, but the maximal value occurred only in September. The spread of pH values on this sampling site was wider (7.54-8.36) than at Čunovo/Rajka (8.04-8.79). The pH in the Danube water fluctuated from 7.72 to 8.72. Slightly wider range was registered in the right-side river branch system: 7.40-8.79. The narrowest range, 7.87-8.19 is characteristic for the left side seepage canal (sampling site No. 317). Although the pH values at jointly monitored sampling sites show differences (Fig. 2-4), the tendency and the time course of measured values is similar. Specific electric conductivity The specific electric conductivity of surface water refers to the dissolved salts content of mineral origin. It has a seasonal character; values are higher in winter months, lower occurs during the summer. The lowest conductivity values occur during flood waves and are usually recorded in June. In the year 2011, however, the typical flood in June was missing, therefore at most of sampling sites the minimal values were recorded in October, in connection with stronger discharge wave on the Danube. At some sampling sites the minimal values were measured in July or August. The highest conductivity values during the year are characteristic for the sampling site No. 1141 on the Mosoni Danube at Vének. In the year 2011 values fluctuated from 38.7 to 73.0 mS.m-1 and were lower than in the year 2010 (35.6-80.6 mS.m-1). Even at the other sampling sites was the conductivity lower than in the previous year. The course of specific conductivity at sampling sites in the Danube, Mosoni Danube at Čunovo/Rajka and also in the river branch system followed the conductivity values at sampling site in Bratislava (No. 109). The conductivity fluctuated between 30.4 and 55.0 mS.m-1. In the reservoir it varied in narrower range: 33.6 – 54.7 mS.m-1. The dissolved solids content in seepage canals does not have seasonal character and is stable. The electric conductivity values, similarly to previous years, fluctuated in narrow range and the lowest spread of values (44,0-50,9 mS.m-1) was typical for water in the left side canal at Hamuliakovo (sampling site No. 317). In the evaluated year more significant differences in values measured by the Slovak and Hungarian Parties were registered at jointly monitored sites only at the beginning and at the end of the year. In the period from April to September these values were similar. The development of conductivity at selected sampling sites is presented in Fig. 2-5. Suspended solids The suspended solids content is closely related to the flow rate. It increases at flood waves and higher values are characteristic mainly for the summer period. Due to unusual hydrologic conditions in the year 2011 the content suspended solids was low. The biggest flood wave in January was not caught by sampling directly. During the year a number of smaller discharge waves occurred, maximally up to 3713 m3.s-1 (in October). Realized samplings, however, caught two or three discharge waves, when the highest values were registered. In the Danube the highest value of 83 mg.l-1 was recorded in late July at sampling site at Bratislava (No. 109). It is linked with the discharge wave, which occurred at the end of July with the culmination on July 22, 2011 (3305 m3.s-1). Sampling was conducted on July 25, 2011 at recession of the discharge wave. The highest suspended solids content in the evaluated year (98 mg.l-1) occurred in early September at sampling site No. 1141 in the Mosoni Danube at Vének. The contents in the Mosoni Danube at Čunovo/Rajka (sampling site No. 3529/0082) varied maximally up to 48 mg.l-1. In the Danube old riverbed and in the river branch system increased contents were measured during the discharge wave in October, with maximum of 78 mg.l-1 at sampling site No. 1114 in the Szigeti river arm. Contents of suspended solids in the reservoir mostly varied in a rather narrow range (from 3.4 to 25,8 mg.l-1). Higher contents also occurred during higher discharges in October (up to 38.2 mg.l-1), but the highest content of 61.7 mg.l-1 was measured in the sample taken in the navigation line in July at sampling site No. 307. Due to the origin of water low content of suspended solids is characteristic for seepage canals. In the left-side seepage canal at Hamuliakovo (sampling site No. 317) contents varied from <2 to 8.9 mg.l-1, in the right-side seepage canal values ranged from 2 to 27 mg.l-1. Contents of suspended solids in the evaluated year were lower the in the previous year, except the sampling site at Vének, at some sampling sites they reached only half of values measured in the year 2010. Unlike the other years, in 2011 the content of suspended solids measured downstream of reservoir (at sampling site No. 112 at Medveďov) in a number of cases (from April to October) was higher than in the Danube at Bratislava (Fig. 2-6). Iron The amount of suspended solids influences the iron content in surface water, therefore higher iron content occurs in samples taken during higher discharges. Similarly as in case of suspended solids, iron concentrations at most of sampling sites in the evaluated year were lower than in the year 2010. In the Danube water, in the Mosoni Danube at Čunovo/Rajka and in the river branch system iron concentrations fluctuated in the range from 0.01 to 0.90 mg.l-1, with one higher value of 1.26 mg.l-1, which was determined in the April sampling at the site No. 0002 in the Danube old riverbed at Dunaremete. In the reservoir the iron concentrations correlate with the contents of suspended solids at particular sampling sites. The highest values were measured in October, and in the navigation line (sampling site No. 307) in August. Overall, the iron concentrations in the reservoir varied in the range from 0.05 to 0.75 mg.l-1. Contrary to the other sampling sites the iron concentrations were slightly higher than in the year 2010. The highest concentrations were measured on the sampling site No. 1141 in the Mosoni Danube at Vének, where values of 2.05 and 1.34 mg.l-1 were recorded in June and July respectively. The other concentrations, however, varied in the range from 0.07 to 0.51 mg.l-1. The lowest iron concentrations were characteristic for the seepage water. They varied in a narrow range from 0.02 to 0.13 mg.l-1. Manganese Manganese content in the evaluated year was similar as in the previous year. In similar ranges also varied the measured concentrations at particular sampling sites (from <0.005 to 0.11 mg.l-1). An exception was only the sampling site No. 1141 in the Mosoni Danube at Vének, where the manganese contents fluctuated from <0.02 to 0.20 mg.l-1. In comparison to the previous year no considerably higher values occurred, except the sampling site at Vének. Basic physical and chemical parameters - summary Basic physical and chemical parameters in the Danube and in the river branch system connected to the Danube main riverbed show seasonal variations and some of them predominantly depend on the flow rate. The fluctuation of basic physical and chemical parameters in the Mosoni Danube and in the seepage canal reflects the different characteristics of these water bodies. The water quality in the Mosoni Danube is influenced by the Danube water and on sampling site at Vének by its affluents and wastewater from Győr. The water in the seepage canal is influenced mainly by the leaking groundwater. In comparison with the previous year lower maximal values of water temperature (except the seepage canals) and also lower were the values of specific conductivity were recorded. Conversely, the water reaction (pH) reached higher values, due to the mass development of phytoplankton. The pH values in the reservoir fluctuated in wider range, on the other monitored sampling sites in narrower range than in the year 2010. The iron and manganese concentrations and the suspended solids content were influenced by the actual hydrologic regime. In comparison with the previous year the iron concentrations and the suspended solids content were lower (except the sampling site at Vének) and on some sampling sites achieved only half of the values measured in the year 2010. The manganese concentrations varied in similar ranges, but contrary to the previous year sporadic higher concentrations did not occur. 2.3. Cations and AnionsThe quantitative ratio of the surface water ionic composition in the evaluated year 2011 showed high stability, just as in previous years. The seasonal fluctuation of individual ions content followed the changes of conductivity. Changes of dissolved solids content are related to the flow rate fluctuation in the Danube. Compared to the long-term measurements the values of basic cations and anions have not changed. The development of cations and anions concentrations at particular sampling sites was similar. Higher content of salts is characteristic for the sampling site on the Mosoni Danube at Vének due to its affluents and cleaned wastewater from Győr. The average values of sodium, potassium, chloride and sulphate ions at Vének exceeded the average values registered on the other sampling sites. Lower conductivity values in the year 2011 at some sampling sites were cause mainly due to lower contents of hydrogen-carbonates, sulphates, chlorides and sodium. The most stable ionic composition was characteristic for the seepage water. 2.4. NutrientsAmmonium ion The ammonium ion contents in the year 2011 were lower than in the previous year and their course was more balanced. Higher values occurred mainly at the beginning of the year. After warming in March contents sharply decreased, on a number of sampling sites even below the detection limit. The maximal concentration (0.24 mg.l-1) was measured in January at sampling site No. 1141 in the Mosoni Danube at Vének, similarly as in the year 2010. The measured contents at this site were the highest, but in comparison with the previous year they decreased. The ammonium ion contents in the Danube water fluctuated in the range from <0.02 to 0.155 mg.l-1. The concentrations in the right-side river branch system were similar as in the year 2010 (<0,02-0,12 mg.l-1). In the left-side river branch system they were lower, mostly below the detection limit (<0,051 mg.l-1) and maximally up to 0.09 mg.l-1. Similarly, below the detection limit was the majority of ammonium ion concentrations at sampling sites in the reservoir. Higher frequency of such values is caused by the relatively high detection limit in case of these sampling sites. Values above the detection limit in the reservoir were measured at the beginning of the year (January, February) and in autumn (September, October), maximally up to 0.115 mg.l-1. The ammonium ion concentrations in the seepage water varied in the range from <0.02 to 0.10 mg.l-1 and were also lower than in the previous year. Nitrates In case of nitrates seasonal fluctuation of measured values is characteristic, which is less remarkable in seepage canals. In the winter months at the beginning of the year 2011 (January-March) the concentrations of nitrates reached highest values. In the spring, after warming and along with the development of phytoplankton, concentrations decreased to the lowest values. Low concentrations were recorded from May to August and September. From October the content of nitrates began to increase slowly. Seasonal fluctuation is related to the vegetation period and consumption of nutrients in the water. In the vegetation period the nutrient content mostly decreases to the half of the winter amount. The course of nitrates concentration at particular sampling sites, except the seepage canals, was similar in the evaluated year. Higher values occurred in the Danube water and in the right-side river branch system, where they fluctuated from 4.9 to 14.9 mh.l-1. In the reservoir lower concentrations were measured (maximally up to 13.4 mg.l-1). In connection with the mass development of phytoplankton, zooplankton and macrophytes the concentrations of nitrates decreased to values lower than in previous years. On the sampling site No. 308, where the highest abundance of phytoplankton and zooplankton, and major development of macrophytes was registered in the surroundings, concentrations of nitrates in June , July and August decreased below the detection limit of this parameter (below 4 mg.l-1). In the Mosoni Danube at both sampling sites, Čunovo/Rajka (No. 3529/0082) and Vének (No. 1141) was the content of nitrates similar. The lowest concentrations of nitrates were characteristic for the seepage water, where they varied in a narrow range. In the left-side seepage canal at Hamuliakovo (sampling site No. 317) from <4 to 8.7 mg.l-1, and in the right-side seepage canal at Čunovo/Rajka (sampling site No. 3531/0084) from 2.1 to 10.3 mg.l-1. Generally it can be stated, that the nitrates contents in the evaluated year were lower and the course of measured values was more balanced than in the year 2010. The course of nitrates concentrations at selected sampling sites is illustrated in Fig. 2-7. Nitrites The nitrites ion concentrations are considered as a temporary product of nitrification and denitrification processes. In the evaluated year the course of nitrites at sampling sites in the Danube and in the river branch system showed seasonal variation, similar to nitrates. Concentrations in the Danube water fluctuated in the range from 0.006 to 0.118 mg.l-1, and up to 0.148 mg.l-1 in the river branch system. Similar concentrations as in the Danube water were recorded in the Mosoni Danube at Čunovo/Rajka (sampling site No. 3529/3360). The highest values during the year were measured on sampling site No. 1141 at Vének (0.034-0,150 mg.l-1). The nitrites content in the reservoir fluctuated from 0.02 to 0.09 mg.l-1. The content of nitrites in seepage canals varied in similar range (0.02-0.82 mg.l-1). Generally it can be stated that the nitrites content in the evaluated year was similar or slightly lower as in the year 2010, depending on the sampling site. Total nitrogen The total nitrogen belongs to water quality parameters with significant seasonal fluctuation. Maxima are reached in colder months and minima in warmer months and during the vegetation period. In the year 2011 the total nitrogen content fluctuated in the range 1.35-5.49 mg.l-1. The highest value were measured in April sample on the sampling site No. 0043 in the Danube old riverbed, upstream of the submerged weir. The total nitrogen contents in the reservoir were slightly lower, the maximal value reached 3.49 mg.l-1. At sampling site No. 308 the total nitrogen contents in July and August decreased to 1.0 mg.l-1. These low values are associated with the mentioned development of phytoplankton, zooplankton and macrophytes in the surroundings of sampling site. Seasonal fluctuation in the seepage canals is less remarkable and regarding the origin of the water the total nitrogen content is lower (Fig. 2-8). In the left-side seepage canal (sampling site No. 317) the total nitrogen in the evaluated year fluctuated in a narrow range from 1.01 to 2.28 mg.l-1. In the right-side seepage canal at Čunovo/Rajka (common sampling site No. 3531/0084) different ranges of values were documented again by the Slovak and Hungarian Parties: 1.03-2.32 mg.l-1 and 1.03-3.39 mg.l-1 respectively – Fig. 2-8. Similar differences in measured values can also be registered at jointly monitored sampling sites in the Danube at Medveďov (No. 112/2306) and in the Mosoni Danube at Čunovo/Rajka (No. 3529/0082). The total nitrogen contents in the evaluated year were lower than in the year 2010, and in the right-side river branch system similarly high values as in the previous year did not occurred. Phosphates Higher values of phosphates concentrations are characteristic for colder months and during high flow rates. The lowest values are typical for vegetation period, when intensive growth of algae going on. There is an inversely proportional relationship between the phosphates content and the phytoplankton abundance. Low contents of phosphates in the evaluated year occurred in the period from March to June, when on most of monitored sampling sites mass development of phytoplankton, and later also zooplankton was observed, and in surroundings of sampling site No. 308 in the reservoir macrophytes as well. At this sampling site depletion of phosphates was registered also in July and August, what was documented by low concentrations, reaching also values below the detection limit. Also the second wave of phytoplankton development in August, which was observed mainly in the right-side of reservoir (sampling site No. 309), was manifested by decrease of phosphates content below the detection limit. Contents of phosphates at other sampling sites in the period from July till end of the year did not decrease below 0.07 mg.l-1, and the sporadic occurrence of higher values was connected with higher flow rates and cooling. The course of phosphates concentrations during the year was similar at particular sampling sites, except seepage canal and the sampling site No. 1141 in the Mosoni Danube at Vének. This sampling site is influenced by pollution coming from the affluents and wastewater treatment plant in Győr. The lowest concentration here was measured in early April and the highest in early July - 0.38 mg.l-1, what represents the highest value measured in the year 2011. Concentrations of phosphates in the Danube water fluctuated in the range from <0.02 to 0.24 mg.l-1. Slightly lower contents were registered in the river branch system – up to 0.18 mg.l-1. Contents in the reservoir and in the tail-race canal varied maximally up to 0.15 mg.l-1. Development of phosphates content in 2011 in seepage canals was more balanced in comparison with the other sampling sites. In the right-side seepage canal at Čunovo/Rajka (sampling site No. 3531/0084) content of phosphates fluctuated in the narrowest range of values from <0.02 to 0.07 mg.l-1. Development of phosphates content in the year 2011 at some sampling sites is documented in Fig. 2-9. In comparison with the previous year the phosphates concentrations were lower, except the sampling site No. 317 in the left-side seepage canal at Hamuliakovo. Total phosphorus Changes of the total phosphorus content in time only partially follow the quantitative changes of phosphates. The increase of its concentration in surface water is often caused by phosphorus bound to suspended solids. The contents of total phosphorus in the Danube main flow varied from 0.02 to 0.18 mg.l-1. Contents on sampling site in the Danube old riverbed and in the right-side river branch system were slightly higher (up to 0.23 mg.l-1). The highest values at these sampling sites were recorded in October and were connected with the discharge wave in October. Also in the year 2011 the highest total phosphorus concentrations were characteristic for the sampling site No. 1141 in the Mosoni Danube at Vének, where they fluctuated from 0.11 to 0.41 mg.l-1. The total phosphorus contents in the reservoir varied in similar range as in the year 2010, 0.02-0.17 mg.l-1. Their course, however, differed due to different hydrologic and climatic conditions of the evaluated year. Low concentrations, up to 0.10 mg.l-1, occurred from January to August. From September they have not decreased below 0.10 mg.l-1. The lowest contents were measured in seepage canals (0.01 to 0.08 mg.l-1), with one higher value of 0.17 mg.l-1 in December in the left-side seepage canal. Similarly as in case of total nitrogen, differences in total phosphorus concentrations measured by the Slovak and the Hungarian Party were also registered in the Danube old riverbed, and mainly at jointly monitored sampling sites in the Mosoni Danube and in the right-side seepage canal at Čunovo/Rajka. The time course of total phosphorus concentration in the year 2011 at selected sampling sites is shown in Fig. 2-10. Nutrients - summary Individual nutrients show seasonal fluctuation. Higher concentrations are characteristic for colder months; decrease of values is recorded in the spring after warming. Seasonal fluctuation relates with biochemical processes in the water, which are temperature dependent. Seasonality in the evaluated period was more remarkable in case of nitrates, nitrites and total nitrogen, less remarkable in case of ammonium ions. The content of phosphates and total phosphorus can rise at higher flow rates, what was documented by higher concentrations in the Danube old riverbed during the discharge wave in October. The nutrients content at particular sampling sites recorded in the year 2011 was lower than in the previous year, and its course was more balanced. An exception was the higher content of phosphates in the left-side seepage canal. The most polluted water in terms of nutrients appears to be the surface water in the Mosoni Danube at Vének, where higher concentrations of nutrients occur during the year more frequently and disrupt the seasonal fluctuation. The lowest and the most balanced nutrients values can be found in the seepage water, what results from its groundwater origin. The nutrient content in the Danube water is potentially sufficient for development of eutrophic processes under other suitable conditions. 2.5. Oxygen regime parametersDissolved oxygen Dissolved oxygen content in the surface water is besides the decay processes of organic pollution influenced by hydro-meteorological conditions and by assimilation activity of phytoplankton. Dissolved oxygen content proportionally decreases with increasing water temperature. Low concentrations in the year 2011 were recorded from June-July to September. The highest values occurred mainly in March, in the Danube old riverbed and in the river branch system also in November. Higher concentrations at some sampling sites were also measured in connection with the development of phytoplankton and macrophytes in the summer period (e.g. in the reservoir at sampling site No. 308 early in July and late August, in the Danube old riverbed at sampling sites No. 0043, 0042, 0002 and in the right-side river branch system on sampling site No. 1112 at Helena in June). Time series data fluctuated in a wider range in comparison with the previous year and a number of lower values occurred, the lowest (4 mg.l-1) was recorded in the sample taken in Ásványi river arm in November (sampling site No. 1126). The dissolved oxygen concentration at observed sampling sites mostly varied in the range from 6.4 to 14.7 mg.l-1, in the reservoir from 8.0 to 16.1 mg.l-1. Low concentrations except the Ásványi river arm were recorded also in the right-side seepage canal at Čunovo/Rajka (sampling site No. 3531/0084), where they varied from July to October below 7.0 mg.l-1 (the lowest content was 5.0 mg.l-1). Despite these low values the oxygen conditions in the given year according to the evaluation methodology can be classified as very good. CODMn and BOD5 CODMn and BOD5 parameters are used for expression of organic contamination of water, they indicate the chemically and biologically degradable organic matter content. Higher values of CODMn and BOD5 usually occur at periods with higher flow rates in the Danube, when the water contains higher amount of natural organic matter. Organic pollution expressed by the CODMn parameter in the evaluated year was lower on the monitored sampling sites than in the previous year. Maximal values on particular sampling sites occurred mainly in October and were connected with higher flow rates in this period. The highest values in the right-side river branch system (Ásványi river arm and the sampling site at Helena) were determined in April, in the Danube at Bratislava and Medveďov in March. The poorest water in terms of organic contamination was the water in seepage canals, where the CODMn values fluctuated in narrow range, from <0.8 to 1.6 mg.l-1 (sampling site No. 317 and 0084 - Fig. 2-11). In the Danube main riverbed, in the reservoir and in the Mosoni Danube the CODMn values varied from 0.8 to 4.0 mg.l-1. In the river branch system they were slightly higher (from 1.2 to 4.8 mg.l-1), whereas in the sample taken on sampling site No. 1112 at Helena in April the highest value in 2011 was determined (12.2 mg.l-1). The values in the Danube old riverbed measured by the Slovak Party on the left side varied in the range from <0.8 to 3.3 mg.l-1, while for the right side, which was monitored by the Hungarian Party, higher values were characteristic, from 1.4 to 5.0 mg.l-1. The highest values of CODMn during the year were recorded in the Mosoni Danube at Vének (sampling site No. 1141), where they varied from 2.6 to 7.6 mg.l-1 (Fig. 2-11). In the year 2011 in case of BOD5 lower values than in the previous year were recorded on sampling sites in the Danube main flow, on the right side of the Danube old riverbed, in the Mosoni Danube and in the left-side seepage canal. On the other sampling sites (left side of the Danube old riverbed, tail-race canal, left-side river branch system and the right side seepage canal) the BOD5 values were higher than in the previous year. The BOD5 values in the Danube water varied from 0.3 to 6.9 mg.l-1. In the Mosoni Danube at Rajka (sampling site No. 0082) were the BOD5 values higher than at the sampling site in Vének (No. 1141) - 1.9-5.7 mg.l-1 versus 0.8-5.4 mg.l-1. Differences were registered again in the BOD5 data measured by the Hungarian and Slovak Parties. On sampling sites in the Danube old riverbed observed by the Hungarian Party (right side) BOD5 values varied in wider range (from 0.3 to 6.6 mg.l-1) compared to the left side, which is observed by the Slovak Party (from <0.85 to 4.0 mg.l-1). Differences in the measured values can be seen mainly at jointly observed sampling sites in the Danube at Medveďov, in the Mosoni Danube and in the right-side seepage canal at Čunovo/Rajka. The differences are more noticeable than in the year 2010. The Hungarian data in some cases are 2-3 times higher than the Slovak data (Fig. 2-12). Slightly higher values than in 2010 were registered at sampling site in reservoir, where they varied from <0.85 to 4.0 mg.l-1 (in the previous year they varied from <0.85 to 3.8 mg.l-1). Similarly as in the previous year narrower range of values is characteristic for the left-side river branch system (<0.85-3.5 mg.l-1) than for the right-side river branch system (0.2-7.2 mg.l-1). The lowest pollution is characteristic for water in the left-side seepage canal at Hamuliakovo (sampling site No. 317), where the BOD5 values varied in narrow range from <0.85 to 1.4 mg.l-1. Oxygen regime and organic carbon parameters - summary Dissolved oxygen content remained preserved on the level of previous years. Although there was more lower concentrations than in the year 2010, the oxygen conditions can be evaluated as very good. This also applies for the most polluted sampling site in the Mosoni Danube at Vének. Dissolved oxygen content varied in wider ranges and compared to the year 2010 values below 7 mg.l-1 (which is the limit value for I. quality class according to the Table 2-2) occurred more frequently. Based on the monitoring results it can be concluded that in comparison with the previous year the organic contamination expressed by CODMn was lower, while the BOD5 values were lower at some locations and higher at others. Also in the year 2011 there were differences in BOD5 values recorded between the Slovak and Hungarian Party on jointly monitored sampling sites. Values obtained by the Hungarian Party were higher. The water in the seepage canals remained the cleanest. The most polluted water remains the water in the Mosoni Danube at Vének, even if the values of BOD5 in the given year did not belonged to the highest and were lower than in the year 2010. Indicators of oxygen regime in the Danube reflect the seasonal assimilation activity of phytoplankton and organic carbon oxidation processes. The measured data (1992-2011) indicate downward tendency of organic load at the Bratislava section of the Danube, which is related to the substantial wastewater treatment improvement in the upstream Danubian countries. 2.6. Heavy metalsFrom among heavy metals the joint monitoring includes observation of zinc, mercury, arsenic, copper, chromium, cadmium, nickel and lead contents. In 2011 heavy metals were not monitored at three sampling sites: No. 3376 in the left-side river branch system at Dobrohošť, No. 3531 in the right-side seepage canal at Čunovo, No. 3529 in the Mosoni Danube at Čunovo, and in the Danube at Medveďov (sampling site No. 112 only the chromium, copper, nickel and zinc were monitored. In the evaluated year low concentrations were measured in case of zinc, mercury, arsenic, chromium, cadmium and lead, majority of values were below the detection limits. In case of zinc the highest concentration in the year 2011 (24.4 µg.l-1) was determined in sample taken in the left-side seepage canal at Hamuliakovo (sampling site No. 317) in August. Other values fluctuated below 20 µg.l-1 (what is a new detection limit in case of analyses made by VÚVH). Many values were below the detection limits; <10 µg.l-1 in case of Hungarian data and <1µg.l-1 in case of analyses made by SVP-BA. The mercury in the evaluated year on all observed sampling sites, except the sampling site No. 109 at Bratislava, was below the detection limit values, so below 0.05 µg.l-1 (Slovak data) or 0.02 µg.l-1 (Hungarian data). Concentrations at Bratislava achieved higher values than in the year 2010 and varied from <0.01 to 0.17 µg.l-1 (maximum in 2010 was 0.062 µg.l-1). Arsenic concentrations varied below 5.0 µg.l-1, what is the detection limit in case of analyses made by SVP-BA. On sampling sites monitored by VÚVH or Hungarian Party arsenic concentrations fluctuated in the range from <0.9 to 3.9 µg.l-1. Majority of values were below the detection limits. The highest concentration was determined on sampling site No. 2306 in the Danube at Medveďov in November. On sampling site at Vének (No. 1114) there were no such high values as in the year 2010. All concentrations of chromium measured by the Slovak Party were below the detection limits (0.2 µg.l-1 or 2.0 µg.l-1 (from July) in case of analyses made by VÚVH, and 0.6 µg.l-1 in case of analyses made by SVP-BA). Hungarian Party measured nine values exceeding the detection limit of 1.7 µg.l-1. The highest content of 11.5 µg.l-1 was recorded on sampling site No. 0042 downstream of the submerged weir at Dunakiliti in May. Cadmium on all sampling sites was found in concentrations below detection limit. Only one value measured in the Danube old riverbed on sampling site No. 0002 at Dunaremete achieved the detection limit value, so 0.1 µg.l-1. Low concentrations in 2011 were characteristic also for lead, they varied below the detection limit, only three values on sampling sites on the Hungarian territory slightly exceeded the limit value of 0.7 µg.l-1. Maximum was 0.9 µg.l-1. This value is, however, lower than the detection limit values used by the Slovak Party (1.0 µg.l-1 for VÚVH and 1.5 µg.l-1 in case of SVP-BA). The highest concentrations from among heavy metals were characteristic for copper. The copper concentrations fluctuated from <0.7 to 10.2 µg.l-1. The highest value was measured on sampling site No. 0042 downstream of submerged weir at Dunakiliti in May. The highest value recorded by the Slovak Party reached 3.0 µg.l-1 (sampling site No. 112 in the Danube at Medveďov). At jointly observed sampling sites higher concentrations were measured by the Hungarian Party, but the differences were not as great as in the previous period. The content of nickel in the surface water in the evaluated year was slightly higher than in the previous year. It varied in the range from <0.7 to 4.2 µg.l-1 (in 2010 up to 3.34 µg.l-1). On the Slovak territory only two concentrations exceeding the limit value were measured in the reservoir (1.41 and 1.74 µg.l-1). In summary it can be concluded that heavy metal concentrations, which were determined from filtered samples, were low during the evaluated year, with occasional occurrence of higher values. Great part of the measured values was below the detection limits of applied analytical methods. Low concentrations were characteristic for zinc, mercury, arsenic, chromium, cadmium and lead. The highest concentrations were characteristic for copper. In comparison with the year 2010 the concentration of zinc, copper, cadmium and lead were similar or slightly lower. Concentration of mercury, arsenic, chromium and nickel were slightly higher. The detection limits of particular heavy metals often correspond to the II., III. or IV. class of surface water quality according to the Table 2-2. The detection limits differ depending on the laboratory. The evaluation of heavy metals according to the agreed limits (Table 2-2) at selected sampling sites is given in Table 2-6. Based on the comparison of heavy metal concentrations with limits pursuant to the Directive of the European Parliament and of the Council No. 2008/105/EC on environmental quality standards, according to the limit values accepted on the 88. meeting of the sub-commission for water quality of the Slovak-Hungarian Trans-boundary Water Commission and according to the Regulation of the Government of the Slovak Republic No. 269/2010 Z.z. (Annex No. 1, Part B) it can be concluded, that in the year 2011 all concentrations of heavy metals, except the mercury, were in full compliance with environmental quality standards. In case of mercury slight discrepancy on sampling site no. 109 at Bratislava was registered with the maximal allowable concentration, but the requirement for the annual average has been met. 2.7. Biological parametersChlorophyll-a Chlorophyll-a concentrations indicate the amount of phytoplankton and provide information about the eutrophic status of water. The amount of chlorophyll-a is influenced by the flow rate and temperature conditions of the evaluated year and by the fluctuation of nutrients content. In relation to different hydrologic and climatic conditions the development of chlorophyll-a in the evaluated year differed in comparison with the previous year. Higher chlorophyll-a values were recorded in 2011 than in the year 2010. High values were registered from March to June, when the flow rates varied below the long-term average daily values and the air temperature fluctuated above the long-term averages. Phytoplankton development was also registered in this period, which several times achieved the value of mass occurrence. After exhausting of nutrients and cooling in late June and early July, the abundance of phytoplankton and also the values of chlorophyll-a decreased, and on some sampling sites reached minimal values. Subsequently the chlorophyll-a content achieved low values (up to 6 mg.m-3) until the end of the year. An exception was the slight increase (maximally up to 20.9 mg.m-3), which occurred in August at sampling sites in the Danube old riverbed (No. 4016, 4025 and 3739) and especially in the reservoir (No. 309). This increase was associated with the second wave of phytoplankton development on these sampling sites. The chlorophyll-a development in the year 2011 on sampling site No. 1141 in Mosoni Danube at Vének was different from other sampling sites. Higher values were recorded in June, September and the maximal value of 17.8 mg.m-3 occurred in October. The maximal value was slightly higher than in the year 2010, when the lowest measured concentrations of chlorophyll-a were documented at this sampling site since beginning the monitoring (<2-11.8 mg.m-3). Compared with the previous year, the content of chlorophyll-a at sampling sites in the reservoir, in the left-side of the Danube old riverbed and in the left-side river branch system was two to three times higher. In 2011 it ranged from <6 to 55.1 mg.m-3. Contents at sampling sites on the Hungarian territory, in the right-side river branch system and on the right-side of the Danube old riverbed, were significantly lower. They varied in the range from <2 to26 mg.m-3, and were even lower than in the year 2010. In the Danube main flow the chlorophyll-a fluctuated from 1.2 to 41.9 mg.m-3. At the jointly monitored sampling site No. 112/2306 at Medveďov significant differences were observed in the measured values. While the Slovak Party recorded chlorophyll-a content in the range 1.2-41.9 mg.m-3, the content recorded by the Hungarian Party varied only in the range <2-18.9 mg.m-3. Similar difference was also documented at jointly observed sampling site No. 3529/0082 in the Mosoni Danube at Čunovo/Rajka. The maximal value in 2011 (55.1 mg.m-3) was measured in the reservoir at sampling site No. 311. Chlorophyll-a content in seepage canals was low (up to 7.1 mg.m-3), without significant fluctuations. Overall, it can be stated that chlorophyll-a contents recorded by the Slovak Party in the evaluated year were higher than contents measured by the Hungarian Party, what is illustrated by the development of this parameter at selected sampling site in Fig.2-13. Other biological parameters Evaluation of biological quality elements in 2011 at sampling sites monitored by the Hungarian Party was carried out in the frame of evaluation of ecological status of waters in accordance with the methodology agreed within the Trans-boundary Water Commission, which involved the evaluation of sampling sites, not water bodies. The Slovak Party will evaluate the ecological status at jointly observed sampling sites every six years. At sites monitored by the Slovak Water Management Authority (SVP-BA) continued the evaluation used in the previous period. Biological parameters at sampling sites monitored by the Hungarian Party From among the biological quality elements the Hungarian Party in the year 2011 observed phytoplankton, phytobenthos, and at sampling sites at Rajka, Medveďov and Vének (Mosoni Danube) also macrozoobenthos. During phytoplankton observations the highest density of algae was recorded in samples taken in spring, when the most abundant were the centric diatoms (Bacillariophyceae - Centrales). Compared to the previous year the values were similar. In the river branch system stronger development of algae was documented in April and May in the river branch at Helena and in the Ásványi river branch. The dominant phytoplankton species were mostly the same as in the Danube water, but the species diversity was higher. Quantitative changes of phytoplankton in the Mosoni Danube at Rajka followed the changes in the main riverbed. The development of phytoplankton at Vének was influenced by hydro-morphological particularities and plenitude of nutrients that get into the river with wastewater. In this section species preferring eutrophic water were more abundant. Lower abundance of species, as well as individuals are characteristic for the seepage water during the whole year. An overview of biological quality elements evaluation results is given in Table 2-3. Based on results obtained from the monitoring of biological quality elements it can be stated that according to the phytoplankton I. quality class was determined at most of sampling sites, which corresponds to high quality. II. class, so good quality was determined in the seepage water, in the river arm at Helena and in the Mosoni Danube at Vének. In terms of phytobenthos god quality (II. class) was determined at all sampling sites. Macrozoobenthos was observed only at three sampling sites (Table 2-3). The quality according to this parameter on two of them (in the Danube at Rajka and at Medveďov) was good, and in the Mosoni Danube at Vének it was bad. However, the assessment system for macrozoobenthos is not definitive, the international calibration has not been completed yet. Table 2-3: Quality classes for selected biological quality elements on the Hungarian side
Based on the monitoring results of biological quality elements and considering the evaluation of physico-chemical elements and evaluation of other specific pollutants (see the Hungarian National Report in 2011) the ecological status of surface water at individual sampling sites was determined as good, so the II. quality class. Results from macrozoobenthos monitoring were not included in the final evaluation. Biological parameters at sampling sites monitored by the Slovak Party The monitoring and evaluation of biological quality elements was carried out according to the methodology applied in previous years. Phytoplankton In the period between March and October 2011 twelve phytoplankton samples were taken at monitored sampling sites (Table 2-4). Compared to the year 2010 higher values of phytoplankton abundance were reached at all sampling sites. High values of phytoplankton abundance were first reported in March and at sampling sites No. 309 in the reservoir and No. 3376 in the river branch system they represented the maximal values measured at these sampling sites in the year 2011. At other sampling sites maxima were recorded in May (No. 311, 3739, 3530) or in June (No. 307, 308). The highest abundance of phytoplankton (28434 individuals.ml-1) was registered on the sampling site No. 308 in the upper part of the reservoir at Kalinkovo as a result of mass development of centric diatoms. In the second half of June the abundance significantly declined due to exhaustion of nutrients and retreat of traditional spring development of diatoms. The decline in the lower part of the reservoir at Šamorín was moderate, probably due to the lack of the June flood wave. The most significant decline was registered at sampling site No. 308, where development of macrophytes had also significant influence on decline. The minimal abundance of phytoplankton was recorded here in July, unlike the other sampling sites, where minima were registered only in October. The second, more moderate development of phytoplankton in the year 2011 was observed on the sampling sites in August, except the sampling site No. 308. The abundance of phytoplankton in the year 2011 varied from 58 to 28434 individuals.ml-1. With the exception of seepage canal, the limit for mass development of phytoplankton on other sampling sites was exceeded of two to five times in the period from March to June (in the previous year the limit value of 10000 individuals.ml-1 was exceeded only once at sampling site No. 309). In comparison with the year 2010 higher average values of phytoplankton abundance were recorded at all sampling sites, the maximal values were also higher. The highest value of annual average (7870 individuals.ml-1) was registered at sampling site No. 309 in the lower part of the reservoir at Šamorín, like in the year 2010. Similarly to the previous period, the most abundant in the Danube old riverbed, in the reservoir, in the tailrace channel at Sap and in the river branch system were the centric diatoms (Bacillariophyceae - Centrales). Contrary to the previous period, in the left-side seepage canal at Hamuliakovo (sampling site No. 317) the cyanophyta (Cyanophyceae) created a substantial part of phytoplankton, from among the diatoms the pennate diatoms (Bacillariophyceae - Pennales) had more significant portion in phytoplankton. The phytoplankton composition significantly determines the saprobe index of biosestone. The saprobe index in 2011 varied from 1.46 to 2.36 (Table 2-4). It fluctuated in the range, which corresponds to beta-mezosaprobity. Such environment offers suitable living conditions for a wide scale of organisms with high species diversity. The average values of saprobe indexes at seven sampling sites were lower than in the year 2010, at three sampling sites they were the same (Table 2-4). Table 2-4: Values of saprobic index of biosestone in 2011
Concerning the phytoplankton abundance, as a substantial determinant of the saprobic index, it can be stated that the hydropower system had no negative influence on saprobity level either in 2011. Macrozoobenthos From the ecological point of view the macrozoobenthos observation in flowing water bodies appears to be the most suitable method for bioindication. Samples can be relatively easily accessible and quickly processed. In the year 2011 the macrozoobenthos samples were taken in April, August and October on monitoring sites given in Table 2-5. In sections with quickly flowing water with gravely and stony bottom (sampling site No. 4025) rheophilic and oxybiontic macrozoobenthos species prevail, indicating beta-mezosaprobity. Species Lumbricidae g. sp. div., Chironomus sp., Dikerogammarus villosus, Theodoxus danubialis, Jaera istri, Corophium curvispinum and Cricotopus sp. dominated at this sampling site in the year 2011. In sections with slowly flowing water stagnophilic and oligooxybiontic species appear, which are resistant to slight contamination. On these sections sandy and muddy bottom can be found – sampling sites in the Danube old riverbed No. 4016 at Dobrohošť and 3739 at Sap, where Lumbricidae g. sp. div. and Dikerogammarus villosus dominated in the evaluated year. At Dobrohošť also Theodoxus danubialis, Hydropsyche contubernalis and Eukiefferiella sp., at Sap furthermore Limnomysis benedeni, Lithoglyphus naticoides and Corophium curvispinum. In the reservoir there are places with different flow velocities. Depending on the flow velocity there exist different types of bottom substrates. Sandy and gravely substrate (sampling site No. 307) gradually changes into muddy substrate at places with slow flow velocity (sampling sites No. 308, 309 and 311). Dominant macrozoobenthos species in the reservoir in 2011 were Lumbricidae g. sp. div., Hypania invalida and Potamopyrgus antipodarum. In the upper part of the reservoir on sampling site No. 308 at Kalinkovo also Cricotopus sp., Limnomysis benedeni and Corophium curvispinum. At sampling sites in the lower part of the reservoir at Šamorín (sampling sites No. 309, 311) furthermore Chironomus plumosus henslowanum, Pisidium sp. and Plumatella repens. In the river branch system species Lumbricidae g. sp. div., Hydatophylax infumatus, Dikerogammarus villosus, Chironomus sp., Potamopyrgus antipodarum and Theodoxus fluviatilis dominated. Based on the determined species
the saprobic indexes of macrozoobenthos were calculated, which fluctuated in the
range from 1.85 to 2.89 (Table 2-5). Values in the Danube old
riverbed varied from 1.85 to 2.20, which correspond to beta-mezosaprobity. The
saprobic index in the reservoir reached values from 2.02 to 2.89, which
correspond to beta and alpha mezosaprobity depending on the sampling site
location. In terms of seasonal changes the saprobic index of macrozoobenthos
showed slight improving compared to the previous year in the spring and autumn
periods. In the summer period deterioration was registered in connection with
increased eutrophication. Table 2-5: Values of saprobic index of macrozoobenthos in 2011
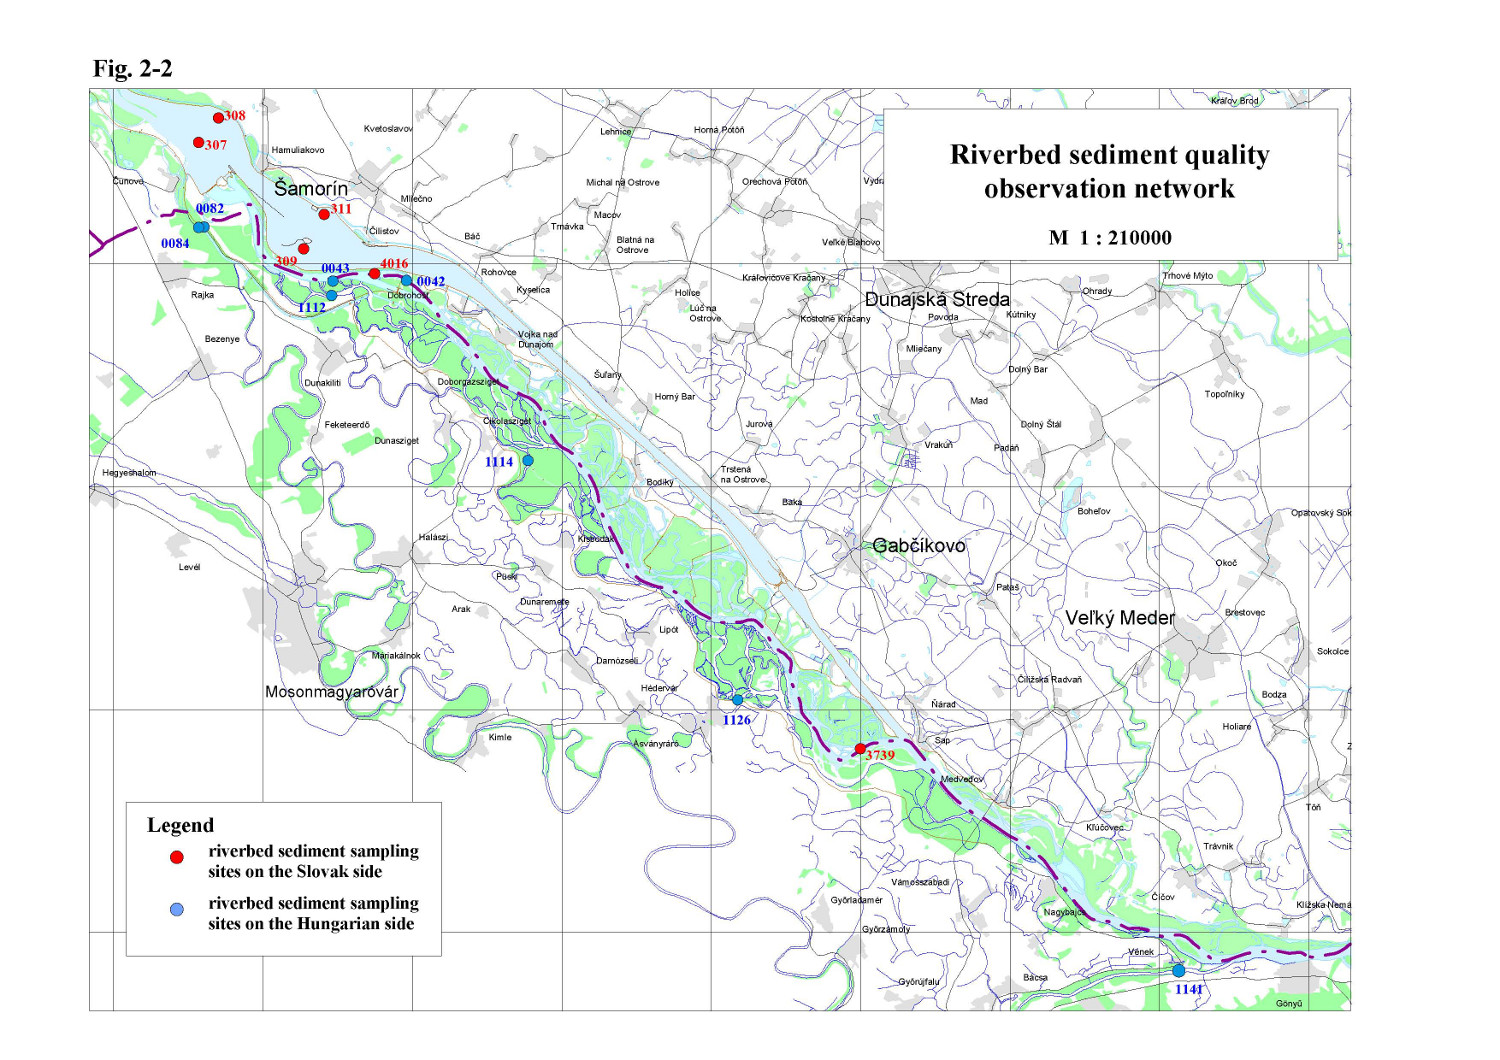
The other aspects of development of macrozoobenthos communities are evaluated in Part 7 – Biological monitoring, where more detailed evaluation for cladocerans (Cladocera), copepods (Copepoda), molluscs (Mollusca), dragonflies (Odonata), mayflies (Ephemeroptera) and caddisflies (Trichoptera) can be found. 2.8. Quality of sedimentsIn the evaluated year 2011, similarly to previous years, the Slovak and Hungarian Parties have realized unified evaluation of sediment quality according to the „Canadian Sediment Quality Guideline for Protection of Aquatic Life” (CSQG) published in 1999, revised in 2002. The sediment sampling in the frame of Joint Monitoring by the Slovak Party was carried out in September 2011 at six sampling sites. The Hungarian Party sampled the sediments in May and October 2011 at seven sampling sites. The situation of sampling sites is illustrated in Fig. 2-2. The list of analysed parameters was the same as in 2010. Besides the inorganic and organic micro components the Hungarian Party analysed the total phosphorus and total nitrogen contents as well. Concentrations of heavy metals in sediment samples taken at sampling sites on the Slovak territory were low. The lowest contents were characteristic for mercury and lead, since not a single value achieved the threshold effect level (TEL). At these concentrations the unfavourable effect on biological life occurs rarely, and they corresponds to an uncontaminated natural environment. Contents of other monitored heavy metals only slightly exceeded the limit value for TEL (chromium at three sampling sites, copper, zinc and arsenic at five sampling sites and cadmium at every observed sampling site). In sediment samples taken on the Hungarian territory lower number of concentrations above the threshold values for heavy metals occurred. The lowest contents (lower than TEL) were documented in case of lead, cadmium and in May also in case of arsenic. The most exceedings of TEL and the highest contents were recorded in case of zinc. At two sampling sites (No. 1141 in the Mosoni Danube at Vének and No. 1112 in the river branch system at Helena) in October sampling they exceeded the probable effect level (PEL), when the unfavourable effect on biological life occurs frequently. The highest zinc concentration of 358 mg.kg-1 was recorded at Vének. The sediment from this sampling site was the most enriched with heavy metals, both in May and October. The lowest concentrations of heavy metals are characteristic for the sediment from the seepage canal at Rajka. Organic pollution of sediments taken on the Hungarian territory was very low, only three concentrations slightly exceeded the limit value for TEL and no concentration exceeded the limit value for PEL. In sediments taken on the Slovak territory several higher concentrations occurred. The content of benzo(a)pyrene exceeded the TEL value on six sampling sites, the content of chrysene, fluoranthene, phenantrene and lindane at five sampling sites. In case of lindane the limit value for PEL was exceeded at three sampling sites in the reservoir (No. 307, 308 and 309). At sampling site No. 309 also the only higher concentration of heptachlor was measured, which was close to PEL limit value. Other concentrations of organic micro-pollutants in the range >TEL - <PEL varied near the TEL limit, when the unfavourable effect on biological life occurs rarely, and represent the potential eco-toxicological effect. The highest concentrations of inorganic and organic pollution were registered at sampling site No. 311 in the reservoir and No. 1126 in the Ásványi river arm. Total phosphorus and total nitrogen
content in sediments was analysed by the Hungarian Party as well. Total
phosphorus content in 2011 varied in the range from 284 to 1599 mg.kg-1
and the concentrations of total nitrogen varied in the range from 350 to 1366
mg.kg-1. The lowest contents for both parameters were recorded at
sampling site No. 0084 in the right-side seepage canal at Rajka. The
highest contents of total phosphorus occurred in the Mosoni Danube at Vének
(sampling site No. 1141) and maximal values of total nitrogen were achieved
in the Ásványi river arm (sampling site No. 1126). In comparison with the
year 2010 the total phosphorus and total nitrogen contents were significantly
lower. 2.9. Conclusions
The surface water quality in the evaluated year 2011 was similar as in previous years. Regarding the specific hydrologic and climatic conditions of the year 2011 the time series data of observed parameters were more balanced, with lower frequency of higher values. Increased values of some parameters in the Danube water were related to higher flow rates. The quantitative ratio of ionic composition of the surface water shows high stability in last years. In case of nutrients mostly lower or similar contents were registered than in the year 2010. Oxygen conditions in the year 2011 were very good; the organic pollution represented by CODMn was lower in comparison with the year 2010, in case of BOD5 lower values at some sampling sites and higher values at other sampling sites were recorded. When analysing changes in suspended solids content at sampling sites in the Danube, generally it can be stated that the suspended solids content downstream of the reservoir (at Medveďov sampling site) during flood waves is lower than in the Danube at Bratislava, which demonstrates the settling effect of reservoir. Unlike the previous years, in 2011 the content of dissolved solids measured downstream of reservoir (at sampling site No. 112 at Medveďov) was higher than in the Danube at Bratislava. From among the heavy metals the highest concentrations were recorded in case of copper, the lowest in case of cadmium and lead. Major part of analysed concentrations was below the detection limits of applied analytical methods. In the evaluation of surface water pollution by heavy metals according to applicable regulations on the Slovak and Hungarian side, full compliance with limits for surface water quality can be stated, except the mercury on sampling site at Bratislava. In case of mercury at Bratislava slight discrepancy with the maximal allowable concentration was registered, but the requirement for the annual average has been met. The fluctuation of surface water quality parameters in the right side river branch system since introducing the water supply in 1995 follows their fluctuation in the Danube. The water quality in the Mosoni Danube differs in the upper and lower section of the river. The water quality on the sampling site at Čunovo/Rajka follows the water quality in the Danube, while the water quality in the lower section of Mosoni Danube at Vének (upstream of the confluence with the Danube) is formed by its affluents and local pollution from settlements. From the long-term development point of view the pollution decreased at this sampling site, although the content of nutrients and the CODMn values still reach the highest values in comparison with the other sampling sites. The cleanest water is characteristic for seepage canals, which results from its groundwater origin. Monitoring of biological quality elements of surface water in the evaluated year at sampling sites observed by the Hungarian Party was realised according to the national methodologies for particular biological quality elements in accordance with the Water Framework Directive. The phytoplankton and phytobenthos were evaluated. According to phytoplankton the sampling sites were classified from I. to II. class, thus from high to good status, and according to phytobenthos with II. class, thus good status. Based on the monitoring results of biological quality elements and considering the evaluation of physico-chemical elements and evaluation of other specific pollutants (see the Hungarian National Report in 2011) the ecological status of surface water at individual sampling sites was determined as good, so the II. quality class. The evaluation of sampling sites observed only by the Slovak Party was carried out according to methodology used in previous years. Macrozoobenthos and phytoplankton were evaluated. Saprobic indexes varied in ranges corresponding to beta-mezosaprobity, thus environment that offers suitable living conditions for a wide scale of organisms. Similarly to the year 2010, an exception was the sampling site No. 311 in the reservoir, where in case of the saprobic index of macrozoobenthos alpha-mezosaprobity occurred. The abundance of phytoplankton several times exceeded the limit for mass development in the evaluated year. The highest value of 28434 individuals.ml-1 was registered in the upper part of reservoir on sampling site No. 308 at Kalinkovo. In comparison with the year 2010 higher maximal values were recorded at all sampling sites and the average values of phytoplankton abundance were also higher. The highest value of annual average (7870 individuals.ml-1) was registered at sampling site No. 309 in the lower part of the reservoir at Šamorín, like in the year 2010. The sediment quality was evaluated according to the „Canadian Sediment Quality Guideline for Protection of Aquatic Life” (CSQG) published in 1999, revised in 2002. In the year 2011 the number of exceedings of the threshold concentrations of monitored parameters was slightly higher than in the year 2010. These concentrations in the range >TEL - <PEL represents a status, when the unfavourable effect on biological life occurs occasionally. However, unlike the previous year higher concentrations of zinc (on two sampling sites) and lindane (on three sampling sites) occurred in the evaluated year, which exceeded the Probable Effect Level (PEL) limit values. When exceeding the PEL limit value, the unfavourable effect on biological life occurs frequently. Concentration of monitored parameters from the range >TEL - <PEL, except zinc and arsenic measured on Hungarian sampling sites, were close to the TEL limit values. The highest concentrations of inorganic and organic pollution occurred at sampling site No. 311 in the reservoir and at sampling site No. 1126 in the Ásványi river arm. In the Table 2-6 an indicative classification of selected sampling sites and selected surface water quality parameters was done. The indicative classification was realised using the limit values of five-classes system according to the trans-boundary water quality classification adopted by the Slovak-Hungarian Trans-boundary Water Commission on its LXV. session and given in the „Surface water quality observation directive for Slovak-Hungarian boundary waters and for extended water quality monitoring on the Danube”. Some part of observed parameters shows seasonal fluctuation, which subsequently influences the classification into the quality classes. In case that a range is given (e.g. I-II) it means natural seasonal fluctuation of particular parameters or their dependency on climatic conditions. The quality class in brackets means, that the measured value occurred only once or two times in the evaluated period (mostly during higher discharges or flood waves). The range with asterisks (e.g. I*-II*) represents a situation, when every recorded value was below the detection limit of applied analytical method, but the two Parties have different detection limits. Based on
comparison of water quality entering the influenced area (sampling site at
Bratislava) and water quality that leaves the influenced area (sampling site at
Medveďov) it is evident, that the water quality that leaves the system is very
similar. Table 2-6: Indicative classification of surface water quality parameters according to the agreed limits for surface water quality classification
*
all the data below the detection limit ** most of the data below the detection limit
| |||||||||||||||||||||||||||||||||||||||||||||||||||||||||||||||||||||||||||||||||||||||||||||||||||||||||||||||||||||||||||||||||||||||||||||||||||||||||||||||||||||||||||||||||||||||||||||||||||||||||||||||||||||||||||||||||||||||||||||||||||||||||||||||||||||||||||||||||||||||||||||||||||||||||||||||||||||||||||||||||||||||||||||||||||||||||||||||||||||||||||||||||||||||||||||||||||||||||||||||||||||||||||||||||||||||||||||||||||||||||||||||||||||||||||||||||||||||||||||||||||||||||||||||||||||||||||||||||||||||||||||||||||||||||||||||||||||||||||||||||||||||||||||||||||||||||||||||||||||||||||||||||||||||||||||||||||||||||||||||||||||||||||||||||||||||||||||||||||||||||||||||||||||||||||||||||||||||||||||||||||||||||||||||||||||||||||||||||||||||||||||||||||||||||||||||||||||||||||||||||||||||||||||||||||||||||||||||||||||||||||||||||||||||||||||||||||||||||||||||||||||||||||||||||||||||||||||||||||||||||