PART 5
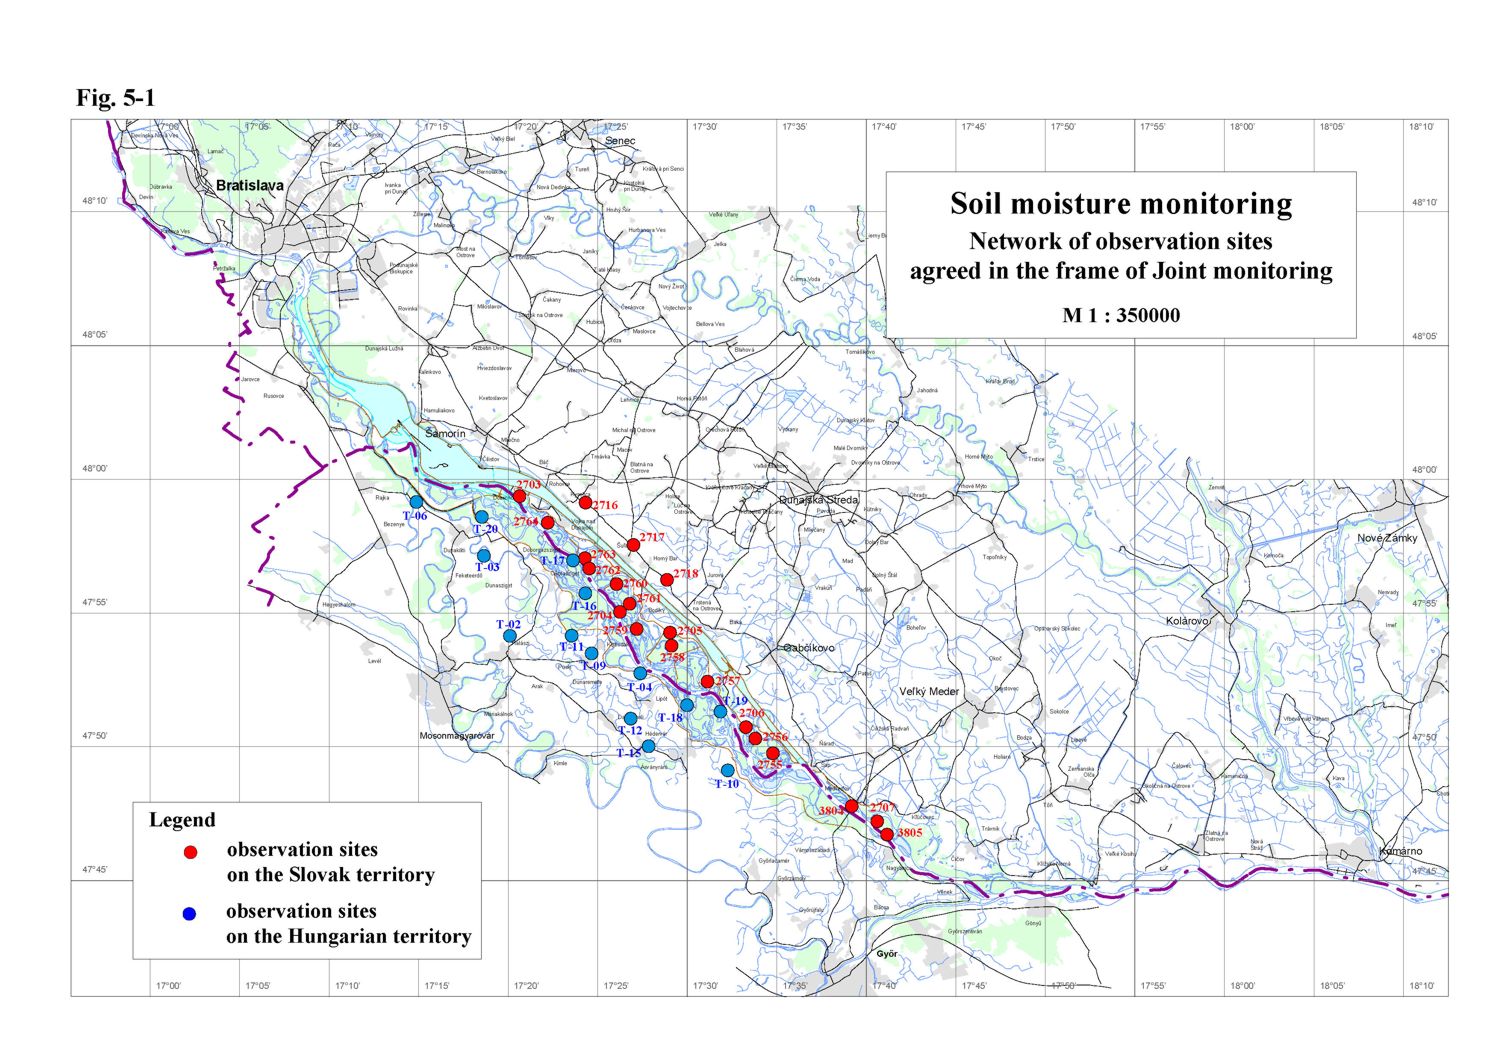
Soil Moisture Monitoring5.1. Data collection methodsThere were no changes in the soil moisture monitoring in the year 2010. The Slovak side measured the soil moisture by a neutron probe up to a prescribed depth or to the depth of the ground water level. The Hungarian side measures the soil moisture with a capacity probe to the depth of maximum 3 m. The soil moisture on both sides is expressed by total soil moisture content in volume percentage recorded in 10 cm depth intervals for each measurement during the year. Measurements on the Slovak side were performed on 20 monitoring areas (12 forest monitoring areas, 5 biological monitoring areas and 3 agricultural areas) – Table 5-1. Measurements on the Hungarian side were performed on 14 monitoring areas (6 forest monitoring areas and 8 agricultural areas) – Table 5-2. The situation of observation objects is displayed on Fig. 5-1. Table 5-1: List of monitoring stations on the Slovak side
Table 5-2: List of monitoring stations on the Hungarian side
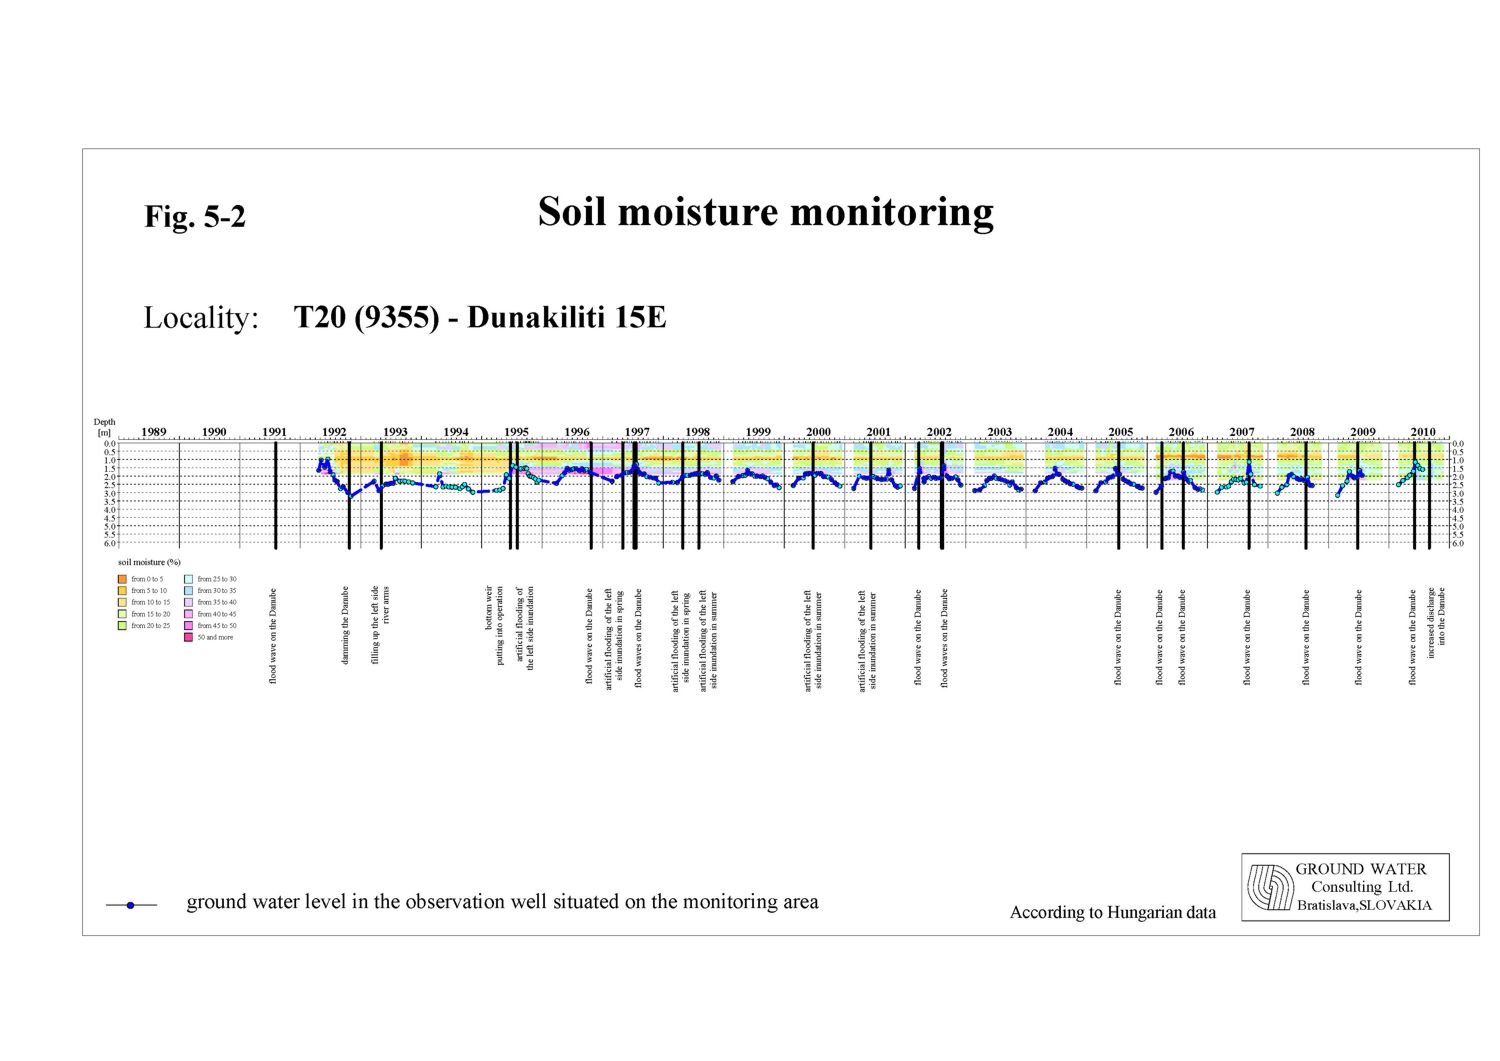
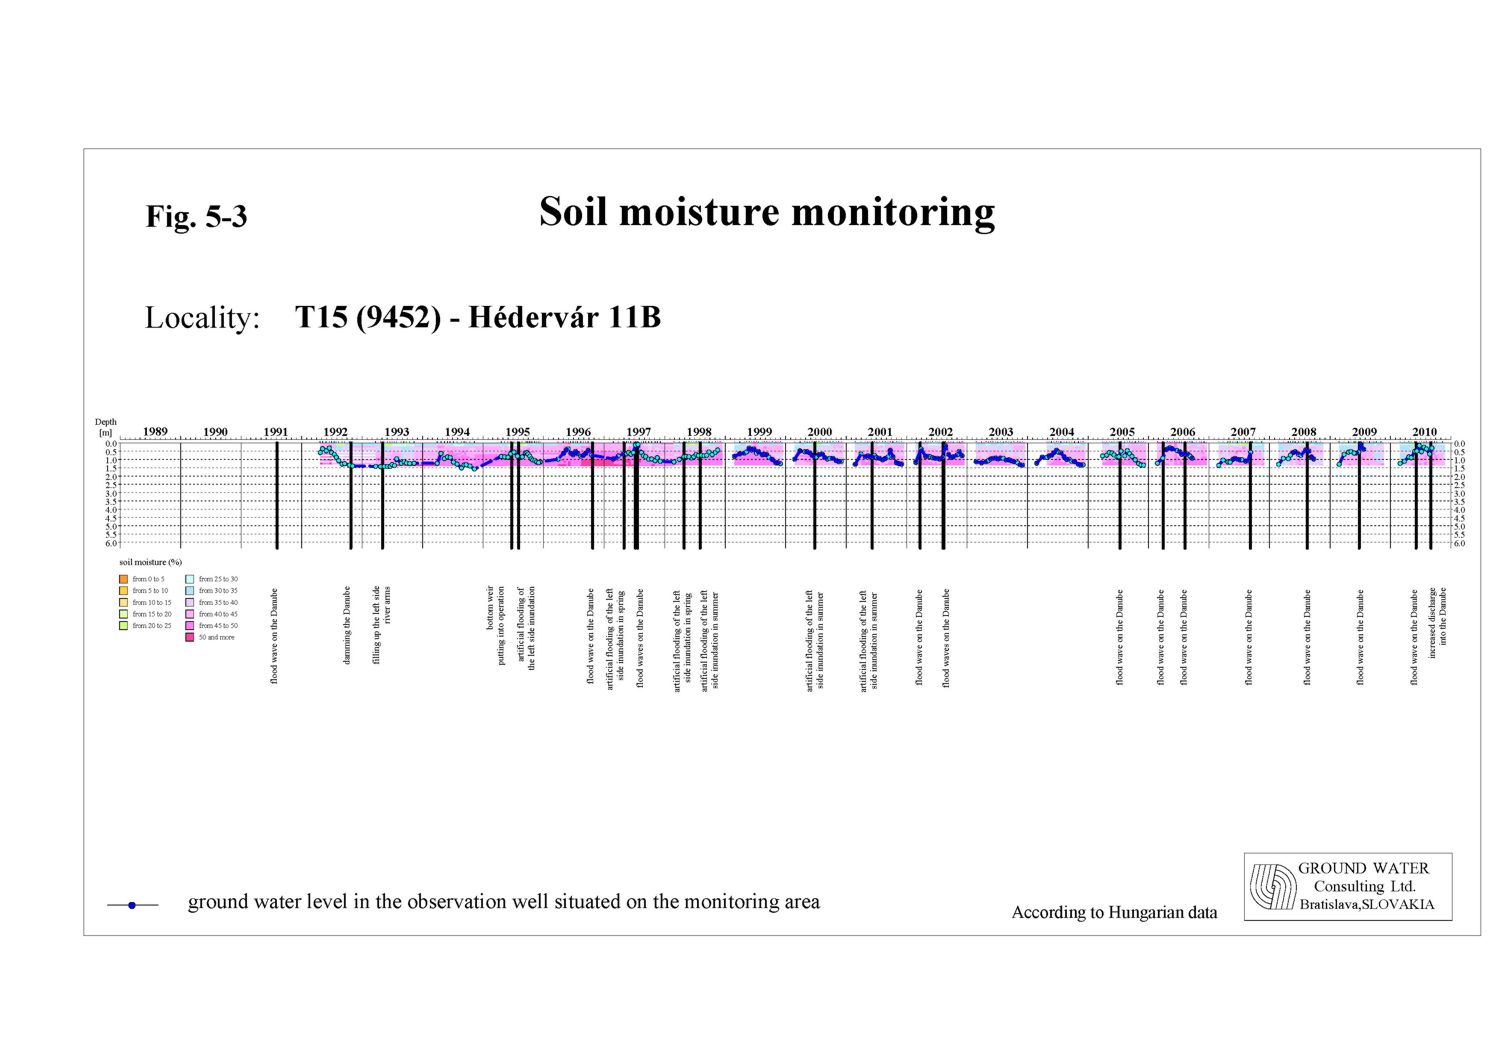
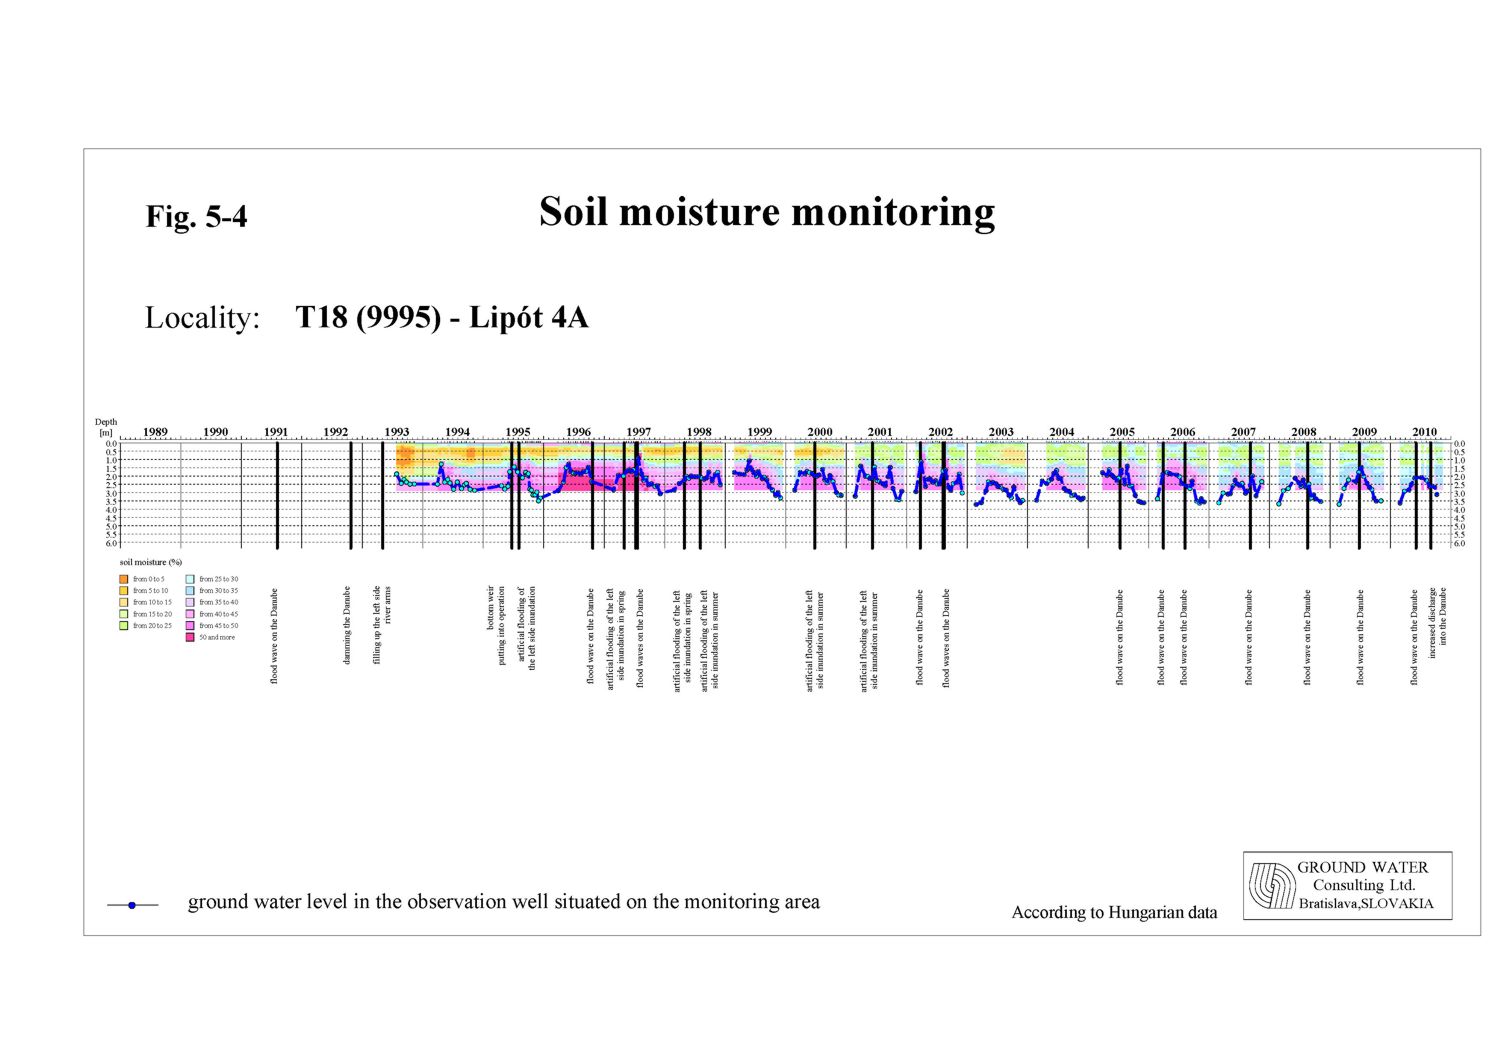
5.2. Data presentation methodsThe data presentation methods remained unchanged. The soil moisture is displayed in figures showing the average soil moisture content in volume percentage for the depth interval from 0 to 100 cm and from 110 to 200 cm. Slight difference is in the Hungarian data presentation, where the value for a depth interval under 110 cm can represent the average value from less than 10 measured values. On colour figures the soil moisture time distribution for the whole measured depth is presented at selected sampling sites. The graphical presentation of the whole set of measured data is given in the Slovak and Hungarian National Annual Reports. 5.3. Evaluation of results on the Hungarian sideDuring the year 2010 15-soil moisture measurements were performed on the Hungarian side. Measurements continued at forestry monitoring sites in the floodplain area and at agricultural monitoring sites in the flood-protected area. Three monitoring sites at forest stands were abandoned, and three new monitoring sites on agricultural area were introduced into the data exchange in 2008 (Fig. 5-1). The moisture conditions of soils are essentially influenced by the rainfall conditions, by the soil layer thickness and its composition, as well as by the ground water level position. The soil moisture content at the beginning of the vegetation period was slightly lower in comparison with the previous year. However, it increased significantly in the layers down to 1 m depth thanks to the precipitations amounts high above average, especially in the first half of April and in May. Huge precipitations occurred also from July to September, thus the soil moisture values were higher till end of the year in comparison with the previous year. The soil moisture values were slightly lower till the beginning of flood in June. During the flood significant part of the inundation area was flooded. After passing the flood the soil moisture values also reached higher values in comparison with the previous year. The highest soil moisture values were recorded after passing the flood wave, in the second half of June or at the beginning of July. The groundwater level reached similar levels as in the year 2009. Minimal values of soil moisture were registered either at the end of the winter period or at the end of the year. Generally it can be stated that the average soil moisture in 2010 was similar as in the previous year. The soil moisture on forestry monitoring sites In general, the soil moisture content at forestry monitoring areas was similar or slightly higher in comparison with the previous year. At the beginning of the vegetation period the soil moisture content reached similar or higher values than in the previous year. Minimal values in the layer to one-meter depth, depending on position of monitoring site, occurred at the beginning of the year (February-March – T16, T18, T19), at some places in August (T-17, T20) or at the end of the year (November – T15). The minimal values in the layer below one-meter depth occurred mostly at he beginning of the year (February and March). Maximal average soil moisture values in the both layers, up to one-meter depth and below one-meter depth occurred in June, just after passage the flood wave. The ground water level all over the year supplied the soil layers on monitoring site T15 (Fig. 5-3), on monitoring sites T16 and T18 it moisturized during increased discharges in the Danube in June, July, Augusta and September (Fig. 5-2, Fig. 5-4). Table 5-3: The minimal and maximal average soil moisture contents at forestry monitoring sites
The soil moisture on agricultural monitoring sites on the flood protected side The soil moisture contents at monitoring sites T02, T06 and T09 were mostly dependent on precipitation and weather condition. The ground water level influenced of the soil profile at monitoring site T10, T11 and partially at monitoring sites T02, T03, T04 and T12. The flood wave influenced the soil moisture content almost at all monitoring sites, when the highest soil moisture values were recorded as well, except the monitoring site T02. The minimal values of the soil moisture in the layer down to one-meter depth were recorded during summer months July and August. The minimal average values in the soil layers below 1 m depth occurred at the beginning of the year (February), except the monitoring area T09, where the minimal value was recorded in August. Generally, the soil moisture in the year 2010 had developed favourably. Monitoring sites T02, T10, T11 and T12 represent agricultural areas in the Middle and Lower Szigetköz. These monitoring sites have a thick covering layer and throughout the vegetation period the groundwater level moisturised the bottom part of soil layers. In the inundation area the groundwater moisturised the bottom part of soil layers at monitoring sites T15, T16, T18 and T20, the groundwater level periodically occurred in the layer between 1 and 2 m depth. The soil moisture at monitoring sites T04, T17 and T19 was supplied by groundwater only during the increased discharge in the Danube old riverbed. Table 5-4: The minimal and maximal average soil moisture contents at agricultural monitoring sites
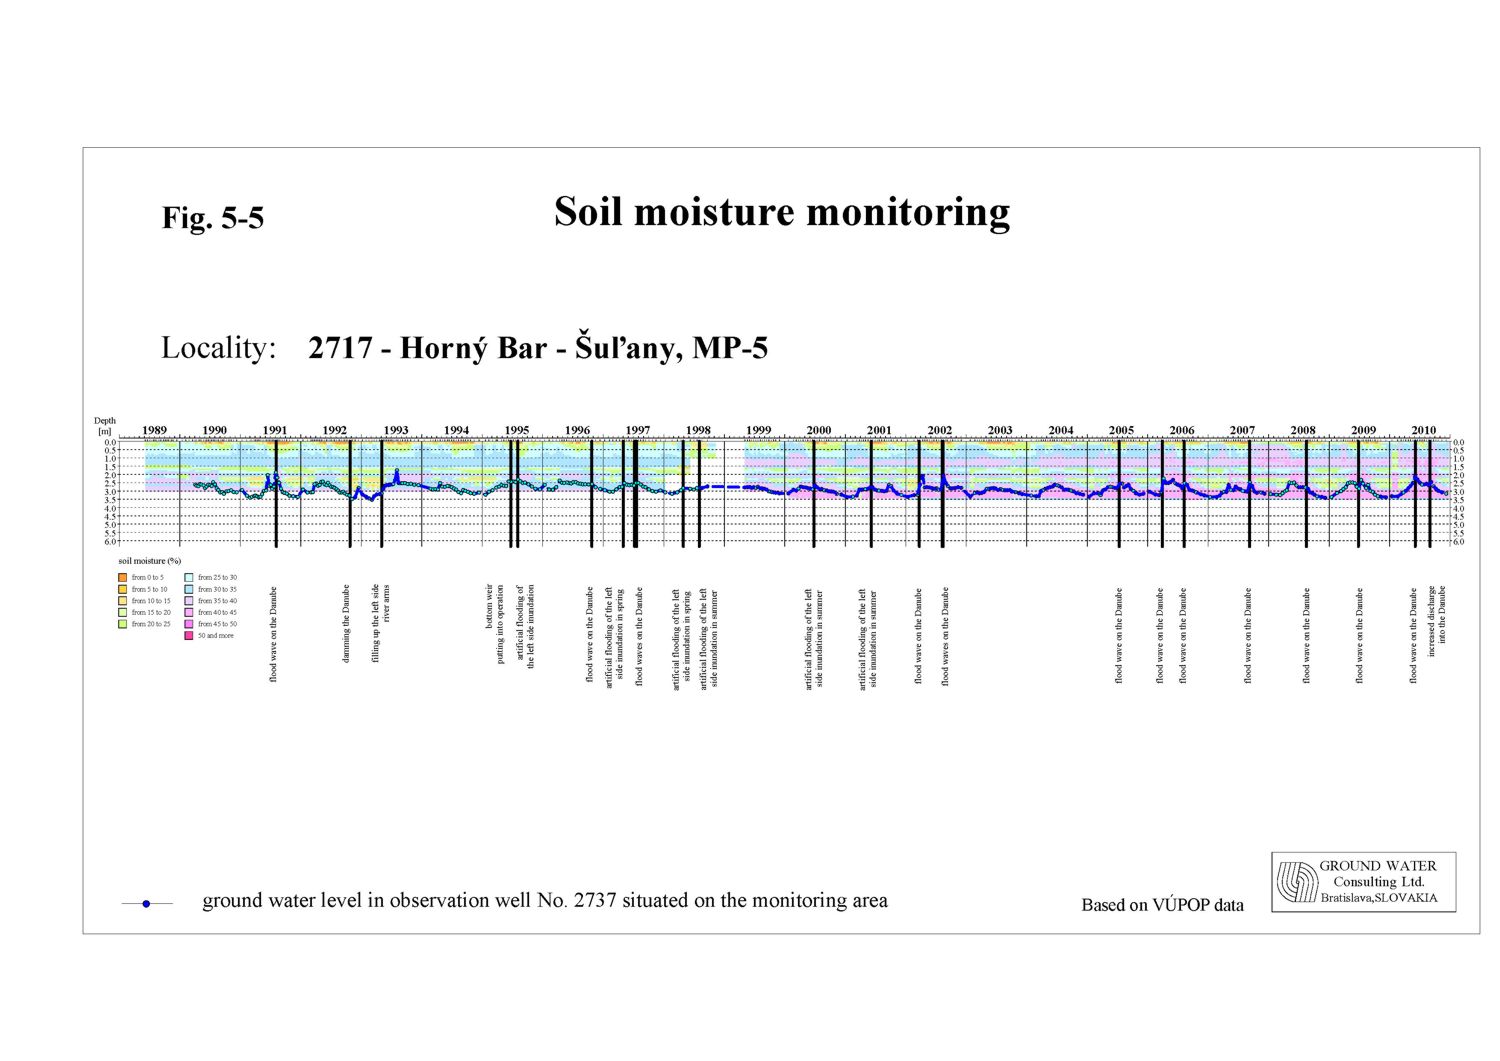
5.4. Evaluation of results on the Slovak sideMonitoring sites on the Slovak side are situated in the inundation area and flood-protected agricultural area (Fig. 5-1). The soil moisture at monitoring sites situated behind the derivation channel in the agricultural area (sites No. 2716, 2717, 2718) is stable during the whole observation period. Since the year 2004 slight increase in the soil moisture content can be observed, while the ground water level position and fluctuation remained unchanged (Fig. 5-5). In the year 2010 the ground water level at monitoring site No. 2716 fluctuated in depths of 2.5-4 m, at site No. 2717 in depths of 2.0-3.5 m and at site No. 2718 in depths of 1.5-2.7 m. The fluctuation of soil moisture content in the depth interval from 0 to 1 m entirely depends on climatic conditions. In the depth from 1 to 2 m, the soil moisture fluctuation is partly influenced by the ground water level, at monitoring area No. 2716 occasionally. The average soil moisture content in the depth up to 1 m in the year 2010 fluctuated in the range from 10 to 26 % at monitoring site No. 2716, in the range from 25 to 37 % at monitoring site No. 2717 and in the range from 31 to 38 % at monitoring site No. 2718. Comparing these values with the previous year it can be stated that the soil moisture content in 2010 was higher regarding the minimal and also the maximal values. The soil moisture content was supplied during the winter period and especially during rainfalls in April and May. The soil moisture content started to decrease significantly in the second half of June. The decrease was interrupted at the beginning of September (No. 2716). The minimal values occurred at the beginning of July and at the end of August. Maximal values were registered in January (No. 2716) and in June 2010, after passing the flood wave. In the depth between 1 and 2 m, the soil moisture content mainly varied from 17 to 24 % at monitoring site No. 2716, in the range from 23 to 40 % at monitoring site No. 2717 and in the range from 21 to 34 % at monitoring site No. 2718. The minimal values were recorded at the beginning and at the end of the year 2010. The maximal values were registered in June, after passing the flood wave. Since the beginning of September the soil moisture content gradually decreased, at monitoring site No. 2716 it decreased already since June. Table 5-5: The minimal and maximal average soil moisture contents at agricultural monitoring sites
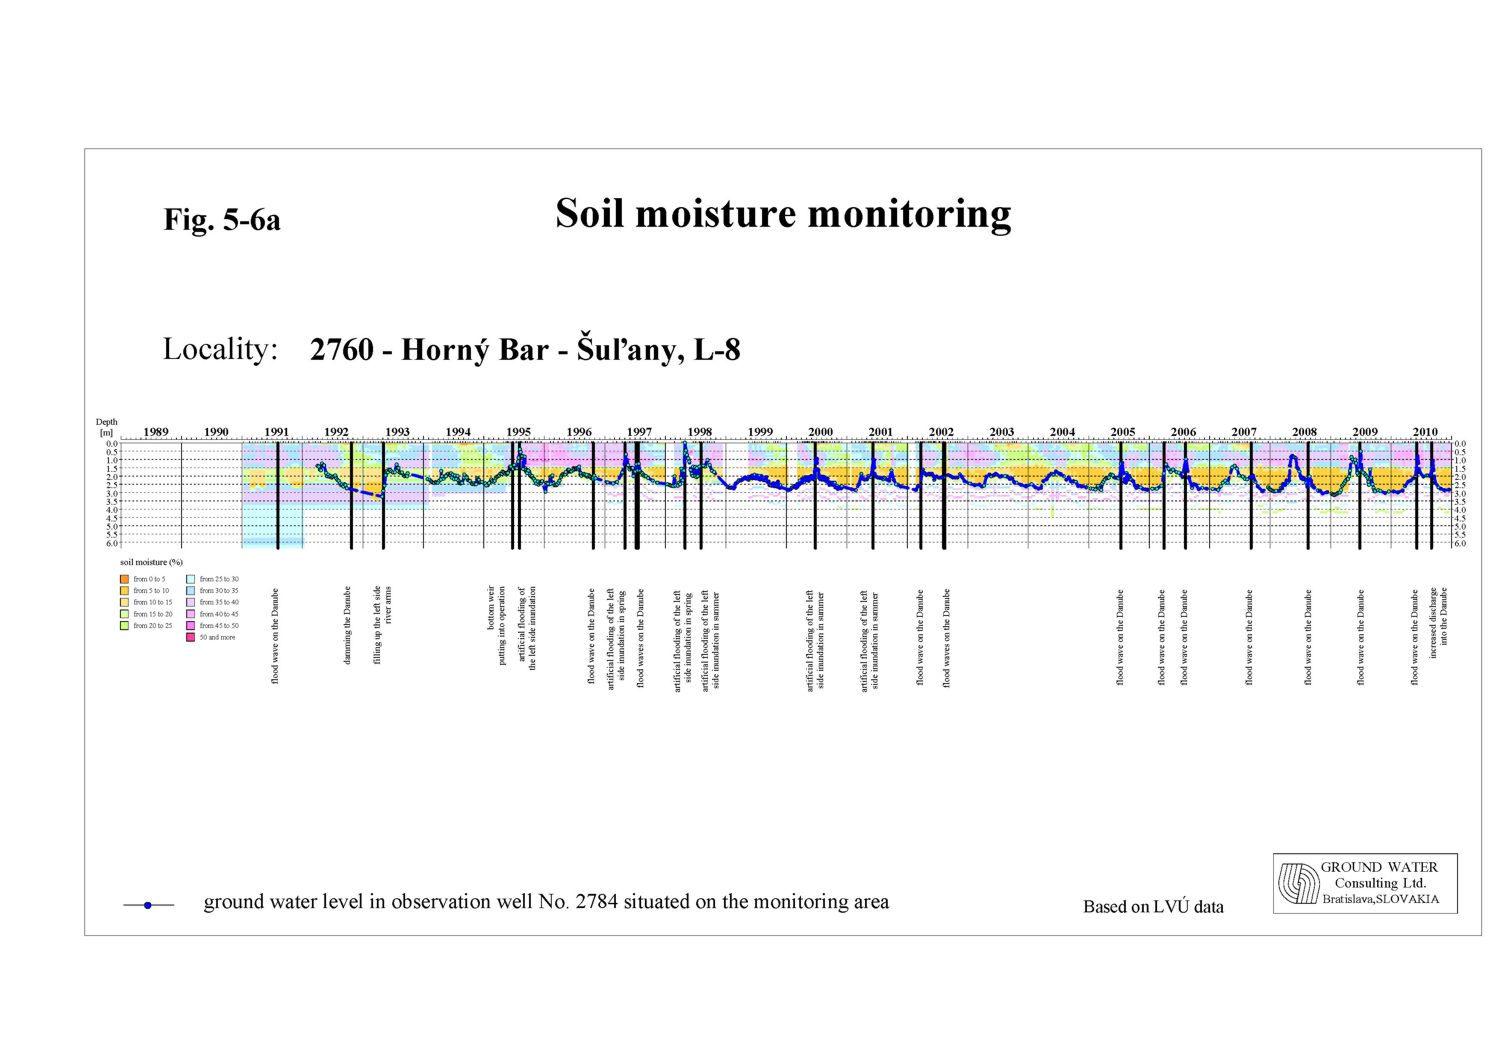
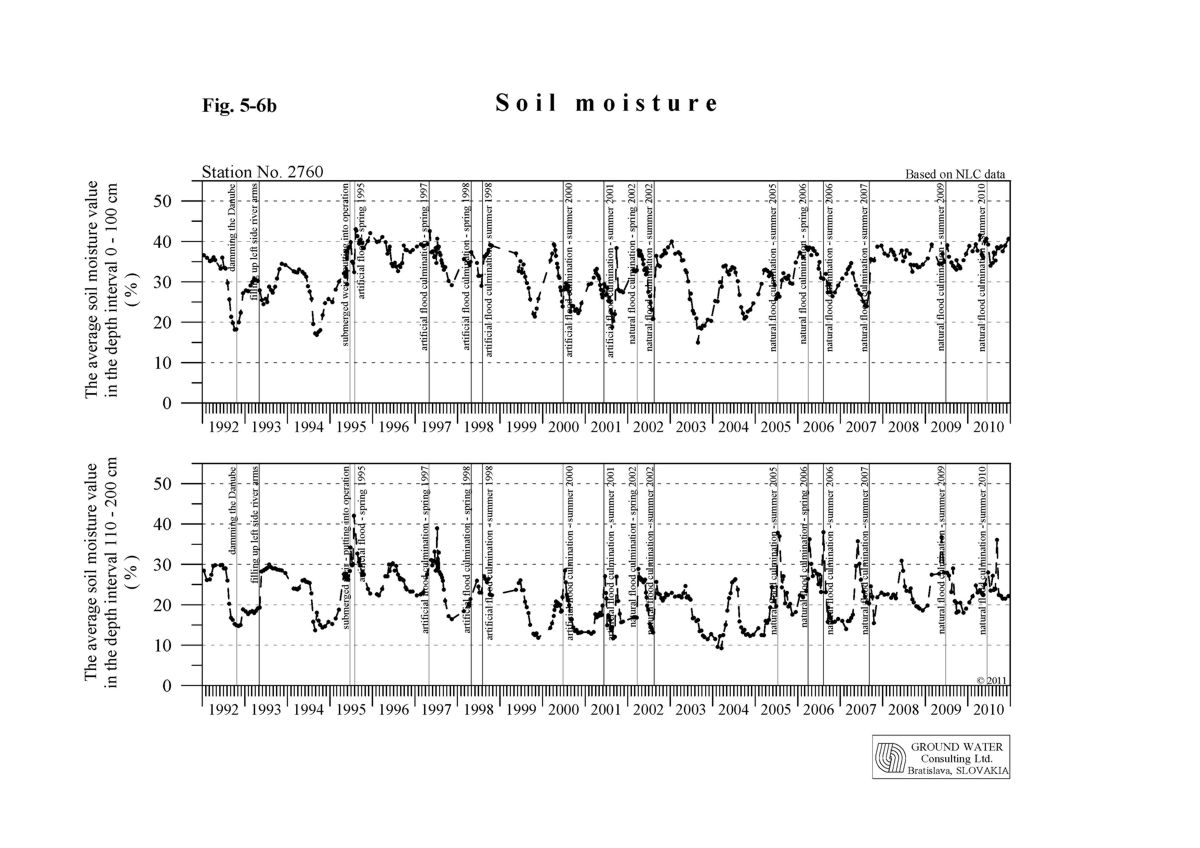
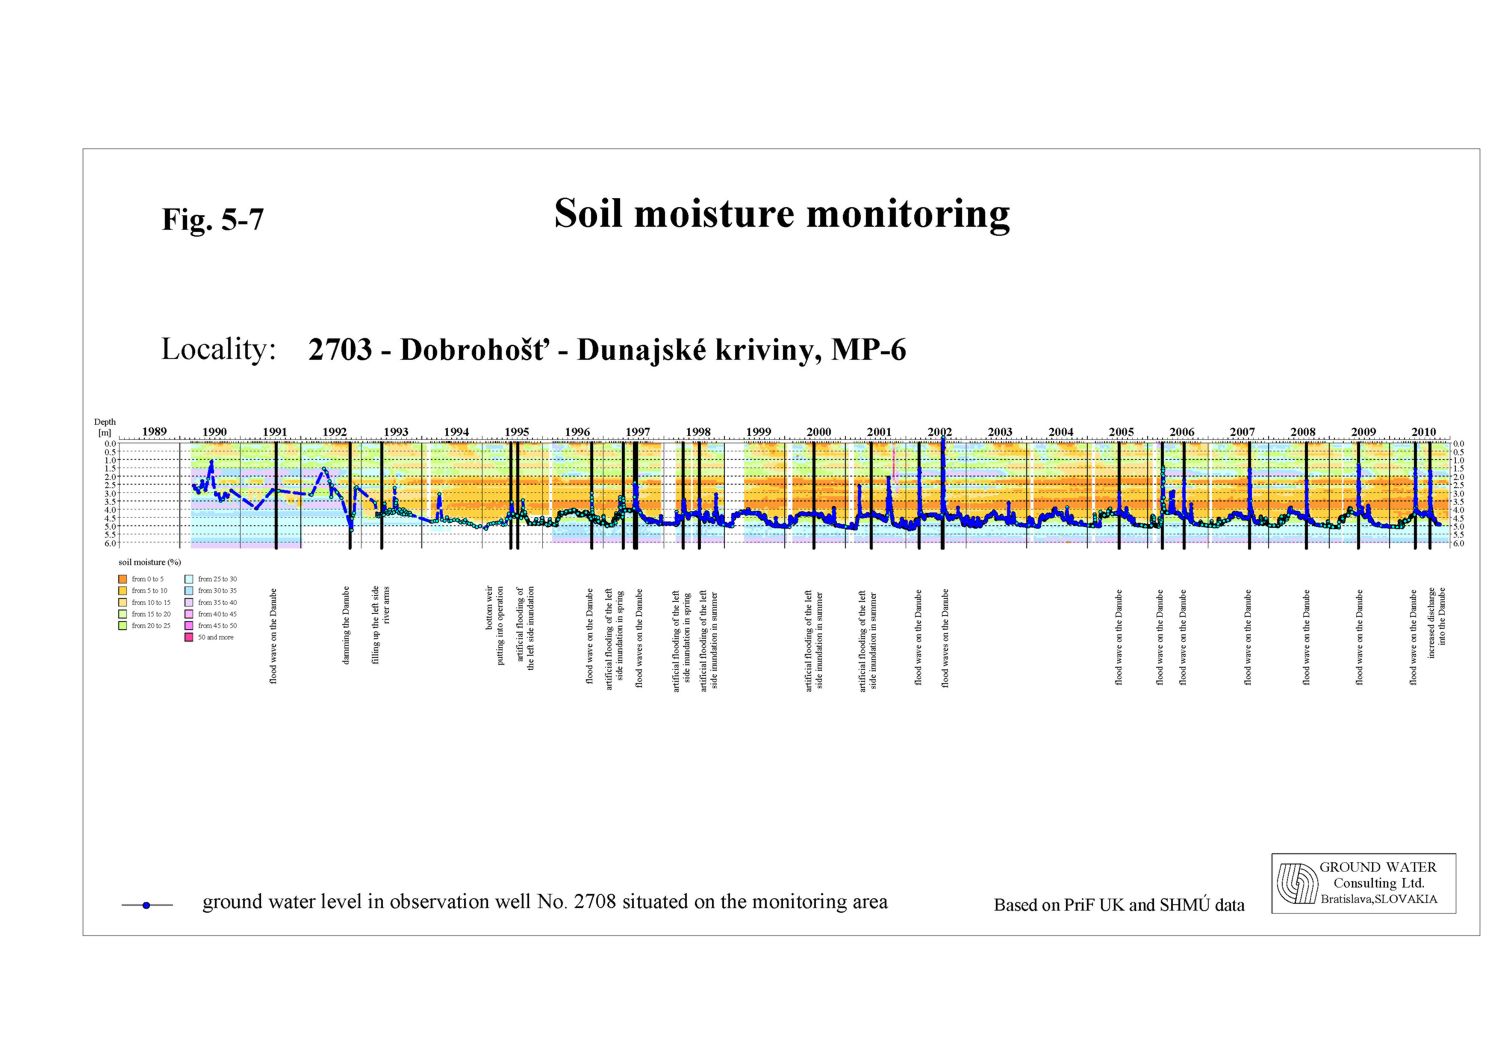
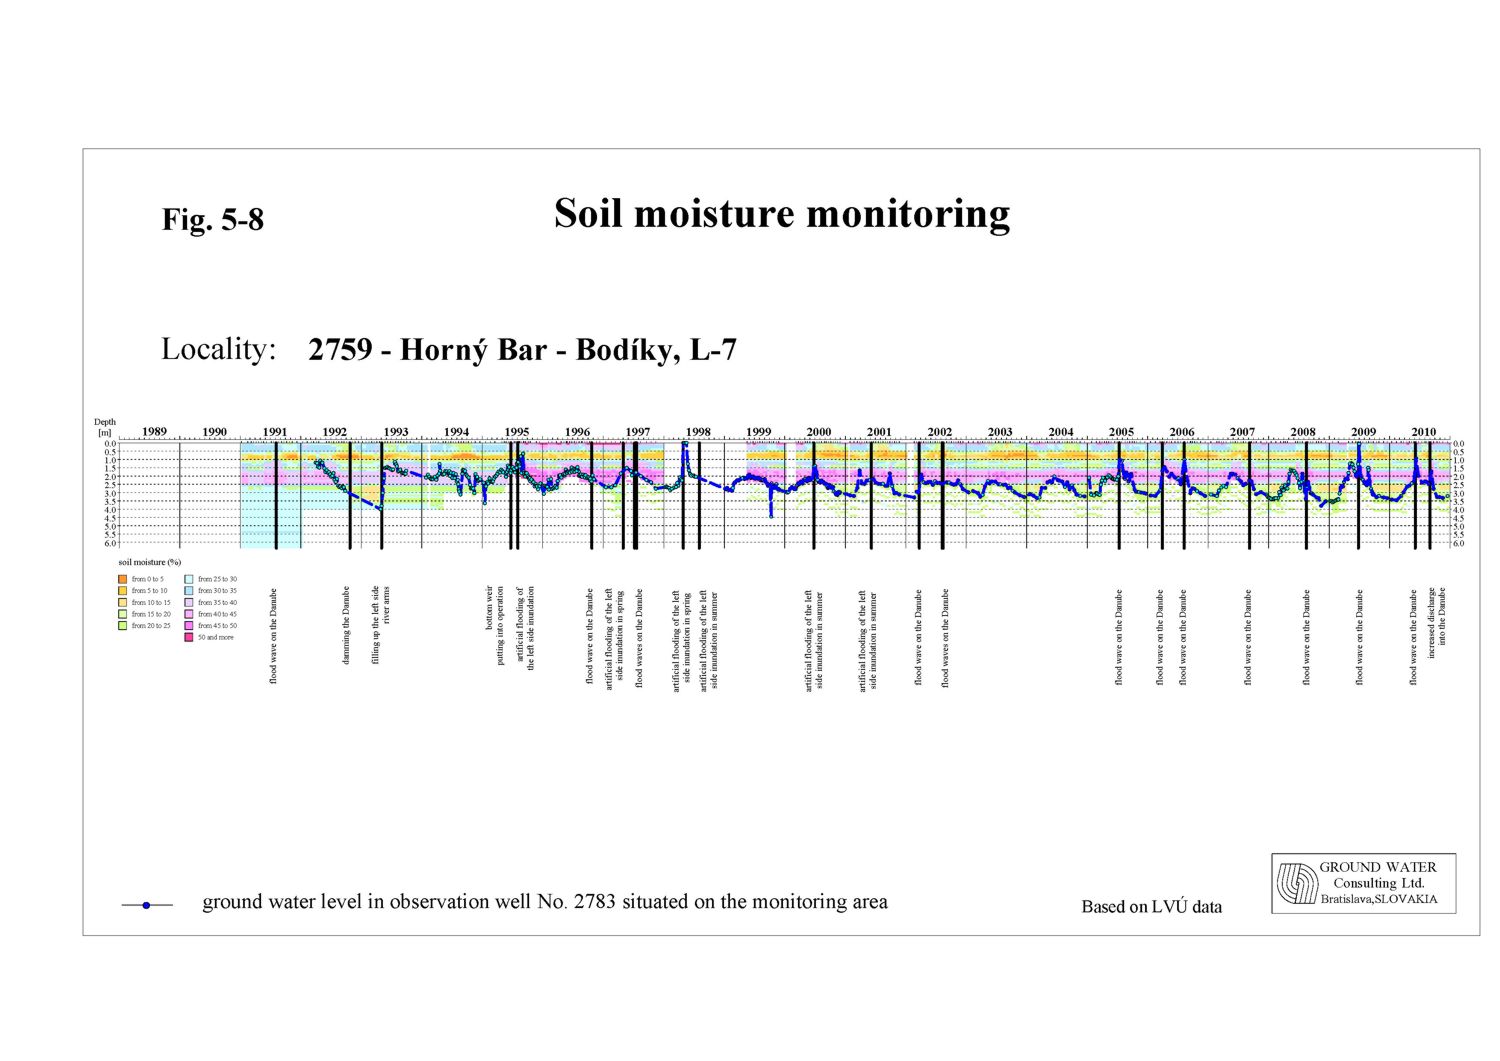
The soil moisture in the inundation area, along with the ground water level and precipitation, is highly dependent on natural or artificial floods. In the hydrological year 2010 natural flooding of inundation occurred in June. The highest flow rate reached 8071 m3s-1, which means that large part of inundation area was entirely flooded. The soil moisture content at the beginning of the year was rather low, especially in the layer below 1 m depth. Thanks to precipitation amount in January and in April and May, which were highly above average, the soil moisture content significantly increased. The lowest values in the layer down to 1 m depth were mostly recorded during summer months – July and August. The lowest values in the depth interval from 1 to 2 m were mostly registered at the end of the year, in October and November. However, in the upper part of the inundation area the lowest values were observed, similarly to the observations in the layer down to 1 m depth, in summer months. The maximal values on most of monitoring sites occurred after flooding in June, but on some in September, when the flow rate in the Danube old riverbed was increased again. The soil moisture content at the end of the year mostly reached higher values in comparison with the starting content at the beginning of the year. Concerning the minimal and the maximal values it can be generally stated that minimal values were higher than in the previous year. The maximal values were higher on a part of monitoring areas, while they were lower on others, in comparison to the previous year. The thickness of soil profile at monitoring sites No. 2703, 2764, 2763, 2762 and 2761 in the upper part of the inundation area is low, similarly to the Hungarian side. The ground water level at these places fluctuates only in the gravel layer. In 2010 the ground water level on area No. 2703 fluctuated from 1.5 to 5 m, on areas No. 2764, 2763, 2762 and 2761 changed from 0.8-4.8 m. Layers to 1 m depth were strongly dependent on climatic conditions, however the flood wave in the Danube in June had a great influence on groundwater level and the soil moisture content (Fig. 5-7). Layers below 1 m depth were also strongly influenced by the ground water at the time of increased discharge into the Danube old riverbed in September. Maximal average soil moisture contents occurred after flooding the area in June and at the beginning of September. Minimal values occurred at the beginning of the year (January). The thickness of the soil profile in the middle part of the inundation area is higher. In general the ground water regime in this region is influenced by the water supply of the river branch system, introduced in May 1993. Moreover, the natural or artificial floods have significant influence on the ground water level. The ground water level in 2010 fluctuated above the boundary between the soil profile and gravel layers - monitoring sites No. 2704, 2705, 2758, 2759, 2760 (Fig. 5-6a, Fig. 5-6b, Fig. 5-8) and supplied the soils with water in the vegetation period. The maximal values of average soil moisture content in the layer down to 1 m depth were reached in June 2010, minimal values occurred mostly in summer months – July and August, on area No. 2704 in November 2010. In the layer below 1 m depth the maximal values occurred in June or in September; the minimal values at the end of the year 2010 (October, November). Table 5-6: The minimal and maximal average soil moisture contents at forestry monitoring sites
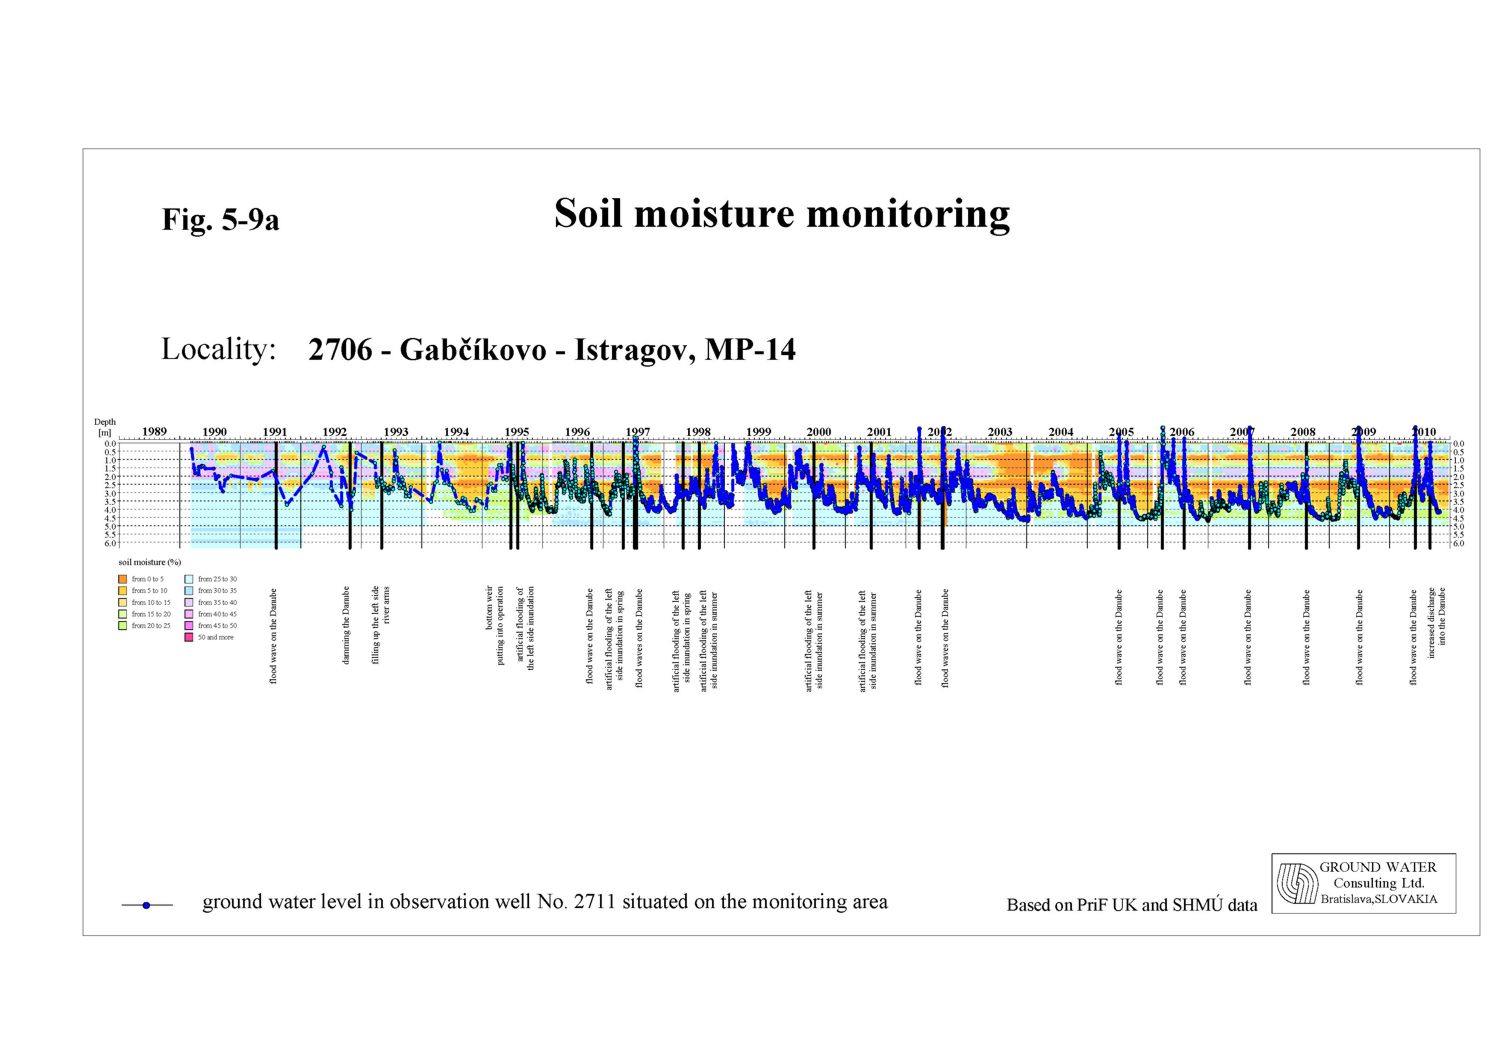
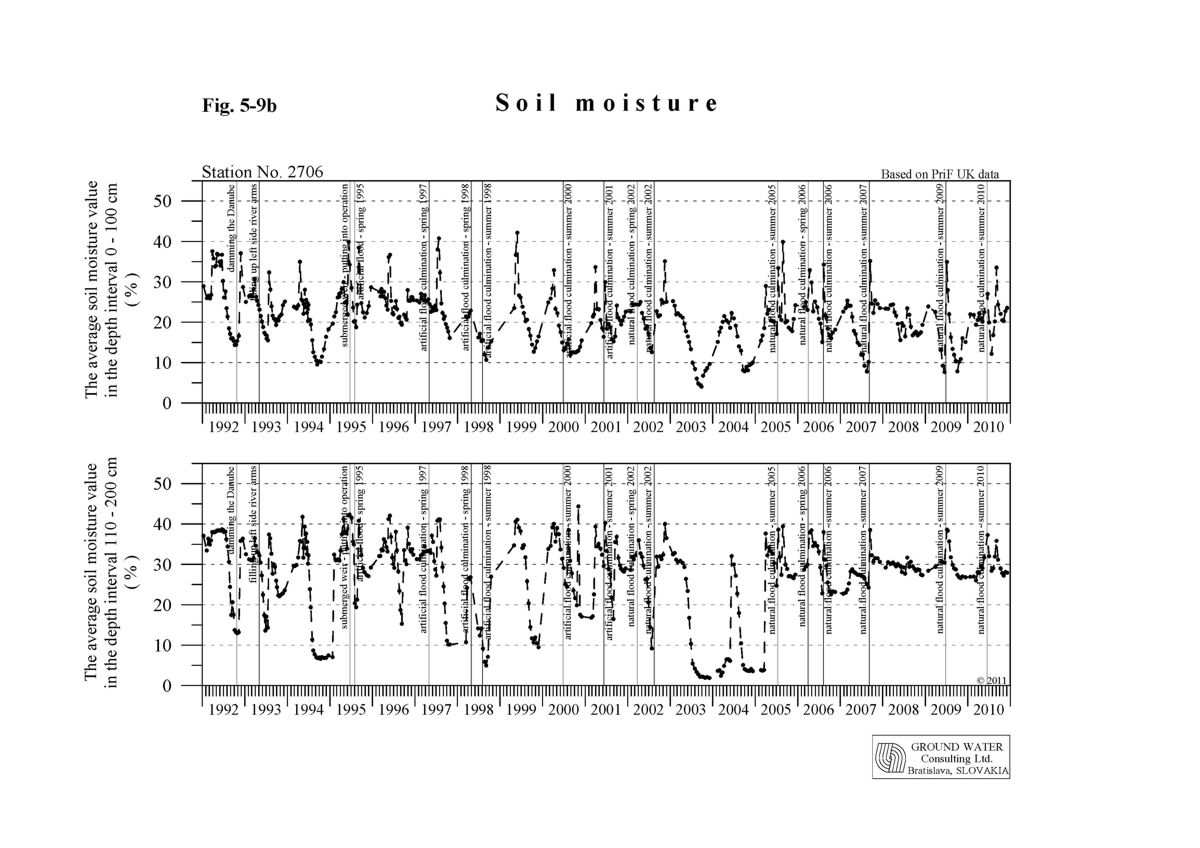
In the lower part of inundation area, downstream of confluence of the river branch system and the Danube (monitoring sites No. 2706, 2756, 2755), the ground water level usually fluctuates around the boundary between the soil profile and gravel layer. Since the discharges in the Danube in 2010 were rather high the groundwater level moisturised the soil profile. Monitoring sites were flooded at the beginning of June and also at the turn of August and September. Due to riverbed erosion the ground water level fluctuated in the depth between 0 and 4.5 m. The soil moisture in the upper layer in 2010 was mostly dependent on precipitation. Significant refill occurred in April and May. After the flooding in September the soil moisture decreased significantly. At the end of the year it increased again as a response to the higher flow rate in the Danube. The minimum and maximum values were related to the minimum and maximum ground water levels respectively. Minimal average values of soil moisture in layers up to 1 m depth occurred during summer months – July and August, in the layer below 1 m depth at the beginning of the year. The maximal average values of soil moisture were reached after the flood wave in June and after the discharge wave at the turn of August and September (Fig. 5-9a,Fig. 5-9b). The soil moisture contents at monitoring sites No. 2707, 3804, 3805, that are located in the inundation below the confluence of the tailrace canal and the Danube old riverbed, are highly influenced by the flow rate regime in the Danube. The maximum values in 2010, in the depths up to 1 m and between 1 and 2 m, occurred in June and September, while the minimum values occurred at the beginning of the year. The ground water level at monitoring sites No. 2707, 3804 and 3805 fluctuated in the depth 0-3.2 m. The riverbed erosion negatively influences these monitoring areas. During low flow rates the ground water level does not supply the soil profiles sufficiently.
|
|||||||||||||||||||||||||||||||||||||||||||||||||||||||||||||||||||||||||||||||||||||||||||||||||||||||||||||||||||||||||||||||||||||||||||||||||||||||||||||||||||||||||||||||||||||||||||||||||||||||||||||||||||||||||||||||||||||||||||||||||||||||||||||||||||||||||||||||||||||||||||||||||||||||||||||||||||||||||||||||||||||||||||||||||||||||||||||||||||||||||||||||||||||||||||||||||||||||||||||||||||||