PART 2
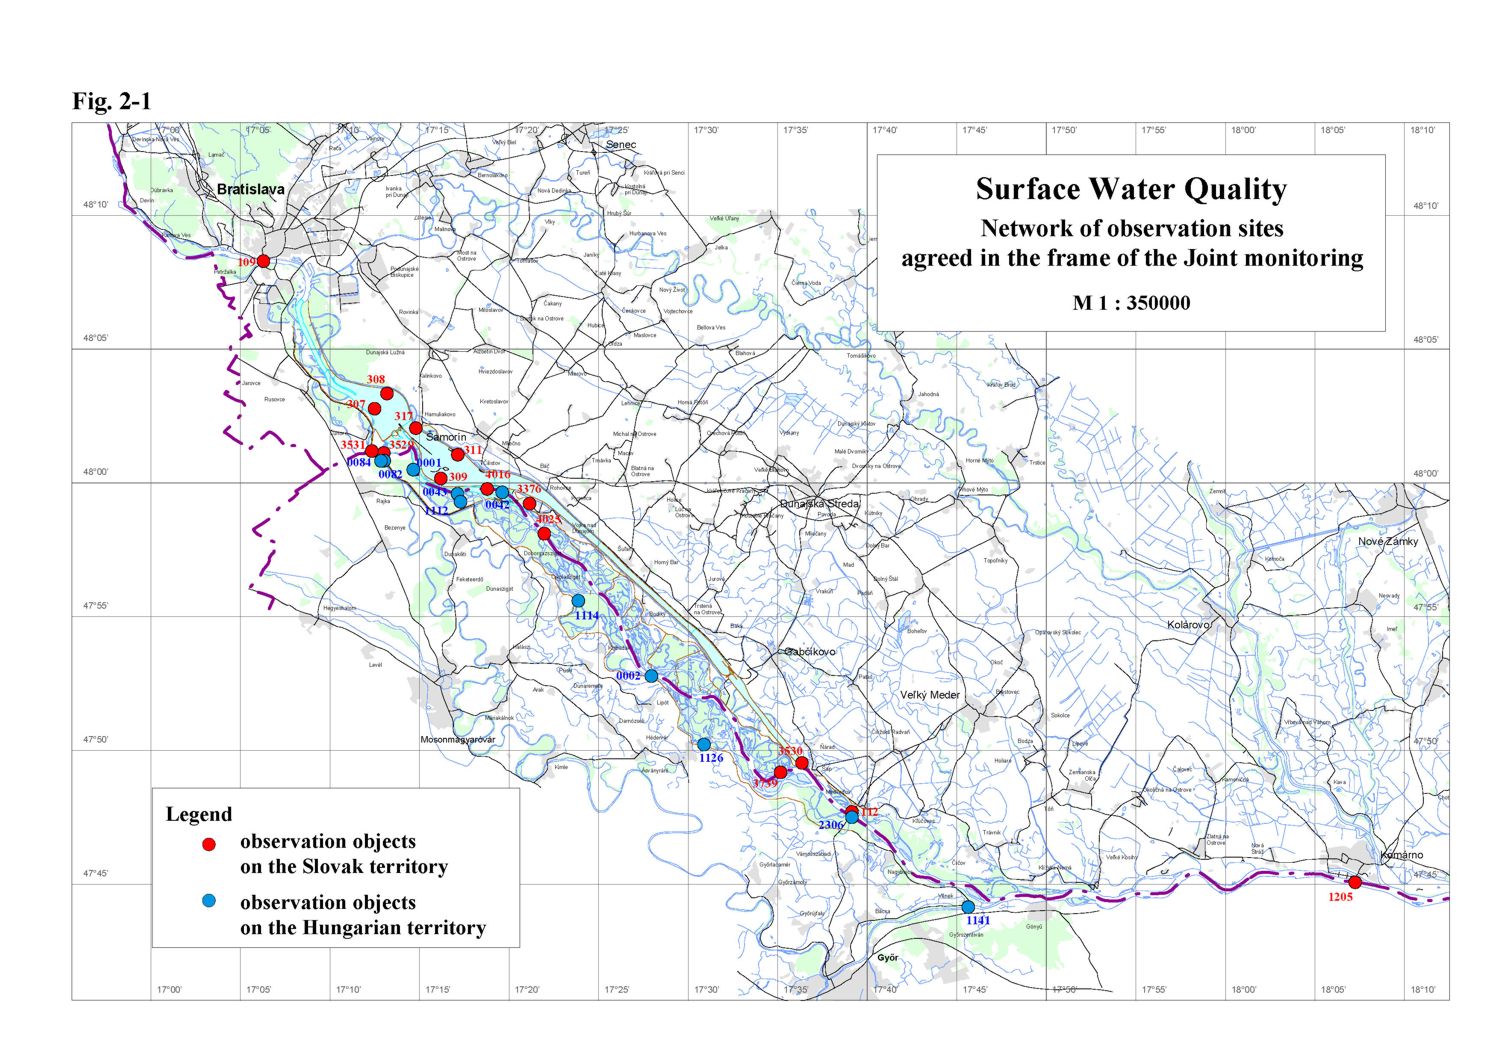
Surface Water QualityThe surface water quality measurements in the year 2010, in accordance with the Agreement, were carried out at 15 monitoring sites on Slovak territory and at 11 monitoring sites on Hungarian territory – Table 2-1, Fig. 2-1. At all monitoring sites the influence of measures, described in the Agreement, on surface water quality was observed. The main factors that could influence the water quality, are: the backwater effect upstream of the submerged weir, increased discharges into the Danube downstream of Čunovo dam and into the Mosoni branch of the Danube, the water supply into the right side river arm system, and morphological changes in the riverbed. Table 2-1: List of monitoring sites
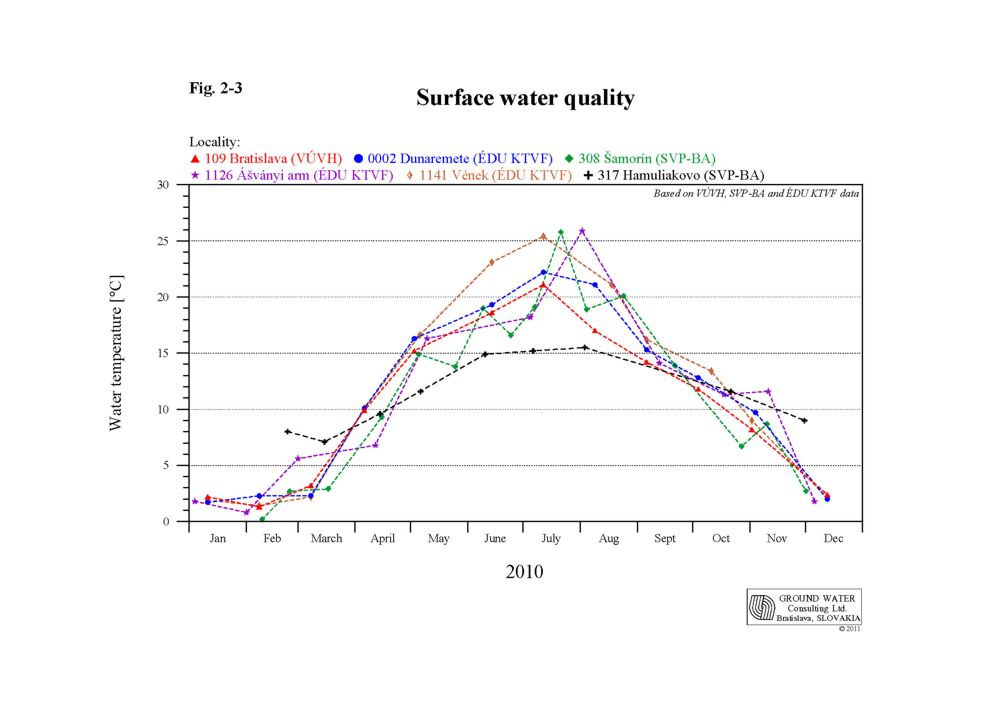
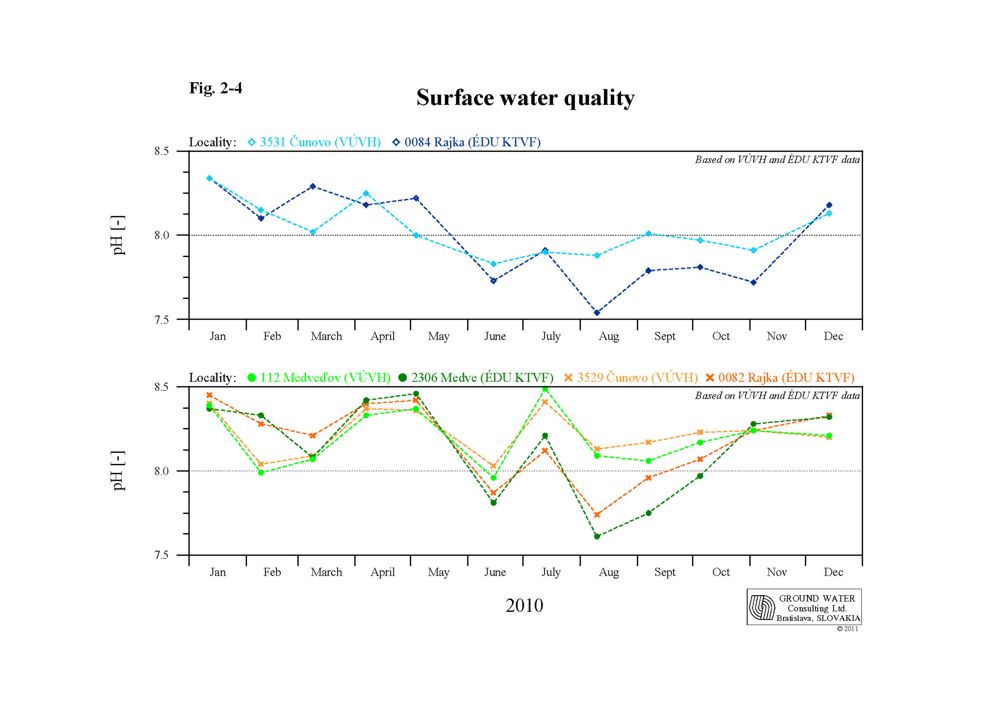
* - jointly observed monitoring sites Surface water quality and sediment quality data for the agreed monitoring sites, and time series diagrams of individual surface water quality parameters, are given in the Slovak and Hungarian National Reports on the Environment Monitoring in 2010 or in their Annexes. Figures in the Joint Report represent the data of selected parameters at selected monitoring sites. The data at jointly observed sites were not harmonized in 2010, so the national data were taken into account. The sampling site No. 1205 – Komárno was not observed in 2010. Table 2-2: Agreed limits for surface water quality classification
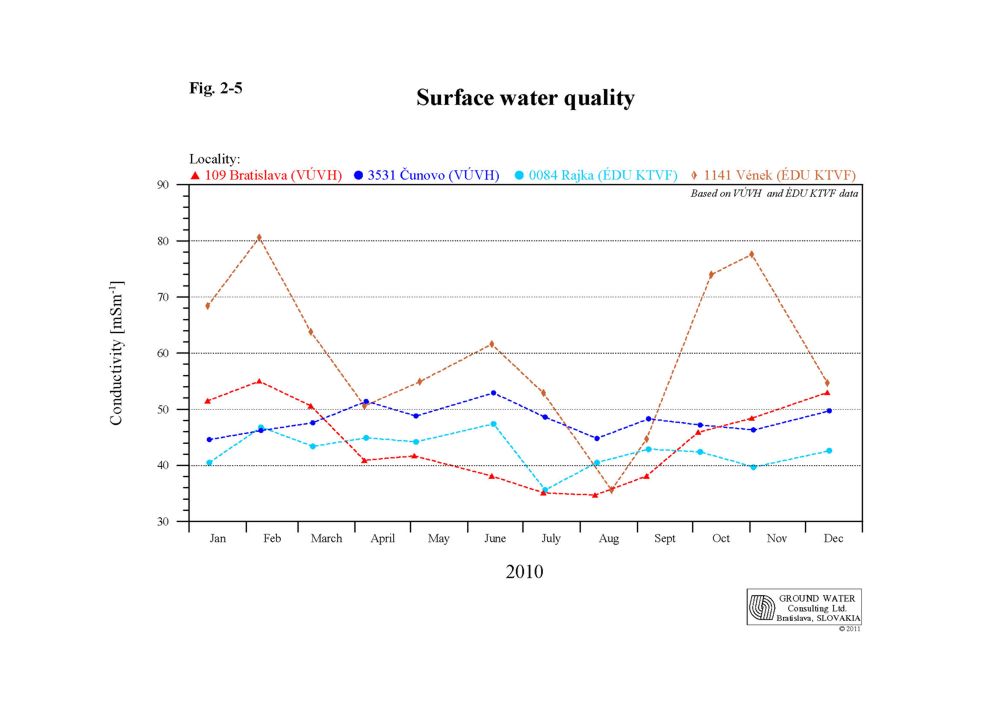
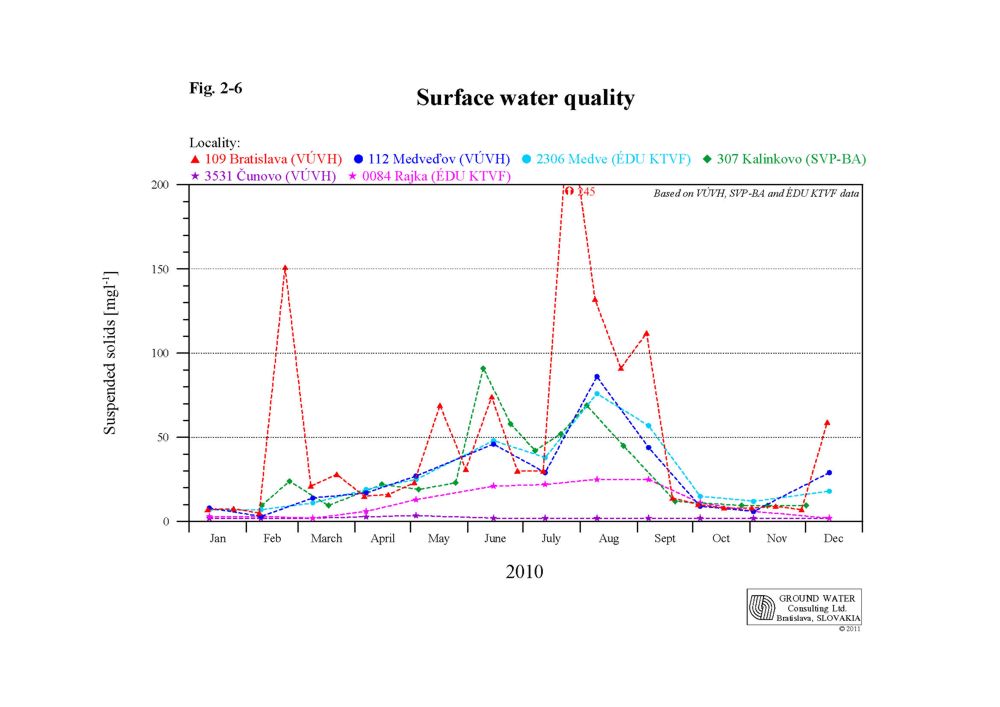
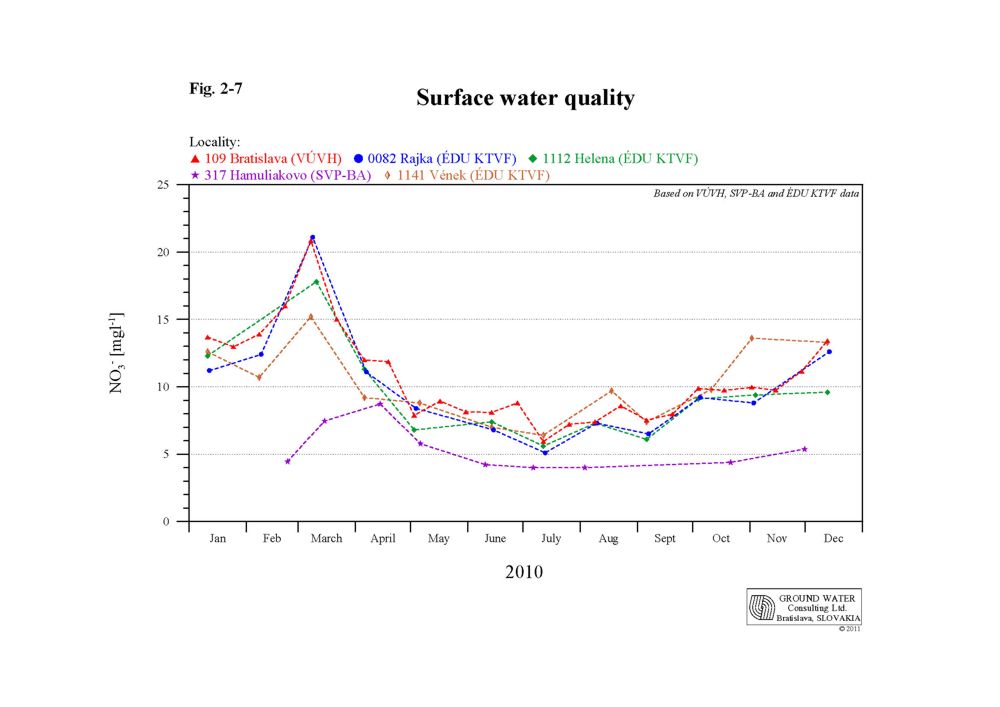
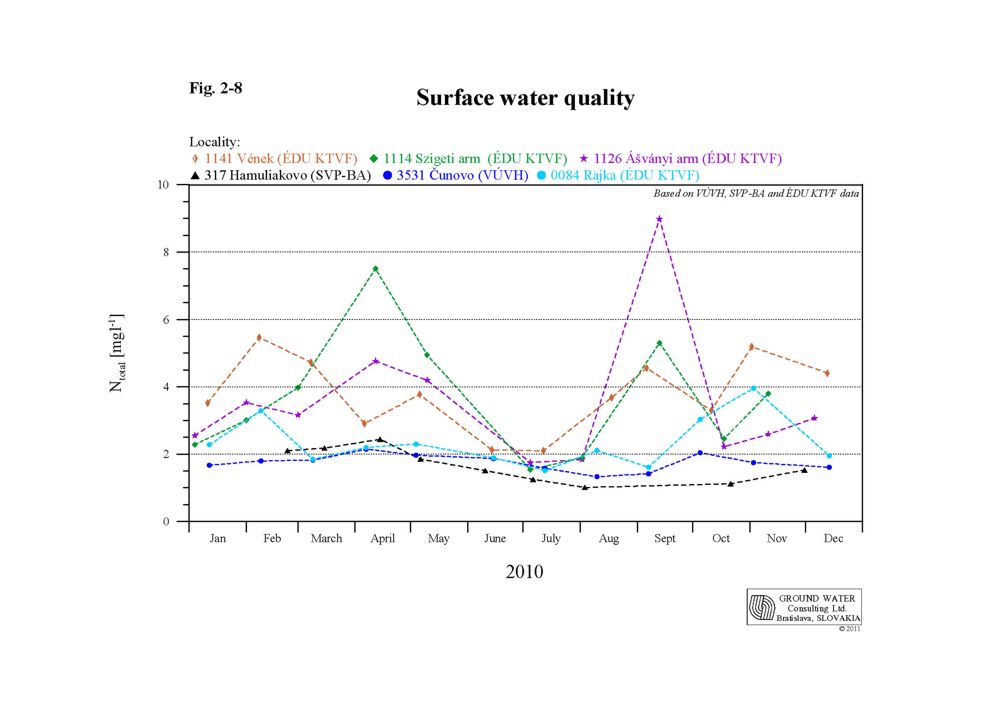
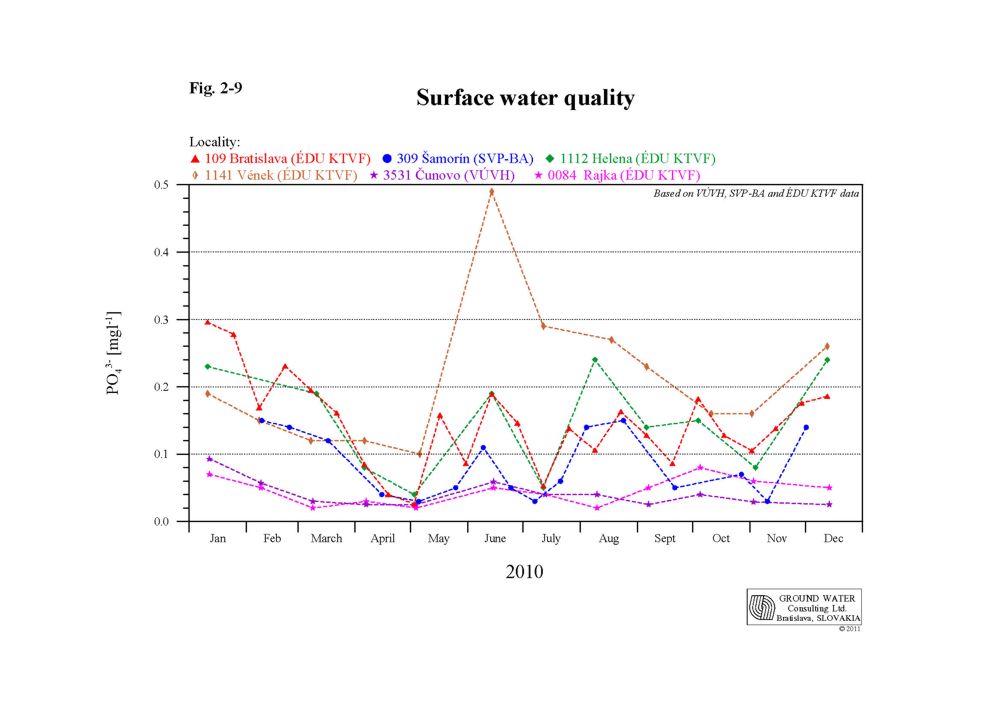
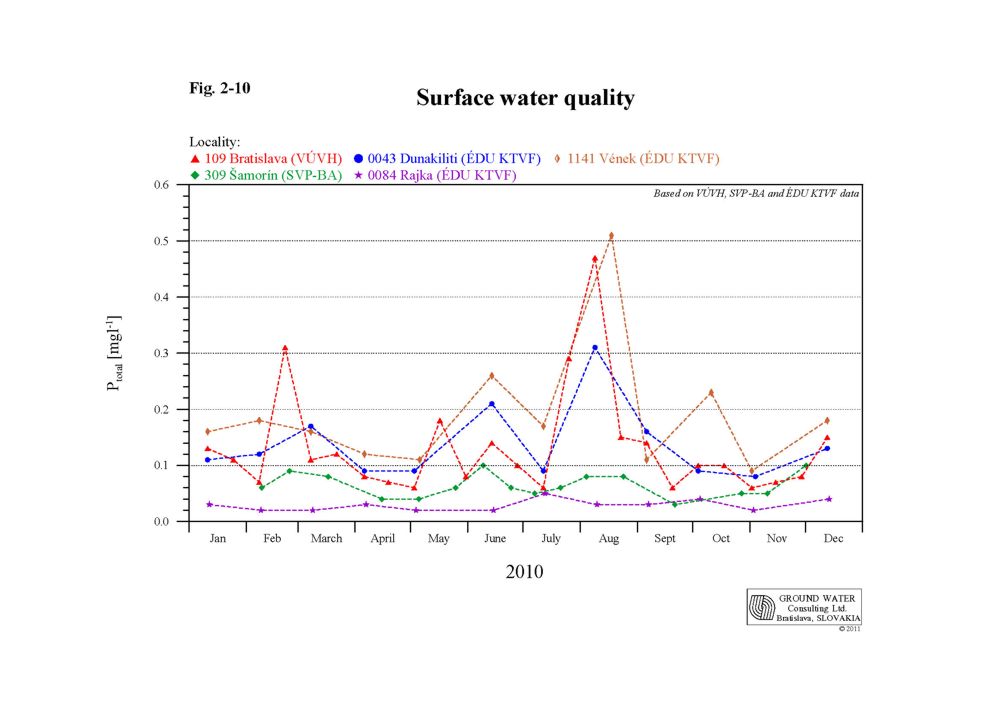
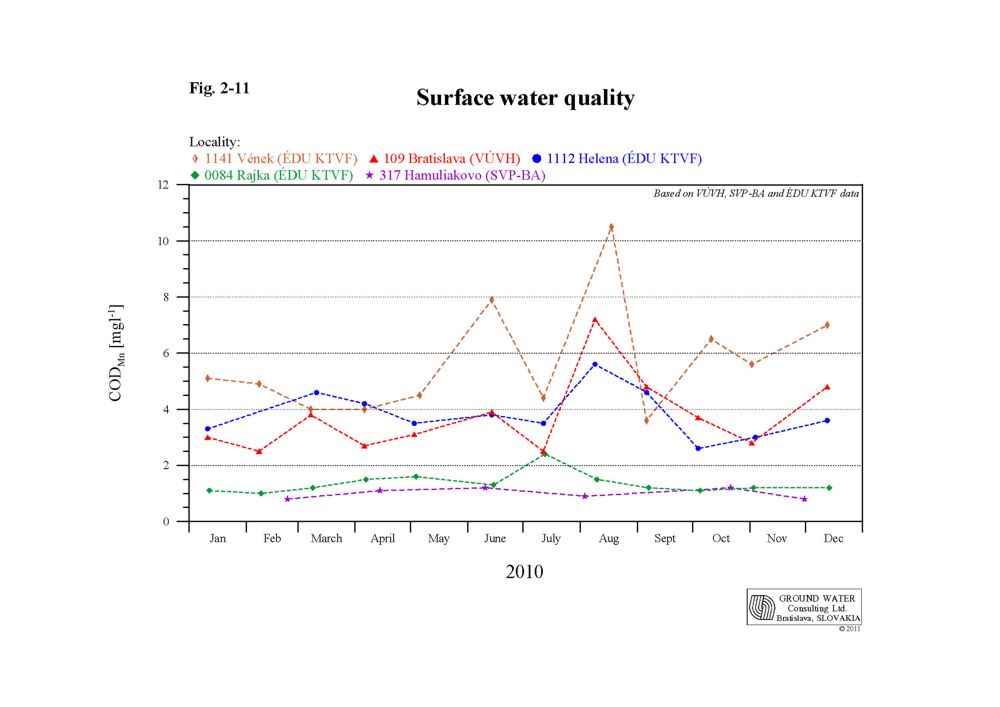
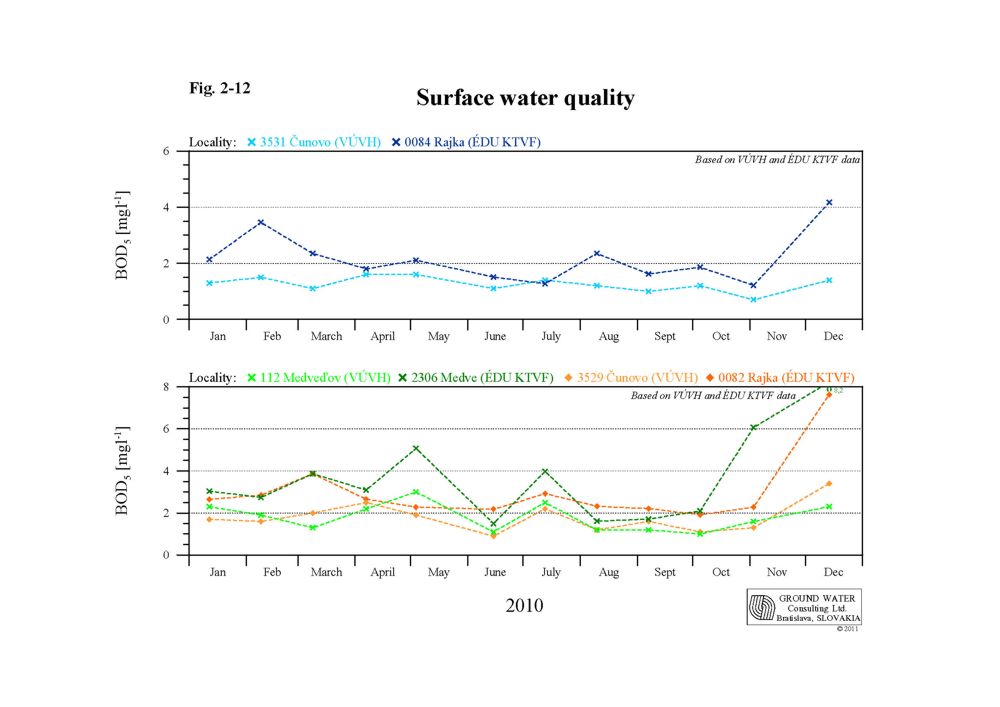
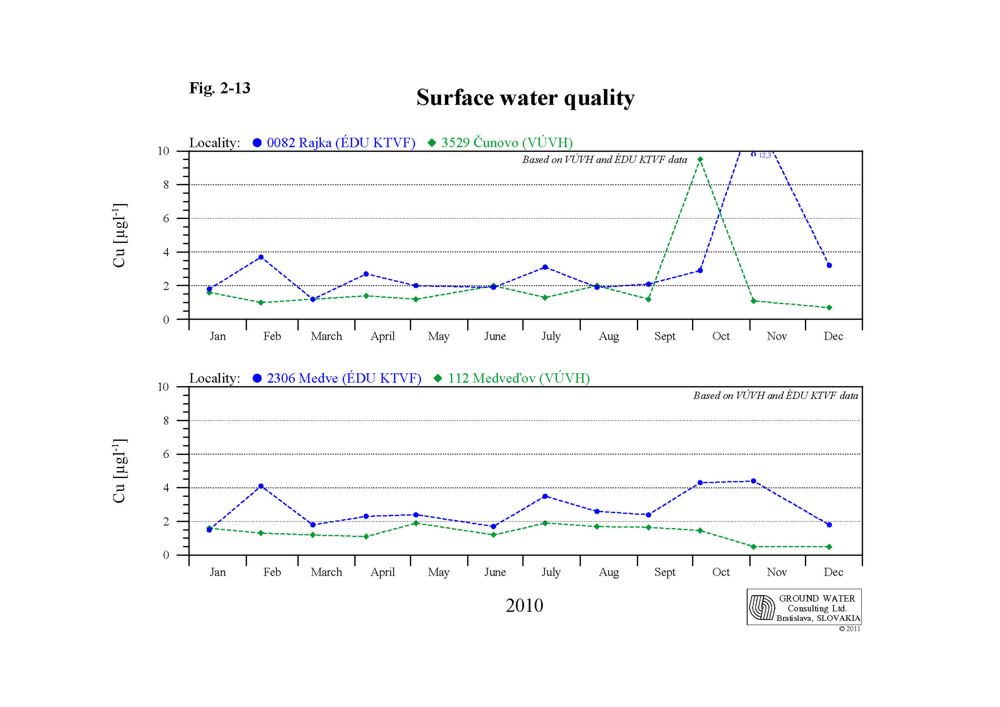
Surface water quality monitoring results at selected sampling sites at the end of this chapter were evaluated according to the agreed limits given in Table 2-2. These limits have been transposed from the “Surface water quality observation directive for Slovak-Hungarian boundary waters and for extended water quality monitoring on the Danube”, approved by the Slovak-Hungarian Trans-boundary Water Commission at its LXV. meeting. At the meeting of Monitoring Agents (April 2007 in Győr) it was agreed that the joint evaluation of exchanged data will cover one calendar year, and that the monitoring of hydro-biological quality elements will be carried out in accordance with the methodology agreed in the frame of Transboundary Water Commission. The Hungarian Party in its National Annual Report for the year 2010 carried out the evaluation in two ways. On the one hand it considered the system of limit values with five classes (Table 2-2). On the other hand it assessed the ecological status of surface waters under the Water Framework Directive according to the national methodologies and quality schemes, which are briefly described in the Hungarian National Annual Report for the year 2010. 2.1. General evaluation of the actual yearThe year 2010 from the water richness point of view belonged to average water rich years. Low flow rates occurred in the winter period, increased flow rates during the spring and at the beginning of the summer a flood wave occurred, due to precipitation amounts above average in the German and Austrian Danube catchment area, culminating on June 5, 2010, when the flow rate at Devín reached 8071 m3.s-1. During the summer another three discharge waves occurred (at the end of July, at the beginning of August and at the beginning of September), when the daily average discharge ranged above 4000 m3.s-1. Due to the rich rainfall since mid July till the end of September the flow rate in the Danube ranged above the long-term average values. Only in October the flow rate dropped to a level typical for this period. The air temperatures till the end of July ranged mostly above the long-term daily average temperatures. Significant warming occurred in late February, March, April and in the first half of June and July. These warmings alternated with temperature drop as a consequence of precipitation, being often above the average. The temperatures in the second half of summer ranged about the long-term average values due to rainy period. Approximately since mid September till end of the year the temperature fluctuated slightly below the average values. The above-mentioned hydrological and climatic conditions affected the surface water quality in the evaluated year. 2.2. Basic physical and chemical parametersWater temperature The water temperature fluctuation in the evaluated year 2010 was similar at the individual sampling sites. Its course showed seasonal character. The maximal temperature values during the summer exceed the maximal values from previous year. Exceptions were the seepage canals, where the maximal temperature values were lower comparing to the year 2009. At particular sampling sites the maximal values occurred in July and August, the minimal values occurred in January and February, and in the case of Mosoni Danube at Čunovo (No. 3529/0082) in December 2009. The highest water temperature 25.9 ºC was measured in the right side river branch system at sampling site No. 1126 in Ásványi river branch. The water temperature in the Danube fluctuated from 0.8 to 22.5 ºC. Greater dispersion of values was characteristic for the reservoir: from 0.2 to 25.8 ºC (the maximal temperature was measured at sampling site No. 308 on the left side of the reservoir). The water temperature in the Mosoni Danube reached higher values at sampling site No. 1141 at Vének (1.4 - 25.4 ºC) than at Čunovo/Rajka sampling site No. 3529/0082 (0.4 - 21.4 ºC). The most balanced temperature was characteristic for the water in the left side seepage canal (sampling site No. 317) where it fluctuated from 7.1 to 15.5 °C. The dispersion of temperatures in the right side seepage was slightly higher, from 3.0 to 15.9 °C. Higher temperatures (above 15 °C) occurred from May to August or September, depending on the sampling site location. The water temperature in comparison with the previous year reached not only higher maximum, but lower minimums as well. Its course at selected sampling sites is documented on Fig. 2-3. pH The variation of pH values in the year 2010 is less pronounced than in the previous year. The pH generally ranged from 6.71 to 8.53. More significant decrease was registered after passing the flood wave at the beginning of June and during higher discharges in the first half of August. Conversely, increase of values can be seen after period without precipitation at low flow rates at the end of April and beginning of May and in the first half of July. Higher pH values occur in seasons corresponding to periods of increased assimilation activity of phytoplankton. The pH in the Danube water fluctuated from 6.81 to 8.50. Slightly wider range is characteristic for the right side river branch system: 6.71 – 8.53. The dispersion of pH values in the Mosoni Danube at Čunovo/Rajka sampling site (7.74 – 8.45) was lower than at the Vének sampling site (7.06 – 8.26). In comparison to the previous year the course of pH values in the reservoir was more balanced, the pH values fluctuated in a range from 7.91 to 8.45. The narrowest range, 7.81 – 8.13 is characteristic for the left side seepage canal (sampling site No. 317). The pH values measured by the Hungarian Party show wider dispersion in long-term and reach much lower values than the Slovak data, including also the jointly observed sampling sites. It is similar in the evaluated year 2010 as well (Fig. 2-4). Specific electric conductivity The specific electric conductivity of surface water refers to the dissolved salts content of mineral origin. It has a seasonal character; values are higher in winter months, lower occurs during the summer. Contrary to the previous year the minimal values in the evaluated period were registered in July and at the beginning of August (in the year 2009 it was in May and at the beginning of June). The highest values in the year 2010 were measured at sampling site no. 1141 in the Mosoni Danube at Vének, where the conductivity ranged from 35.6 to 80.6 mS.m-1 (February 2010) – Fig. 2-5. The conductivity values at this sampling site were higher than in previous years and similar values occurred in the year 1998 and 1999. On most of observed sampling sites the conductivity reached higher values than in the previous period and the values were similar to the conductivity in the year 2005. The course of specific conductivity at sampling sites in the Danube, Mosoni Danube at Čunovo/Rajka and also in the river branch system followed the conductivity values at the sampling site in Bratislava (No. 109). The values fluctuated between 29.0 and 55.9 mS.m-1. The conductivity in the reservoir varied in narrower range: 36.7 – 56.3 mS.m-1. The highest values measured in the reservoir in 2010 at all four sampling sites represents the highest conductivity values that occurred during the observed period. The dissolved solids content in seepage canals was not seasonal in nature and it was stable. The electric conductivity values, similarly to the previous years, fluctuated in narrow range and the lowest spread of values (43,9-51,0 mS.m-1) was typical for the water in the left side canal at Hamuliakovo (sampling site No. 317). In general it can be stated that the conductivity values measured by the Slovak Party are higher that values recorded by the Hungarian Party, what can be seen particularly at jointly observed sampling sites, e.g. at sampling site No. 3531/0084 in the right side seepage canal at Čunovo/Rajka (Fig. 2-5). Suspended solids The suspended solids content is closely related to the flow rate. It increases at flood waves and higher values are characteristic mainly for the summer period. The highest content of 245 mg.l-1 was recorded at the end of July at sampling site in Bratislava (No. 109). It is related to discharge wave, which occurred at the end of July, with culmination in the day of sampling (26.7.2010). Values above 100 mg.l-1 relates to another discharge waves at the beginning of August and at the beginning of September (average daily values were above 4000 m3.s-1). The highest flood wave with culmination on June 5, 2010 (flow rate at Devín reached 8071 m3.s-1) was not directly captured by sampling. The sampling on most of sampling sites was performed in the middle of the month and only increased values of suspended solids were registered. Nearest sampling (June 9) was performed in the reservoir, where the highest concentration 91 mg.l-1 in the navigation line was related to petering out of the flood wave in June. The other contents of suspended solids in the reservoir varied in the range <9.5 - 69 mg.l-1 and were lower than in the year 2009. Suspended solids concentrations at sampling site in the Danube at Medveďov, in the Danube old riverbed and in the Mosoni Danube at Čunovo/Rajka were higher in the evaluated year then in last three years (2007-2009). The content measured in the Mosoni Danube at Vének was low, it varied from 17 t 39 mg.l-1, with one high concentration of 188 mg.l-1 recorded in August. The suspended solids in the river branch system reached similar or slightly higher contents as in the year 2009, the maximal content of 129 mg.l-1 measured in August at sampling site No. 1112 (river branch at Helena). Regarding the origin of water low content of suspended solids is characteristic for seepage canals. In the left side seepage canal (No. 317) no measured concentration exceeded the detection limit value of the applied analytical method (9.5 mg.l-1). In the right side seepage canal (sampling site No. 3531/0084) the content fluctuated from 2 to 25 mg.l-1. When analysing changes in suspended solids content at sampling sites in the Danube it can be stated that the suspended solids content downstream of reservoir (at sampling site No. 112 in Medveďov) during flood waves is lower than in the Danube at Bratislava, which refer to settling effect of the reservoir. The course of suspended solids concentrations in 2010 at selected sites is illustrated on Fig. 2-6. Iron The amount of suspended solids influences the iron content in surface water, therefore higher iron content occurs in samples taken during higher discharges. The iron concentrations in the Danube water, in the Mosoni Danube at Čunovo/Rajka and in the river branch system in 2010 were higher than in the previous year, and fluctuated in the range from 0.07 to 1.81 mg.l-1, with one higher value at sampling site No. 109 in Bratislava recorded at the beginning of August (4.13 mg.l-1). The iron concentration in the sample with the highest suspended solids content (26.7.2010) was not analysed. The highest iron contents on the other sampling sites (except the reservoir) also occurred at the beginning of August and they correlated with the highest suspended solids content at particular sampling sites. The iron concentrations in the reservoir varied from 0.05 to 0.58 mg.l-1, while the highest concentrations were recorded in June. The lowest iron concentrations were characteristic for the seepage water. In the left side seepage canal they varied from 0.06 to 0.13 mg.l-1, in the right side seepage canal they were slightly higher, up to 0.23 mg.l-1. Manganese The manganese content in the evaluated year at particular sampling sites was similar as in the previous year, mostly fluctuated in the range <0.005 to 0.13 mg.l-1. In the Mosoni Danube at Vének (No. 1141) and in the left side seepage canal up to 0.16 mg.l-1. Contrary to the year 2009 several higher concentrations occurred. The highest concentration in 2010 (0.34 mg.l-1) was measured at sampling site No. 0042 downstream of the weir at Dunakiliti in the Danube old riverbed. Higher manganese concentrations of 0.33 mg.l-1 and 0.21 mg.l-1 were also recorded in the river branch system in the Szigeti arm at site No. 1114 and in the Danube old riverbed upstream of the weir (No. 4016). The manganese content in the reservoir was low during the whole year and the highest concentrations in June reached maximally 0.08 mg.l-1. Basic physical and chemical parameters - summary The basic physical and chemical parameters in the Danube and in the river branch system connected to the Danube main riverbed show seasonal variations and some of them predominantly depend on the flow rate. The fluctuation of basic physical and chemical parameters in the Mosoni Danube and in the seepage canal reflects the different characteristics of these water bodies. The water quality in the Mosoni Danube is influenced by the Danube water and at Vének sampling site by its affluents and wastewater from Győr. The water in the seepage canal is influenced mainly by the leaking ground water. In comparison with the year 2009 higher maximal values of water temperature (except the seepage canals) and higher values of specific conductivity were recorded, while in the reservoir the highest conductivity was documented for the whole observation period at all four sampling sites. The pH values were similar as in the year 2009, but the variability of values was lower. The iron and manganese concentrations and the suspended solids content were influenced by the actual hydrological regime. On most of sampling sites the iron concentrations and the suspended solids content were higher in comparison with the previous year (only in the reservoir they were lower and in the seepage canals similar). The manganese concentrations varied in similar ranges, but contrary to the previous year higher concentrations occurred sporadically. 2.3. Cations and AnionsThe quantitative ratio of the surface water ionic composition in the evaluated year 2010 showed high stability, just as in previous years. The seasonal fluctuation of individual ions content followed the changes of conductivity. Changes of dissolved solids content are related to the flow rate fluctuation in the Danube. Compared to the long-term measurements the values of basic cations and anions have not changed. The development of cations and anions concentrations at particular sampling sites was similar. Higher content of salts is characteristic for the Vének sampling site on the Mosoni Danube due to its affluents and cleaned wastewater from Győr. The average values of sodium, potassium, chloride and sulphate ions at Vének exceeded the average values registered on the other sampling sites. Higher conductivity values in the year 2010 at some sampling sites were mainly due to higher contents of hydrogen-carbonates, sulphates, chlorides and sodium. The most stable ionic composition was characteristic for the seepage water. 2.4. NutrientsAmmonium ion The ammonium ion contents in the year 2010 were similar or slightly higher as in the previous year. Their course during the year was more variable. Higher values occurred at particular sites in different months. The highest concentration (0.29 mg.l-1) was recorded in February at sampling site No. 1141 in the Mosoni Danube at Vének. At this site the ammonium ion content varied in similar range as the year 2009, but during the year there were more high values. Similar situation was in the Danube water and in the river branch system. The concentrations in the Danube and in the Mosoni Danube at Čunovo/Rajka fluctuated from <0.02 to 0.167, in the river branch system they were slightly lower, from <0.02 to 0.12 mg.l-1. The ammonium ions in the reservoir varied in similar range as in the year 2009 (<0.051 to 0.141 mg.l-1). The lowest contents of ammonium ion in the evaluated year were registered by the Slovak Party at jointly observed sampling site No. 3531/0084 in the right side seepage canal (maximally up to 0.052 mg.l-1), but according to the Hungarian data the ammonium ion content at this site reached 0.18 mg.l-1. The ammonium ion concentrations in the left side seepage canal varied from 0.051 to 0.128 mg.l-1. Nitrates Nitrates concentrations also in 2010 showed seasonal fluctuation, which was less noticeable in seepage canals. In winter months nitrates concentrations reached higher values, afterwards they gradually decreased; low values were registered from May to September and at the end of the year they slightly increased again. Seasonal fluctuation is related to the vegetation period and consumption of nutrients in the water. In the vegetation period the nutrient content mostly decreases to the half of the winter amount. Except the seepage canals the course of nitrates concentration at particular sampling sites was similar. Higher values occurred mainly in the Danube and in the Mosoni Danube at Čunovo/Rajka (maximally up to 22.3 mg.l-1. Lower values were measured at sampling sites in the river branch system (from 5.1 to 17.8 mg.l-1), in the tailrace canal at Sap, in the Mosoni Danube at Vének and in the reservoir (from 4.3 to 15.4 mg.l-1). The lowest concentrations of nitrates were characteristic for the seepage water where they varied in a narrow range from <4 to 8.7 mg.l-1. Generally the nitrates contents were higher in comparison with the previous year. The course of nitrates concentrations at selected sampling sites is illustrated on Fig. 2-7. Nitrites The nitrites ion concentrations are considered as a temporary product of nitrification and denitrification processes. In the evaluated year the course of nitrites at sampling sites in the Danube and in the river branch system showed a seasonal variation, similarly to nitrates, and concentrations fluctuated in the range from .006 to 0.135 mg.l-1, with two higher values (0.184 mg.l-1 at Medveďov - No. 2306 and 0,187 mg.l-1 at Rajka – No. 1203). Similar concentrations were recorded in the Mosoni Danube at Čunovo/Rajka (No. 3529/3360) and at Vének (No. 1141). On the sampling site at Vének more high values occurred during the year, maximally 0.16 mg.l-1. The nitrites content in the reservoir varied from 0.02 to 0.11 mg.l-1. The course of concentrations in seepage canals was more balanced, with slight fluctuation ranging from 0.01 to 0.09 mg.l-1. In general it can be stated that the nitrites content in the evaluated year was similar to the previous years. Total nitrogen The total nitrogen content is predominantly affected by fluctuation of nitrate-nitrogen and organic-nitrogen concentrations, which results from the quantitative ratio of nitrogen forms. The total nitrogen belongs to water quality parameters with significant seasonal fluctuation. Maximums are reached in colder months and minimums in warmer months (during the vegetation period). In the year 2010 the total nitrogen content on most of sampling sites varied in the range 1.28 - 6.0 mg.l-1. In the river branch system, in turn, two higher values occurred. In April concentration of 7.51 mg.l-1 was recorded in the Szigeti arm (sampling site No. 1114) and at the beginning of October the highest value of total nitrogen concentration in the year 2010 – 8.99 mg.l-1 was measured in the Ásványi river branch (sampling site No. 1126). The seasonal fluctuation in the seepage canals is less remarkable and regarding the origin of the water the total nitrogen content is lower (Fig. 2-8). In the left side seepage canal (sampling site No. 317) in the evaluated year the total nitrogen fluctuated in a narrow range from 1.01 to 2.44 mg.l-1. In the right side seepage canal at Čunovo/Rajka (common sampling site No. 3531/0084) different range of values was documented again by the Slovak and Hungarian Parties: 1.33 - 2.15 mg.l-1 and 1.51 – 3.96 mg.l-1 respectively – Fig. 2-8. Compared with the previous year the total nitrogen contents at most of sampling sites were similar or slightly higher. Only in the Danube old riverbed and in the Mosoni Danube at Vének they were slightly lower. Phosphates Higher values of phosphates concentrations are characteristic for colder months and during high flow rates. The lowest values are typical for vegetation period, when intensive growth of algae going on. There is an inversely proportional relationship between the phosphates content and the phytoplankton abundance. During the development of algae low contents of phosphates or even contents below detection limit occur. Such low values in 2010 occurred at the beginning of May, in July and in the reservoir also in September, due to a typical autumn diatoms development. Higher values in warmer months were observed during cooling or due to discharge and flood waves at the end of May, at the beginning of June, in July and August. The course of phosphates concentrations during the year was similar almost on every monitoring site. An exception was the sampling site No. 1141 in the Mosoni Danube at Vének, where higher values occurred from June to September, The concentration in June (0.49 mg.l-1) was significantly higher than other ones. The phosphates concentrations in the Danube main riverbed fluctuated in the range from <0.02 to 0.30 mg.l-1. Slightly lower contents of phosphates were registered in the Danube old riverbed and in the river branch system – up to 0.24 mg.l-1. In the Szigeti river branch (sampling site No. 1114) one higher value of 0.42 mg.l-1 occurred in November. On sampling sites in the reservoir and in the Mosoni Danube at Čunovo/Rajka (No. 3529/0082) the phosphates concentrations fluctuated from <0.02 to 0.22 mg.l-1. Development of phosphates content in the seepage canals was more balanced and values varied from <0.03 to 0.10 mg.l-1. Development of phosphates content in the year 2010 at some sampling sites is documented on Fig. 2-9. In comparison with the previous year the phosphates concentrations were similar on most of sampling sites. Slight decrease of concentrations was registered in the reservoir and in the tailrace canal at Sap (sampling site No. 3530). Total phosphorus Changes of the total phosphorus content in time only partially follow the quantitative changes of phosphates. The increase of its concentration in surface water is often caused by phosphorus bound to suspended solids. On most of observed sampling sites higher maximal values of total phosphorus were recorded in the evaluated year than in the year 2009. High values were documented mostly in August on sampling sites at Bratislava (No. 109 – 0.47 mg.l-1) and in the Danube old riverbed at sampling site No. 0043 upstream of the submerged weir (0.31 mg.l-1). Apart from these higher values the total phosphorus content ranged from 0.02 to 0.25 mg.l-1. The highest total phosphorus concentrations were characteristic for the sampling site No. 1141 in the Mosoni Danube at Vének, where they varied from 0.10 to 0.26 mg.l-1, with one higher value of 0.51 mg.l-1. The total phosphorus content in the reservoir was lower in the evaluated year than in the previous year and it varied in the range 0.03 - 0.16 mg.l-1. The lowest contents were measured in seepage canals (0.01 to 0.10 mg.l-1) – Fig. 2-10. Similarly to the previous year the total phosphorus content in the Danube old riverbed at sampling sites observed by the Slovak Party (0.02 - 0.17 mg.l-1) was lower than at sampling sites observed by the Hungarian Party on the right side (0.06 to 0.31 mg.l-1). Nutrients - summary The individual nutrients show seasonal fluctuation. Higher concentrations are characteristic for colder months; decrease of values is recorded in the spring after getting warmer. The seasonal fluctuation relates with biochemical processes in the water, which are temperature dependent. The seasonality in the evaluated period was more remarkable in case of nitrates and total nitrogen, less remarkable in case of ammonium ions. The nutrients content at particular sampling sites recorded in the year 2010 was similar as in the previous year. Slightly higher were the concentrations of nitrates and the total phosphorus reached higher maximums than in the year 2009. The most polluted water in terms of nutrients appears to be the surface water in the Mosoni Danube at Vének, where higher concentrations of nutrients occur during the year more frequently and disrupt the seasonal fluctuation. The lowest and the most balanced nutrients values can be found in the seepage water, what results from its groundwater origin. The nutrient content in the Danube water is potentially sufficient for development of eutrophic processes under other suitable conditions. 2.5. Oxygen regime parametersDissolved oxygen The dissolved oxygen content is besides the decay processes of organic pollution influenced by hydro-meteorological conditions and by assimilation activity of phytoplankton. The dissolved oxygen content proportionally decreases with increasing water temperature in the Danube. Low concentrations in the evaluated year were recorded from June to August, September. The highest values occurred in the winter and spring months. Higher concentrations of dissolved oxygen were also documented in June at sampling sites in the reservoir (No. 307, 308, 309, 311), in the Danube old riverbed downstream of the submerged weir (No. 0042) and in the river branch system (sampling site No. 1112 at Helena). These values are probably related to assimilation processes of phytoplankton. The development of dissolved oxygen concentrations on most of sampling sites showed a seasonal character, time series data were similar to the year 2009 and were more balanced than in the previous period. The dissolved oxygen concentration at observed sampling sites mostly varied in the range from 7.4 to 15.8 mg.l-1. Low values were recorded in the Ásványi river branch (6.5 mg.l-1) and in the Mosoni Danube at Vének (6.2 mg.l-1). The oxygen concentrations had different development in the right side seepage canal, where several low values were recorded from July to October; the lowest one was 6.1 mg.l-1. In general the oxygen conditions in the given year can be evaluated as very good. CODMn and BOD5 CODMn and BOD5 parameters are used for expression of organic contamination of water, they indicate the chemically and biologically degradable organic matter content. Higher values of CODMn and BOD5 usually occur at periods with higher flow rates in the Danube, when the water contains higher amount of natural organic matter. In the majority of sampling sites the organic pollution expressed by the CODMn parameter in the evaluated year was lower than in the previous year. The exception was the right side seepage canal and the Mosoni Danube at Vének, where the CODMn values were slightly higher than in the year 2009. On most of sampling sites the maximal values for the actual year were recorded at the beginning of August and were related to higher flow rates in this period. In the reservoir and in the tailrace canal they occurred in June and were not so significant compared to the other measured values. The highest values were registered in the Mosoni Danube at Vének (sampling site No. 1141), where they varied in a range from 3.4 to 7.9 mg.l-1, with one higher value of 10.5 mg.l-1 measured in August. The poorest water in terms of organic contamination was the water in seepage canals, where the CODMn values fluctuated in narrow ranges, from <0.8 to 2.4 mg.l-1. In the Danube main riverbed, in the reservoir and in the river branch system the CODMn values varied from 1.2 to 4.8 mg.l-1, with two higher values – 7.2 mg.l-1 (sampling site No. 109 at Bratislava) and 5.6 mg.l-1 (sampling site No. 1112 at Helena) – Fig. 2-11. The values in the Danube old riverbed measured by the Slovak Party on the left side varied in a range from <0.8 to 3.9 mg.l-1, while for the right side, which was monitored by the Hungarian Party, higher values were characteristic – from 2.3 to 6.7 mg.l-1. In case of BOD5 higher values were recorded in the evaluated year than in the previous year. However the increase was only slight. Exceptions were the sampling points in the Szigeti and Ásványi river branches (No. 1114 and 1126) and in the Danube old riverbed at Rajka (No. 0001), where BOD5 values slightly decreased. The BOD5 values in the Danube water varied from 0.7 to 6.1 mg.l-1, with one higher value of 8.21 mg.l-1 recorded in December at sampling site No. 2306 at Medveďov. Like in the case of CODMn also for the BOD5 there were differences documented in the data measured by the Hungarian and Slovak Parties. On sampling sites in the Danube old riverbed observed by the Hungarian Party (right side) BOD5 values varied in wider range (from 0.3 to 7.25 mg.l-1) compared to the left side, which is observed by the Slovak Party (from 0.7 to 3.5 mg.l-1). Differences in the measured values for this parameter can be seen at jointly observed sampling points as well (Fig. 2-12). In the Mosoni Danube at Vének (sampling site No. 1141) the BOD5 values varied from 2.0 to 5.3 mg.l-1, with one higher value of 8.1 mg.l-1 in February. At Rajka sampling site (No. 0082) one higher value of 7.6 mg.l-1 was measured in December, similarly as in the Danube at Medveďov, remaining values fluctuated in the range 1.92 to 3.9 mg.l-1. Slightly higher values were registered also in the reservoir, where BOD5 varied from 0.9 to 3.8 mg.l-1 (in the previous year from 0.9 to 2.6 mg.l-1). Similarly to the year 2009 a narrower range of values is characteristic for the left side river branch system (0.9 – 1.9 mg.l-1) than for the right side river branch system (0.3 - 6.4 mg.l-1). The lowest pollution is characteristic for water in the left side seepage canal at Hamuliakovo (sampling site No. 317), where the BOD5 values varied in a narrow range from <0.9 to 1.8 mg.l-1. Oxygen regime and organic carbon parameters - summary The dissolved oxygen content remained preserved on the level of previous years, even on the mostly polluted sampling site in the Mosoni Danube at Vének no situation with oxygen shortage occurred. The dissolved oxygen content in the year 2010 was similar to that in the year 2009, with the difference that value below 7 mg.l-1 occurred more frequently, which is a limit value for I. quality class according to the Table 2-2. Based on the monitoring results it can be stated that the organic contamination expressed by CODMn was lower in comparison with the previous year, while the BOD5 values were similar or slightly higher as in the year 2009. Also in the year 2010 there were differences in BOD5 values between the Slovak and Hungarian Party recorded on the jointly monitored sampling sites. Values obtained by the Hungarian Party were higher. The water in the seepage canals remained the cleanest. The most polluted water remains the water in the Mosoni Danube at Vének. The oxygen regime parameters in the Danube reflect the seasonal assimilation activity of phytoplankton and organic carbon oxidation processes. The measured data (1992-2010) indicate decreasing tendency of organic load at the Bratislava section of the Danube, which is related to the substantial wastewater treatment improvement in the upstream Danubian countries. 2.6. Heavy metalsFrom among heavy metals the joint monitoring includes observation of zinc, mercury, arsenic, copper, chromium, cadmium, nickel and lead contents. The courses of heavy metal concentrations in the evaluated period were similar as in the previous year. No heavy metals were monitored in the left side river branch system on the sampling site at Dobrohošť (No. 3376). In the year 2010 low concentrations were measured in case of mercury, cadmium and lead. The mercury in the evaluated year on all observed sampling sites was found in low concentrations, which varied from <0.003 to 0.062 µg.l-1. In data obtained by the Hungarian Party two concentrations were at the level of detection limit (0.02 µg.l-1), others were less. The two highest contents, 0.57 µg.l-1 and 0.062 µg.l-1 were determined in the Danube on sampling site No. 109 at Bratislava. In case of cadmium all values recorded by the Slovak Party were below the detection limit of the applied analytical method (VÚVH <0,05 µg.l-1 and SVP-BA <0,08 µg.l-1). Majority of concentrations determined by the Hungarian Party was below the detection limit as well, which is in this case 0.1 µg.l-1. Specific values were measured only seven times, maximally up to 0.4 µg.l-1 (the highest concentration on sampling site No. 0042 downstream of submerged weir at Dunakiliti). Recorded concentrations were lower than in the year 2009, when cadmium reached values up to 2.2 µg.l-1. The lead concentrations in the evaluated year varied in the range <0.7 – 2.7 µg.l-1. Majority of values was below the detection limit, <0.1µg.l-1 in case of VÚVH, <1.5 µg.l-1 in case of SVP-BA, and <0.7 µg.l-1 in case of Hungarian data. On three sampling sites concentrations close to the detection limit occurred once. Only on the sampling site in Mosoni Danube at Vének 5 values were measured higher than detection limit, ranging from 0.9 to 2.7 µg.l-1. The content of chromium varied from <0.2 to 2.8 µg.l-1, with three higher values : 5.1 µg.l-1 – sampling site No. 2306 at Medveďov, 6.6 µg.l-1 – sampling site No. 4016 in the Danube old riverbed at Dobrohošť, and 9.1 µg.l-1 – sampling site No. 307 in the reservoir. Compared with the previous year greater number of concentrations above the respective detection limit occurred. Major part of the recorded arsenic concentrations in the evaluated year remained below the detection limit of the applied analytical method. Sporadically occurred values exceeding the detection limit, with a frequency of one to three times per year, maximally reaching 1.7 µg.l-1. An exception was the sampling site at Vének (No. 1114), where seven values up to 3.1 µg.l-1 were recorded, with one value exceeding 12.0µg.l-1 determined in July. In the left side seepage canal all concentrations were lower than the detection limit, probably also due to its increase from 1.7 to 5 µg.l-1. The content of nickel in the evaluated year was similar as in the previous year. It varied in the range from <0.7 to 3.34 µg.l-1. In case of zinc in the year 2010 only one higher concentration of 44 µg.l-1 occurred, which was determined on sampling site No. 112 in the Danube at Medveďov. Other values fluctuated in the range from <1 to 21 µg.l-1 and were lower than in the year 2009. The highest concentrations from among heavy metals were characteristic for copper. The copper concentrations fluctuated up to 12.3 µg.l-1. Values exceeding 10 µg.l-1 in the evaluated year occurred only two times: at sampling site No. 0082 in the Mosoni Danube at Rajka (12.3 µg.l-1) and in the river branch system at sampling site No. 1112 at Helena (10.1 µg.l-1). The highest value recorded by the Slovak Party reached 9.5 µg.l-1 (sampling site No. 3529 in the Mosoni Danube at Čunovo). At jointly observed sampling sites higher concentrations were measured by the Hungarian Party – Fig. 2-13. However the differences were not as great as in the previous period. In summary it can be concluded that heavy metal concentrations, which were determined from filtered sample, were low during the evaluated year, with occasional occurrence of higher values. Great part of the determined values was below the detection limit of applied analytical methods. The lowest concentrations were registered in case of mercury, cadmium and lead. The highest concentrations were characteristic for copper. In terms of heavy metals the most polluted sampling site in 2010 was the sampling site in the Mosoni Danube at Vének. The detection limits of particular heavy metals often correspond to the II. or III. class of surface water quality according to the Table 2-2. The detection limits differ depending on laboratory. The evaluation of heavy metals according to the agreed limits (Table 2-2) at selected sampling sites is given in Table 2-6. Based on the comparison of heavy metal concentrations with limits pursuant to the Directive of the European Parliament and of the Council No. 2008/105/EC on environmental quality standards, the Regulation of the Government of the Slovak Republic No. 269/2010 Z.z. (Annex No. 1, Part B), establishing requirements for achieving good status of waters, and the Hungarian Standard MSZ 12749 “The quality of surface water, qualitative characteristics and qualification” it can be concluded, that in the year 2010 all values were in full compliance with environmental quality standards. 2.7. Biological parametersChlorophyll-a The chlorophyll-a concentrations refer to the quantity of phytoplankton and provide information about the eutrophic state of water. The amount of chlorophyll-a is influenced by flow rate and temperature conditions of the evaluated year and by the fluctuation of nutrients content. Due to higher flow rates in 2010 and more frequent occurrence of cooler periods the chlorophyll-a contents were low. They were similar as in the year 2009, but reached higher maximums. In the year 2010 there were two culminations of chlorophyll-a content, and in the reservoir of water works there were three. The first culmination was registered at the beginning of May, in the period with low precipitation and lower flow rates, similarly to the year 2009. In June significant decrease occurred, when the chlorophyll-a content often dropped below the detection limit. This decline was due to the cool end of May and subsequent passing of flood wave at the beginning of June. Further increase occurred at the beginning of July, with less frequency in May. The highest concentration in the year 2010 was recorded in the Danube on sampling site No. 2306 at Medveďov (52.1 mg.m-3). The culmination in May in the Danube old riverbed was insignificant and the highest chlorophyll-a values also occurred in July. Concentrations varied in the range 0.9 to 50.1 mg.m-3. They were slightly lower in the river branch system, in the tailrace canal and in the reservoir and varied from <2 to 36.7 mg.m-3. The chlorophyll-a in the Mosoni Danube at Vének (No. 1141) varied in a narrower range than in the year 2009 (<2 – 11.8 mg.m-3), what is not typical for this sampling site. These concentrations represent the lowest chlorophyll-a concentrations documented on this site since beginning the monitoring. They were even lower than in the right side seepage canal (No. 3531/0084) at Čunovo/Rajka, where they fluctuated from <0.2 to 15.8 mg.m-3. The lowest chlorophyll-a concentrations are permanently characteristic for the left side seepage canal, where they varied in the evaluated year below the detection limit of the applied analytical method, which was 6 mg.m-3. Other biological parameters The evaluation of biological elements of quality in 2010 at sampling sites monitored by the Hungarian Party was carried out in the frame of evaluation of ecological status of waters in accordance with the methodology agreed within the Trans-boundary Water Commission, when the evaluation related the sampling sites, not water bodies. The Slovak Party will evaluate the ecological status at jointly observed sampling sites every six years. At sites monitored by the Slovak Water Management Authority (SVP-BA) the evaluation used in the previous period continued. Biological parameters at sampling sites monitored by the Hungarian Party From among the biological quality elements the Hungarian Party in the year 2010 observed phytoplankton, phytobenthos, and at sampling sites at Rajka, Dunaremete, Medveďov and Vének (Mosoni Danube) macrozoobenthos as well. During phytoplankton observations the highest density of algae was recorded in samples taken at spring, when the most abundant were the centric diatoms (Bacillariophyceae - Centrales). Compared to the previous year the values were similar. In the river branch system stronger development of algae was documented in April and May in the river branch at Helena and in the Ásványi river branch. The dominant phytoplankton species were mostly the same as in the Danube water, but the species diversity was higher. Quantitative changes of phytoplankton in the Mosoni Danube at Rajka followed the changes in the main riverbed. The development of phytoplankton at Vének was influenced by hydro-morphological particularities and abundance of nutrients that get into the river with wastewater. Lower abundance of species, as well as individuals are characteristic for the seepage water during the whole year. An overview of biological quality elements evaluation results is given in Table 2-3. Table 2-3: Quality classes for selected biological quality elements on the Hungarian side
Based on obtained results from the monitoring of biological quality elements it can be stated that according to the phytoplankton I. quality class was determined almost at every sampling site, which corresponds to high quality. Only in the seepage water II. quality class was determined, so good quality. In terms of phytobenthos moderate quality (III. class) was determined at two sampling sites – below the submerged weir at Dunakiliti and in the river branch at Helena. The other sampling sites were characteristic by good quality. Macrozoobenthos was observed only at some sampling sites (Table 2-3). According to the biological parameter at three sampling sites was the quality moderate (III. class) and in the Mosoni Danube at Vének it was bad. However the evaluation rating for macrozoobenthos is not definitive and still is under elaboration. Based on the monitoring results of biological quality elements and considering the evaluation of physico-chemical elements and evaluation of other specific pollutants (see the Hungarian National Report in 2010) the ecological status of water bodies at individual sampling sites was determined as good, so the II. quality class. Biological parameters at sampling sites monitored only by the Slovak Party The monitoring and evaluation of biological quality elements was carried out according to the methodology applied in the previous years. Phytoplankton In the period between March and October 2010 twelve phytoplankton samples were taken at monitored sampling sites (Table 2-4). Compared to the year 2009 higher value of phytoplankton abundance were reached at all sampling sites. Increase of phytoplankton was recorded for the first time already in March, unlike the previous year, when higher values did not occurred until May. Further development of phytoplankton in the evaluated year occurred in May, when maximal values were recorded at two sampling sites in the reservoir (No. 308 and 311). In June the abundance decreased due to high flow rates. The development of phytoplankton repeatedly occurred at the beginning of July, when maximal values of year-round observation were recorded (except the seepage canal and two abovementioned sampling sites in the reservoir). In August there was a decrease in development to the minimal yearly values due to unfavourable weather (lots of rain and low temperatures). The typical autumn diatoms development in September caused an increase in abundance at all monitored sites. Abundance of phytoplankton in the year 2010 ranged from 24 to 20024 individuals/ml. The highest abundance was recorded in July in the lower part of reservoir at sampling site No. 309, similarly to the year 2009. It exceeded the limit for mass growth of phytoplankton, thus 10000 individuals/ml. Such high value occurred only in this one case. The average yearly abundance did not reached values close to the limit for mass growth at any of observed sampling sites. Similarly to the previous period the most abundant in the Danube old riverbed, in the reservoir, in the tailrace channel at Sap and in the river branch system were the centric diatoms (Bacillariophyceae - Centrales). In the left side seepage canal at Hamuliakovo sampling site the pennate diatoms (Bacillariophyceae - Pennales) created a significant portion of phytoplankton. The phytoplankton composition significantly determines the saprobe index of biosestone. The saprobe index in 2010 varied from 1.70 to 2.39 (Table 2-4). It fluctuated in the range, which corresponds to beta-mezosaprobity. Such environment offers suitable living conditions for a wide scale of organisms with high species diversity. The average values of saprobe indexes at six sampling sites, in the reservoir and in the Danube old riverbed, were higher than in the year 2009. On the other four sampling sites they were lower (Table 2-4). Table 2-4: Values of saprobe index of biosestone in 2010
Concerning the phytoplankton abundance, as a substantial determinant of the saprobe index, it can be stated that the hydropower system had no negative influence on saprobity either in 2010. Macrozoobenthos From the ecological point of view the macrozoobenthos observation in the flowing water bodies appears to be the most suitable method for bioindication. The samples could be relatively easily accessible and quickly processed. In the year 2010 the macrozoobenthos samples were taken at monitoring sites given in Table 2-5. In section with quickly flowing water with gravely and stony bottom (sampling site No. 4025) rheophilic and oxibiontic macrozoobenthos species prevail indicating beta-mezosaprobity. Species Corophium curvispinum, Dikerogammarus villosus, Cricotopus sp. and Lumbricidae g. sp. div. dominated at this sampling site in 2010. In sections with slowly flowing water stagnophilic and oligooxibiontic species appear, which are resistant to slight contamination. On these sections sandy and muddy bottom can be found – sampling sites in the Danube old riverbed No. 4016 at Dobrohošť and 3739 at Sap, where Dikerogammarus villosus, Lumbricidae g. sp. div., Corophium curvispinum, Cricotopus sp., at sampling site No. 3739 also Lithoglyphus naticoides and Limnomysis benedeni, and at sampling site No. 4016 furthermore Simulium sp., Hypania invalida, Eukiefferiella cyanea, Potamopyrgus antipodarum and Radix ovata dominated in the evaluated year. There are places with different flow velocities in the reservoir. Depending on the flow velocity there exist different types of bottom substrates. Sandy and gravely substrate (sampling site No. 307) gradually changes into muddy substrate at places with slow flow velocity (sampling sites No. 308, 309 and 311). Dominant macrozoobenthos species in the reservoir in 2010 were Lumbricidae g. sp. div., Corophium curvispinum, Potamopyrgus antipodarum, Hypania invalida, Pisidium sp., Sphaerium rivicola and Chironomus sk reductus. At sampling site No. 307 also Pontogammarus obesus, in the upper part of the reservoir (sampling site No. 308) furthermore Cricotopus sp. Dikerogammarus villosus and Nais sp., and in the lower part of the reservoir (sampling site No. 309) Chironomus semireductus as well. In the river branch system species Dikerogammarus villosus, Theodoxus danubialis, Cricotopus sp., Anabolia furcata, Physella acuta, Physa fontinalis, Corophium curvispinum, Potamopyrgus antipodarum and Limnephilus lunatus dominated. Based on the determined species the saprobe indexes of macrozoobenthos were calculated, which fluctuated in the range from 1.98 to 2.54 (Table 2-5). Values in the Danube old riverbed varied from 2.04 to 2.31, which correspond to beta-mezosaprobity. The saprobe index in the reservoir reached values from 2.09 to 2.54, which correspond to beta and beta-alpha mezosaprobity depending on the sampling site location. From the seasonal changes point of view the saprobe index of macrozoobenthos showed slight improving compared to the previous year in the spring, summer and autumn periods. Table 2-5: Values of saprobe index of macrozoobenthos in 2010
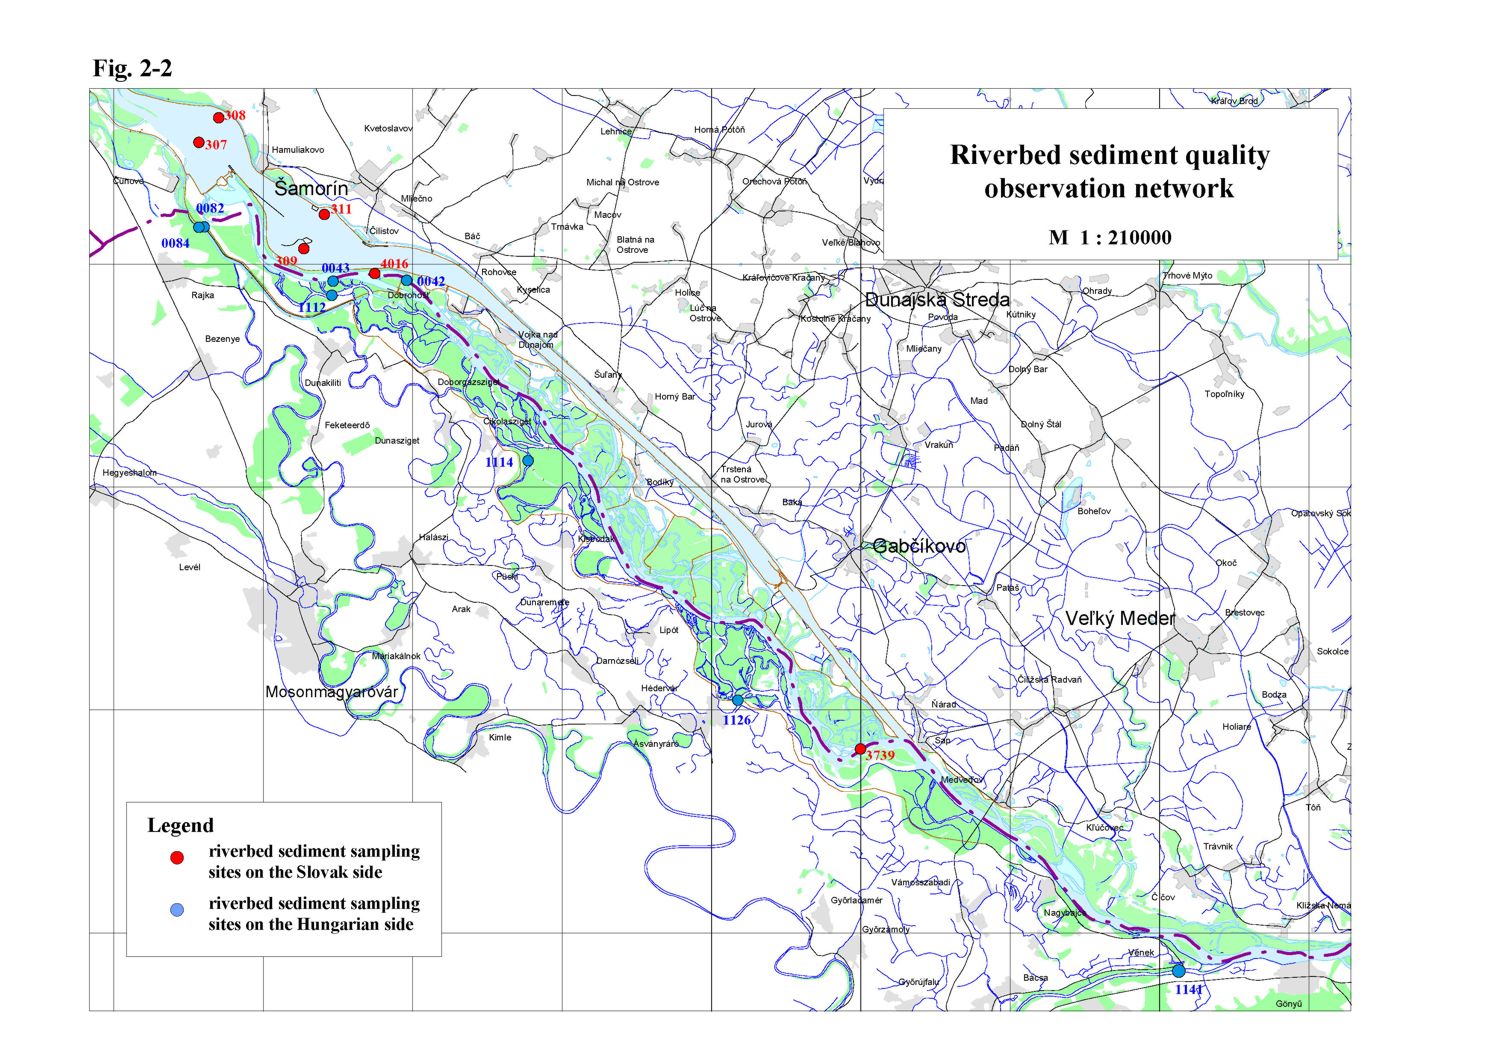
The other aspects of development of macrozoobenthos communities are evaluated in Part 7 – Biological monitoring, where more detailed evaluation for Cladoceras (Cladocera), copepods (Copepoda), molluscs (Mollusca), dragonflies (Odonata), mayflies (Ephemeroptera) and caddisflies (Trichoptera) can be found. 2.8. Quality of sedimentsIn the evaluated year 2010, similarly to the previous year, the Slovak and Hungarian Parties have realized unified evaluation of sediment quality according to the “Canadian Sediment Quality Guideline for Protection of Aquatic Life” (CSQG) published in 1999, revised in 2002. The sediment sampling in the frame of the Joint Monitoring by the Slovak Party was carried out at the beginning of October 2010 at six sampling sites. The Hungarian Party sampled the sediments in May and October 2010 at seven sampling sites. The situation of sampling sites is shown on Fig. 2-2. The list of analysed parameters was the same as in 2009. Besides the inorganic and organic micro components the Hungarian Party analysed the total phosphorus and total nitrate content as well. Compared to the previous year in case of inorganic pollutants increase of exceeding of Threshold Effect Level (TEL) were recorded with greater frequency on the Slovak territory, while with less frequency on the Hungarian territory. At sampling sites observed by the Slovak Party in case of every monitored heavy metal at least one exceeding of threshold limit value (TEL) was registered. One exceeding occurred in case of chromium, three in case of lead and four in case of mercury, arsenic and zinc. The measured concentrations fluctuated close to the Threshold Effect Level (TEL). The highest concentrations occurred in case of copper and cadmium. At all sampling sites their content varied in the range >TEL - <PEL (Probable Effect Level), when the unfavourable effect on biological life occurs occasionally, and represent potential possibility of eco-toxicological effect. All determined values were closer to the TEL limit. In sediment samples taken on the Hungarian territory lower number of concentrations above the threshold values for heavy metals occurred. The lowest contents were documented in case of mercury, arsenic and lead in both May and October sampling, since no value reached the TEL limit. At these concentrations the unfavourable effect on biological life occurs rarely and it corresponds to an uncontaminated natural environment. In case of copper slight exceeding of TEL was recorded on three sampling sites in May and October. The highest concentrations in the year 2010 were found in zinc. All values were in the range >TEL - <PEL, when values measured in May on sampling sites in the Mosoni Danube at Vének and in the Ásványi river branch were closer to the PEL limit. Contrary to the year 2009 no exceeding of the Probable Effect Level (PEL), when the unfavourable effect on biological life occurs frequently, was recorded. Concentrations of organic micro-pollutants mostly fluctuated below the TEL limit, when the unfavourable effect on biological life occurs rarely (all Hungarian data). Concentrations exceeding the TEL in case of heptachlor, fluoranthene, phenanthrene and benzo(a)pyrene varied closely to this level at several sampling sites on the Slovak side. The best sediment quality was proved at sampling site No. 0084 in the right side seepage canal, the worst sediment quality was documented at sampling site No. 311 in the reservoir. On the Hungarian side the total phosphorus and total nitrogen content in sediments was analysed as well. The total phosphorus content in 2010 varied in the range from 280 to 2449 mg.kg-1 and the concentrations of total nitrogen varied in the range from 326 to 2515 mg.kg-1. Higher concentrations of total phosphorus were measured in the October sampling, in case of total nitrogen in the sampling in May. The lowest contents for both parameters were recorded in May at sampling site No. 1114 in Szigeti river branch and in October at sampling site No. 0084 in the right side seepage canal at Rajka. The highest concentrations occurred in the Mosoni Danube at Vének (sampling site No. 1141). Comparing to the year 2009 the total phosphorus content increased and the total nitrogen content decreased. 2.9. ConclusionsThe surface water quality in the evaluated year 2010 was similar as in previous years. Increased values of some parameters in the Danube were related to higher flow rates in the Danube. The quantitative ratio of ionic composition of the surface water shows high stability in last years. In case of nutrients similar or slightly higher concentrations of nitrates and total phosphorus were registered in comparison with the previous year, however they did not violate the long-term tendency of pollution decrease. Oxygen conditions in the year 2010 were very good; the organic pollution represented by CODMn was lower in comparison with the previous year 2009, in case of BOD5 it was similar or slightly higher. When analysing changes in suspended solids content at sampling sites in the Danube, it can be stated that the suspended solids content downstream of the reservoir (at Medveďov sampling site) during flood waves is lower than in the Danube at Bratislava, which demonstrates the settling effect of reservoir. From among the heavy metals the highest concentrations were recorded in case of copper, the lowest in case of mercury, cadmium and lead. A large part of analysed concentrations was below the detection limits of applied analytical methods. The fluctuation of surface water quality parameters in the right side river branch system since introducing the water supply in 1995 follows their fluctuation in the Danube. The water quality in the Mosoni Danube differs in the upper and lower section of the river. The water quality at the sampling site at Čunovo/Rajka follows the water quality in the Danube, while the water quality on the lower section of Mosoni Danube at Vének (upstream of the confluence with the Danube) is formed by its affluents and local pollution from settlements. Compared to previous years the water quality significantly improved thanks to investments realized in the wastewater treatment plant. In general it can be stated that the content of all nutrients decreased at this sampling site, although their concentrations in comparison with other sampling sites still reach the highest values. The cleanest water is characteristic for seepage canals, which results from its groundwater origin. The monitoring of biological elements of the surface water quality in the evaluated year at sampling sites observed by the Hungarian Party was realised according to the national methodologies for particular biological quality elements in accordance with the Water Framework Directive. According to phytoplankton the sampling sites were classified from I. to II. class, thus from high to good state, and according to phytobenthos from II. to III. class, thus from good to moderate state. Based on the monitoring results of biological quality elements and considering the evaluation of physico-chemical elements and evaluation of other specific pollutants (see the Hungarian National Report in 2010) the ecological status of water bodies at individual sampling sites was determined as good, so the II. quality class. The evaluation of sampling sites observed only by the Slovak Party was carried out according to methodology used in previous years. Macrozoobenthos and phytoplankton were evaluated. Saprobe indexes varied in ranges corresponding to beta-mezosaprobity, thus environment that offers suitable living conditions for a wide scale of organisms. An exception in the year 2010 was the sampling site No. 311 in the reservoir, where in case of the saprobe index of macrozoobenthos beta-alpha-mezosaprobity occurred. The sediment quality was evaluated according to the “Canadian Sediment Quality Guideline for Protection of Aquatic Life” (CSQG) published in 1999, revised in 2002. In the year 2010, contrary to previous years, no exceeding of the Probable Effect Level (PEL), when the unfavourable effect on biological life occurs frequently, in case of organic and inorganic sediment pollution was recorded. In case of organic contamination, on the Hungarian side all values were lower than the Threshold Effect Level, (TEL), when unfavourable effect on biological life occurs rarely. On the Slovak side there were concentrations also within the range >TEL and <PEL, but all fluctuated close to the TEL limit. In case of inorganic contamination several concentrations falling into the range >TEL and <PEL, when the unfavourable effect on biological life occurs occasionally, were found on the Slovak and Hungarian territories. The highest concentrations occurred in case of zinc, when at sampling sites at Vének and in the Ásványi river branch values closer to PEL limit were recorded. Other concentrations of heavy metals varied closer to the Threshold Effect Level (TEL). The highest concentrations of heavy metals occurred at sampling site No. 311 in the reservoir and in the Mosoni Danube at Vének (No. 1141). Table 2-6: Indicative classification of surface water quality parameters according to the agreed limits for surface water quality classification
* all the data below the detection limit ** most of the data below the detection limit In the Table 2-6 an indicative classification of selected sampling sites and selected surface water quality parameters was done. The indicative classification was realised using the limit values of five-classes system according to the trans-boundary water quality classification adopted by the Slovak-Hungarian Trans-boundary water Commission on its LXV. session and given in the “Surface water quality observation directive for Slovak-Hungarian boundary waters and for extended water quality monitoring on the Danube”. Some part of observed parameters shows seasonal fluctuation, which subsequently influences the classification into the quality classes. In case that a range is given (e.g. I-II) it means the natural seasonal fluctuation of particular parameters or their dependency on climatic conditions. The quality class in brackets means, that the measured value occurred only once or two times in the evaluated period (mostly during higher discharges or flood waves). The range with asterisks (e.g. I*-II*) represents a situation, when every recorded value was below the detection limit of applied analytical method, but the two Parties have different detection limits. Based on comparison of water quality entering the influenced area (sampling site at Bratislava) and water quality that leaves the influenced area (sampling site at Medveďov) it is clear, that the water quality that leaves the system is very similar.
|
|||||||||||||||||||||||||||||||||||||||||||||||||||||||||||||||||||||||||||||||||||||||||||||||||||||||||||||||||||||||||||||||||||||||||||||||||||||||||||||||||||||||||||||||||||||||||||||||||||||||||||||||||||||||||||||||||||||||||||||||||||||||||||||||||||||||||||||||||||||||||||||||||||||||||||||||||||||||||||||||||||||||||||||||||||||||||||||||||||||||||||||||||||||||||||||||||||||||||||||||||||||||||||||||||||||||||||||||||||||||||||||||||||||||||||||||||||||||||||||||||||||||||||||||||||||||||||||||||||||||||||||||||||||||||||||||||||||||||||||||||||||||||||||||||||||||||||||||||||||||||||||||||||||||||||||||||||||||||||||||||||||||||||||||||||||||||||||||||||||||||||||||||||||||||||||||||||||||||||||||||||||||||||||||||||||||||||||||||||||||||||||||||||||||||||||||||||||||||||||||||||||||||||||||||||||||||||||||||||||||||||||||||||||||||||||||||||||||||||||||||||||||||||||||||||||||||||||||||||||||||||||||||||||||||||||||||||||||||||||||