PART 1
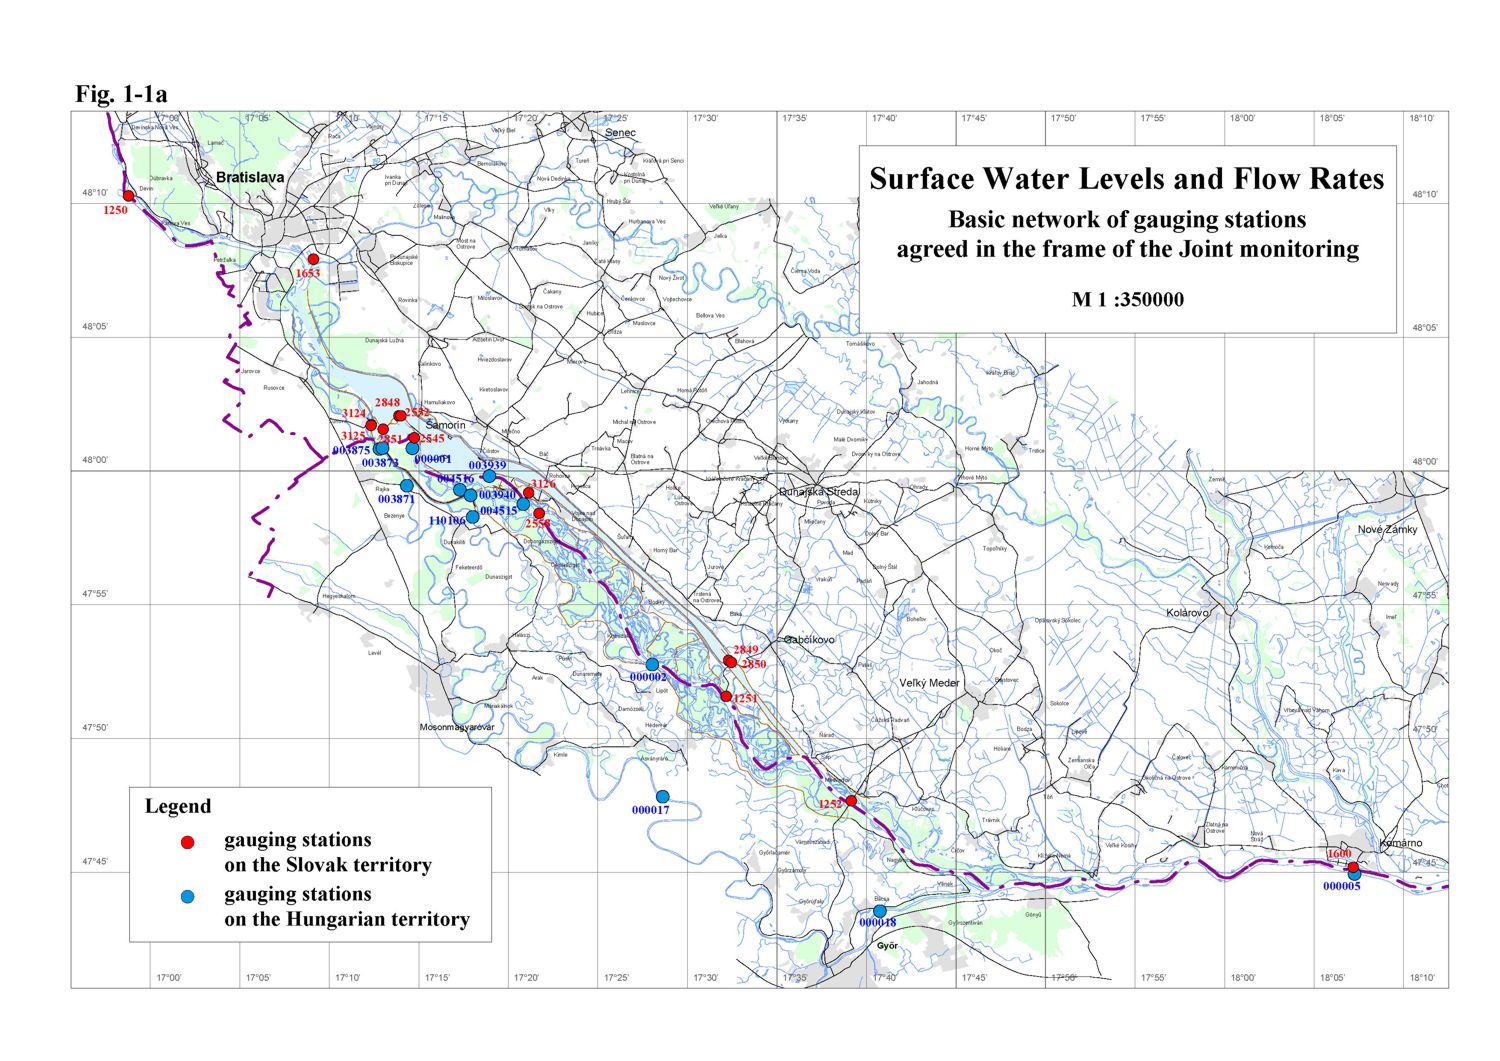
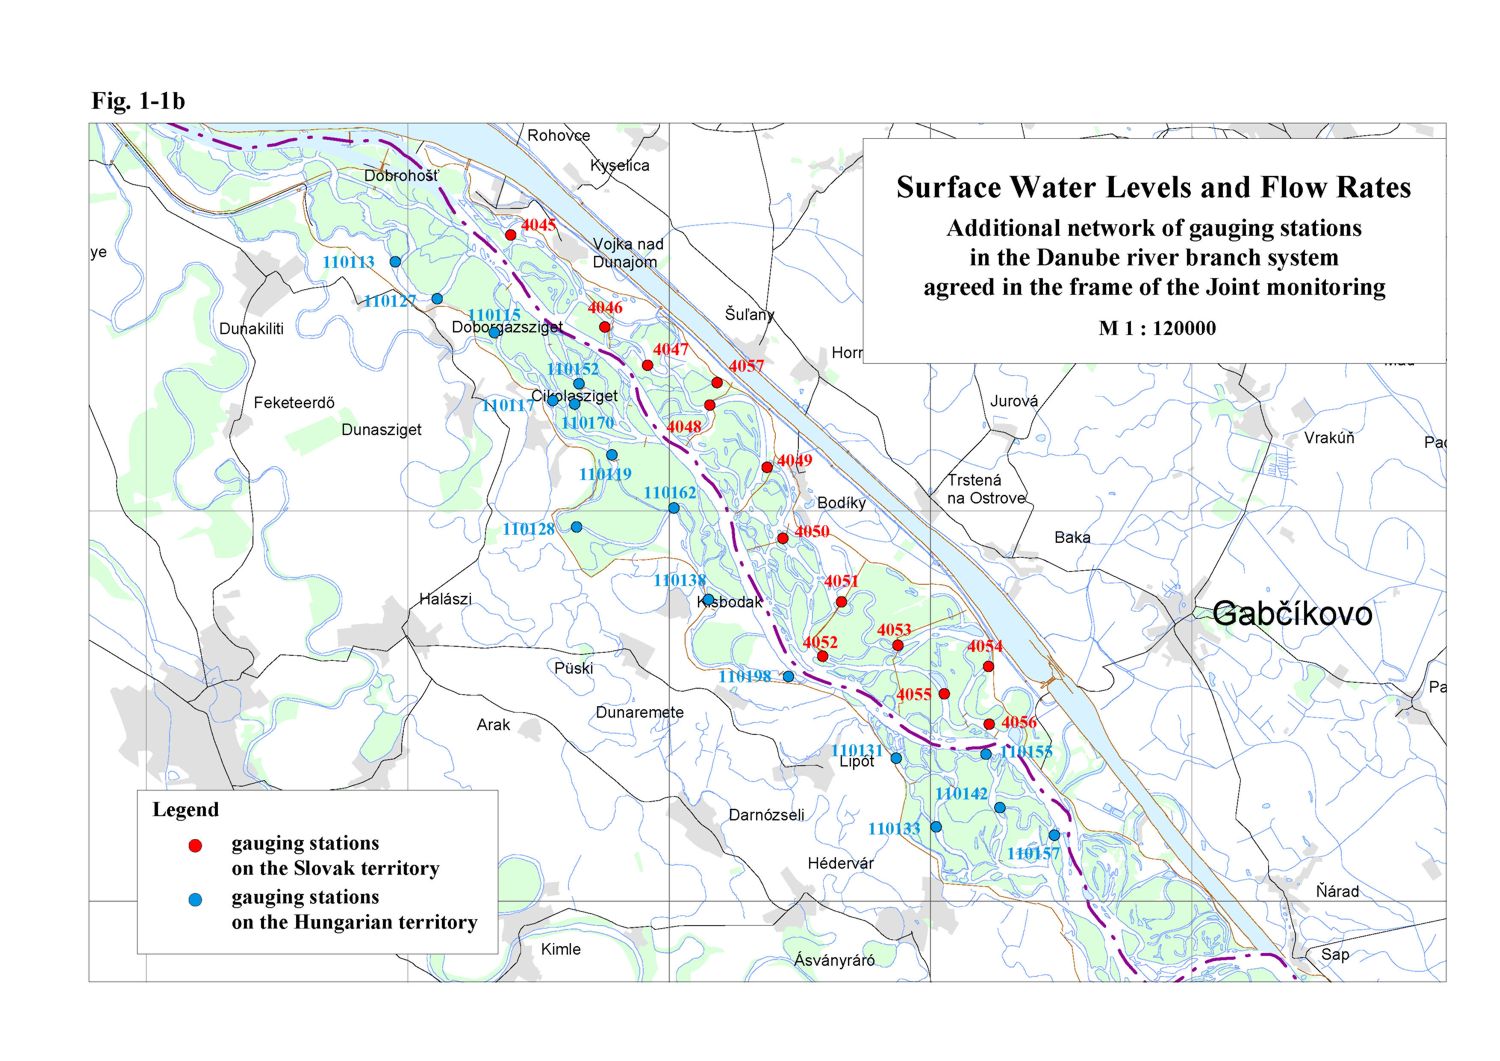
Surface water levels and flow ratesThere were no changes in the monitoring of surface water levels and flow rates during the hydrological year 2010. Water level observations and flow rates measurements continued in the same extent as in previous years. The evaluation of the surface water regime relates to the hydrological year (period from November 1 of the previous year to October 31 of the evaluated year). Surface water level recording in the hydrological year 2010 was carried out at 28 gauging stations on the Slovak side and 29 gauging stations on the Hungarian side (Table 1-1). Flow rate calculations were performed at several gauging stations (10 gauging stations on each side). The observation network is presented in Fig. 1-1a, Fig. 1-1b. Parties in the intergovernmental Agreement have agreed to mutually exchange data from these gauging stations. Joint flow rate measurements helped the common evaluation of flow rates discharged into the Danube downstream of the Čunovo dam and into the Mosoni branch of the Danube. Based on mutual evaluation of common measurements, time series data of surface water levels and flow rates were accepted. These data create the basis for joint evaluation of measures and water supply realised according to Articles 1-3 of the Agreement. Table 1-1: List of gauging stations
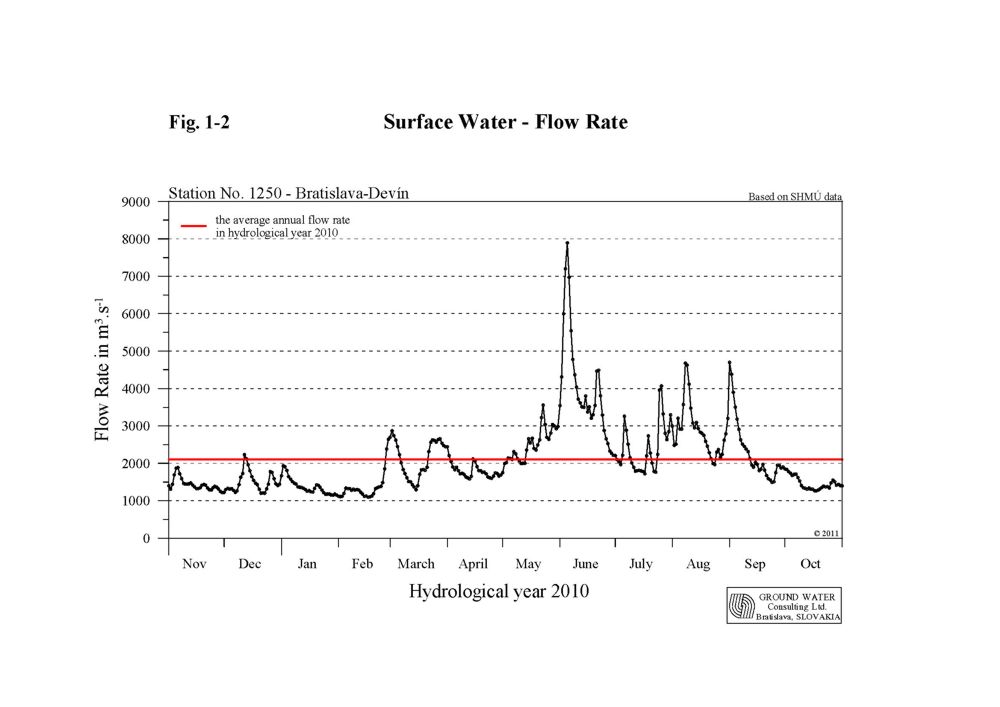
In the intergovernmental Agreement, signed on April 19, 1995 a temporary water management regime was set up. It was agreed that in the case of annual average flow rate of 2025 m3.s-1 in the Danube at the Bratislava-Devín gauging station an annual average of 400 m3.s-1 of water should be discharged into the Danube old riverbed downstream of the Čunovo weir. The actual daily amount of water is governed by the flow rate reaching the Bratislava-Devín profile, taking into consideration the rules of operation described in Annex 2 of the Agreement. The flow rate in the vegetation period, depending on hydrological conditions, should fluctuate between 400 and 600 m3.s-1; in non-vegetation period the flow rate should not be less than 250 m3.s-1. According to the specification agreed in The Joint Annual Report in 2004 in case of flow rates over 5400 m3.s-1 the amount of water above 600 m3.s-1 discharged through the Čunovo weir is not taken into consideration when the annual average is calculated. An additional 43 m3.s-1 of water was agreed in the Agreement to be discharged into the Mosoni branch of the Danube and the right side seepage canal. The gauging station Bratislava-Devín plays a key role in determining the amount of water to be discharged into the Danube old riverbed downstream of the Čunovo weir. The annual minimum flow rate of 1035 m3.s-1 occurred on February 17, 2010, when the daily average flow rate was 1099 m3.s-1. The annual maximum flow rate occurred on June 5, 2010, when it reached 8071 m3.s-1, with a daily average flow rate of 7897 m3.s-1. The annual average flow rate at this station in the hydrological year 2010 reached 2098 m3.s-1, which belongs to average flow rates on the Danube (Table 1-2). Considering the course of water levels and flow rates during the hydrological year 2010 it can be stated that no extraordinary values occurred, however one high flood occurred at the beginning of June. The course throughout the year was typical – low flow rates in the winter period; higher flow rates in the spring and a flood at the beginning of the summer. Extremely dry months did not occurred. February, April, May and July 2010 belonged to dry months. November 2009 and January and October 2010 were moderately water rich months, while December 2009 and March, August and September 2010 belonged to water rich months. Extremely water rich month was the June 2010. Table 1-2: Annual average flow rates
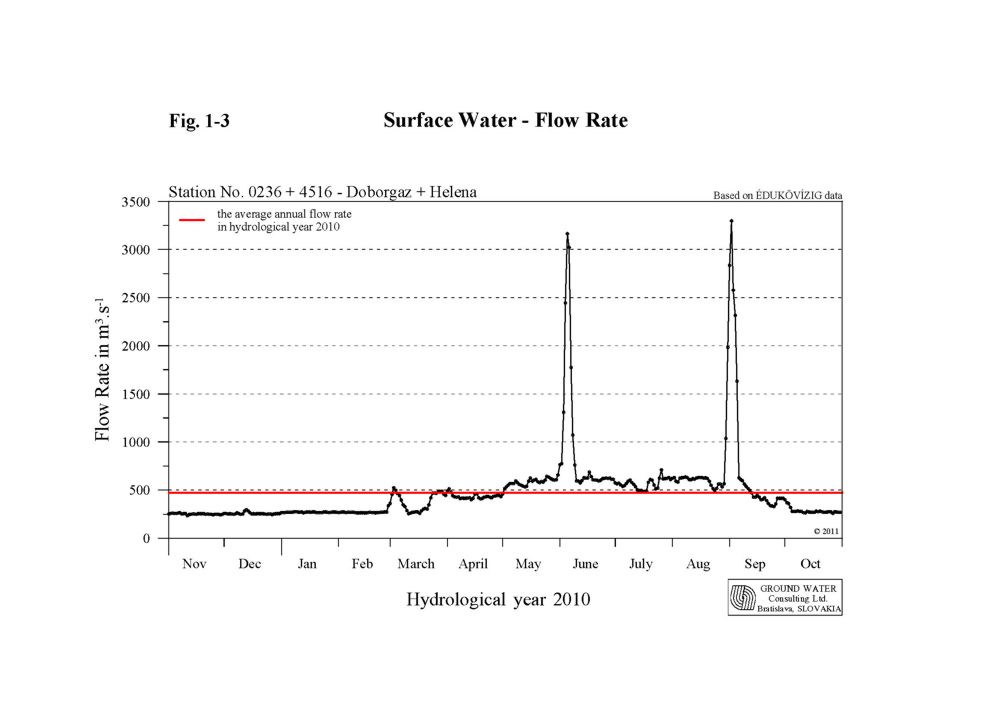
In the hydrological year 2010 the Danube flow regime was typical, similarly to the previous year – i.e. low flow rates in the winter period, increased flow rates during the spring and one big flood wave at the beginning of summer. There were three another discharge waves during the summer period exceeding 4000 m3.s-1. After the last discharge wave at the beginning of September gradual flow rate decrease followed till the end of hydrological year. Flow rates in the winter period (November 2009 till the end of February 2010) mostly fluctuated below the long-term daily average values. However, in the first decade of November, at the beginning of the second decade of December 2009 and at the beginning of January 2010 the daily average flow rates exceeded the long-term daily average values due to higher precipitation amount in the Austrian and German Danube catchments area. The increase of flow rate at the beginning of the second decade of December 2009 was more considerable and the daily average flow rate exceeded 2200 m3.s-1. The lowest daily average flow rates occurred at the end of January and in the mid-February 2010, but mostly they did not decrease below 1100 m3.s-1. The yearly minimum occurred on February 17, 2010, when the flow rate reached 1035 m3.s-1, the daily average flow rate reached 1099 m3.s-1. At the end of February the flow rate considerably increased due to warming (culmination on March 2, 2010 at 2868 m3.s-1). After a temporary decrease the flow rate at the beginning of the third decade of March started to increase again, due to warming, and it reached 2700 m3.s-1. Subsequently during April the flow rates ranged significantly below the long term daily average values. Influenced by the increasing amount of precipitation the flow rate in May started to increase and at the end of month exceeded 3000 m3.s-1. At the beginning of June a big flood wave occurred due to huge amount of precipitation in the German and Austrian Danube catchments area, which fell down at the end of May. The flood wave culminated on June 5, 2010 at 8071 m3.s-1. The flow rate decreased rapidly after the culmination, but thanks to further precipitation another discharge wave occurred at the beginning of the third decade, which culminated on June 21, 2010 at 4742 m3.s-1. Following the discharge wave the flow rate decreased below 2000 m3.s-1. However, at the beginning of July it increased over 3000 m3.s-1, due to heavy rains in the German Danube catchment area (culmination at 3315 m3.s-1 on July 6, 2010). After this culmination the flow rate decreased deeply below the long-term daily average values, and the precipitation amounts during the first half of July were deeply below the average as well. The precipitation amount in the second half of July was considerably over the average, which was reflected in the increase of flow rate as well. At the end of the second decade of July the flow rate increased closely below 3000 m3.s-1 (culmination at 2921 m3.s-1 on July 19, 2010). More considerable increase of flow rate occurred in the mid of the third decade of July, when the flow rate on July 25, 2010 culminated at 4528 m3.s-1. The August was rich in precipitation as well, mainly in the first half of the month. Heavy rains in the German and Austrian Danube catchment area evoked significant increase of flow rate, which culminated on August 8, 2010 at 4972 m3.s-1. Subsequently the flow rate decreased to 2000 m3.s-1, however due to rich precipitation it started to increase again at the end of the month. Culmination of flow rate occurred on September 1, 2010 at 5127 m3.s-1. Due to the rich rainfall since mid-July until late September, the flow rates of the Danube ranged mostly are above the long-term daily average values. At the end of the hydrological year the flow rate oscillated around the long-term daily average values and fluctuated between 1200 and 1500 m3.s-1. The course of flow rates during the hydrological year 2010 at gauging station No. 1250 - Bratislava-Devín is shown in Fig. 1-2. 1.1. Discharge into the Danube downstream of Čunovo weirThe determination of the average daily amount of water discharged into the Danube downstream of the Čunovo weir was based on daily average flow rates determined at gauging stations Doborgaz and Helena (Fig. 1-3). At these stations joint flow rate measurements were performed to determine the flow rate supplied into the Danube old riverbed. The monthly characteristics of the daily average flow rates into the Danube in the hydrological year 2010 were as follows (calculated from daily average data):
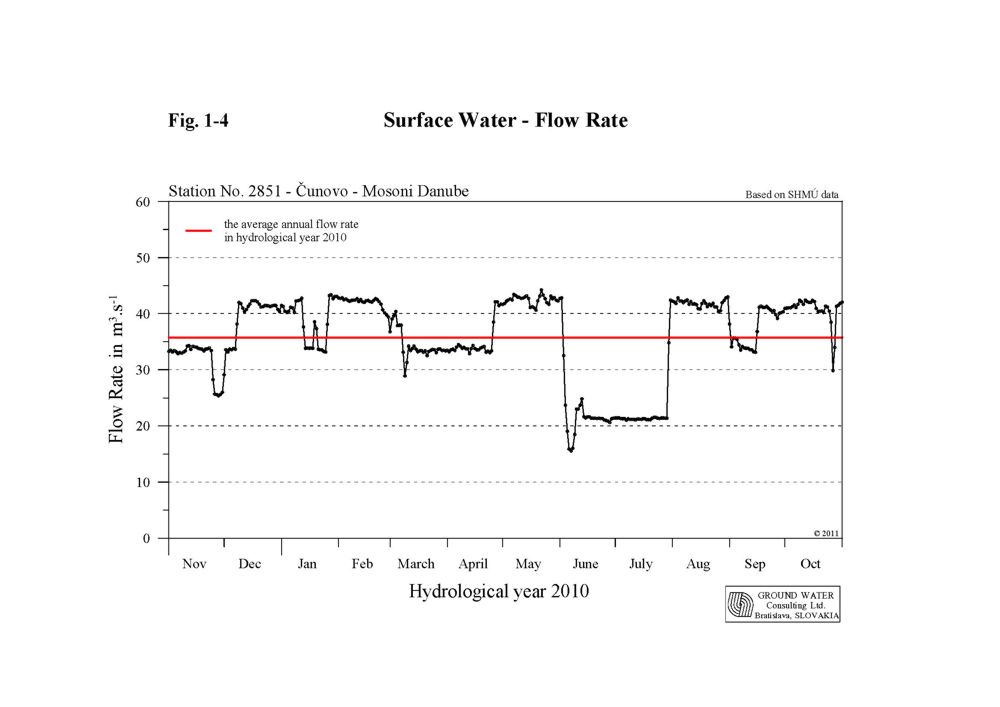
The annual average flow rate in the Danube at the Bratislava-Devín profile in hydrological year 2010 was 2098 m3.s-1. Taking into consideration obligations envisaged in the intergovernmental Agreement, the Slovak Party was obliged to release an annual average discharge of 414.4 m3.s-1 into the Danube riverbed downstream of the Čunovo weir. The total annual average discharge released to the Danube downstream of Čunovo was 472.9 m3.s-1. During the hydrological year 2010 it was necessary to release an amount of water exceeding 600 m3.s-1 into the riverbed downstream of Čunovo due to flood wave in June 2010. Higher discharges were released in the period from June 3 to June 7, 2010 (5 days). Discharges above 600 m3.s-1 occurred at the end of Augusta and beginning of September 2010 as well (7 days), when technical maintenance of the water barrage system was performed. According to the modified method of annual average discharge calculation, accepted in the Joint Annual Report on the environment monitoring in 2004, reduction of the discharge released to the Danube old riverbed was done for 5 days (reduction to 600 m3.s-1). According to this the annual average flow rate in the Danube old riverbed corresponded to 449.0 m3.s-1, which represents 108.3 % of the amount requested by the Agreement. If we would reduce the discharge at the turn of Augusta and September, whereas the higher flow rate was not realized at the request of the Hungarian Party (reduction to 600 m3.s-1 for 7 days), the average annual flow rate in the Danube old river bed would be 417.6 m3.s-1, which also complies to the amount prescribed by the intergovernmental Agreement. The annual average minimum of 235.0 m3.s-1 in the Danube old riverbed was measured on November 11, 2009; the annual average maximum of 3298 m3.s-1 was recorded on September 2, 2010. When evaluating the amount of water discharged to the Danube old riverbed, it can be stated that Slovak Party fulfilled the annual average discharge jointly agreed in the intergovernmental Agreement. Taking into consideration the minimal values prescribed in the Agreement (in the winter period not less than 250 m3.s-1, in the vegetation period at least 400 m3.s-1) it can be stated that considering the accuracy of the measurements (±7 %) discharges below 250 m3.s-1 in the winter period and discharges below 400 m3.s-1 in the summer period did not occurred. 1.2. Discharge into the Mosoni branch of the DanubeAccording to the intergovernmental Agreement, the discharge into the Mosoni branch of the Danube should be 43 m3.s-1, which is composed of both, the discharge released to the Mosoni branch of the Danube through the intake structure at Čunovo, and the discharge through the seepage canal. Discharge measurements are carried out downstream of the intake structure on the Slovak territory at 0.160 rkm and also upstream of lock No. I on the Hungarian territory. The daily average discharges were agreed after the joint evaluation of common discharge measurements performed at both profiles. In this evaluation, data measured just downstream of the intake structure were considered (Fig. 1-4). The monthly characteristics of the amount of water released into the Mosoni Danube through intake at Čunovo in the hydrological year 2010 were as follows (calculated from average daily data):
The annual average discharge was 35.75 m3.s-1. The minimal daily average discharge was 15.54 m3.s-1; the maximal daily average discharge was 44.23 m3.s-1. The flow rate in the right side seepage canal was measured at two sites as well. The first is on Slovak territory at Čunovo; the second is on Hungarian territory at Lock No. II. In the evaluation the data observed at Lock No. II were considered. The monthly characteristics of the flow rates recorded at Lock No. II in the hydrological year 2010 were as follows (calculated from average daily data):
The annual average flow rate was 2.16 m3.s-1. The minimal daily average discharge was 1.03 m3.s-1; the maximal daily average discharge was 4.88 m3.s-1. The monthly characteristics of the total flow rate released into the Mosoni Danube in the hydrological year 2010, consisting of the water amount discharged through the intake structure at Čunovo and water amount flowing in the right side seepage canal, were as follows:
The total annual average flow rate was 37.91 m3.s-1, which represents 88.2 % of the agreed amount. The minimal daily average discharge was 20.15 m3.s-1; the maximal daily average discharge was 46.62 m3.s-1. Relatively low annual average flow rate discharged into the Mosoni branch of the Danube in 2010 was caused by long-term technological breaks due to maintenance and repair works on turbines and the intake object itself (altogether 182 days). Taking into account the technical and hydrological conditions it can be stated that the obligation envisaged in the Agreement was fulfilled. 1.3. Water distribution on the Hungarian territoryCorresponding to the EU Water Framework Directive waters on the Hungarian territory belong to heavy modified (the Danube old riverbed, the Upper, Middle and Lower parts of the Mosoni Danube and the river branches on the flood-protected area) and artificial (right side seepage channel) water bodies. The goal of the water distribution on the Hungarian side is to provide a continuous water supply into the inundation area, into the river branches on the flood-protected area and into the Mosoni Danube. 1.3.1. Water supply into the inundation areaRiver branches in the inundation area on Hungarian side can be supplied by water from two sources: a) Through three openings in the Danube riverbank, by manipulating the water level increased by the submerged weir and the Dunakiliti dam. The total inflowing discharge is measured at Helena profile. b) From the seepage canal through lock No. V. These two sources are summed to get the total amount. The criterions for regulation of water distribution were set up to satisfy the needs determined at right-side river branch system revitalization planning. The reference status was determined at the end of nineties with the involvement of stakeholders. Taking various needs into consideration it reflects the hydrological regime of fifties. Creation of water levels characteristic for this period was targeted in the arms of inundation area. The flow rate was determined as a function of flow rate entering the Bratislava - Devín profile. The environmental status of Szigetköz in the reference period was determined as the most similar to a state, which can be sustained on a long run, and serves adequate information on riverbed morphology and hydro-geological regime for determining the reference status. This is in full harmony with recommendations of the Water Framework Directive and goals of the River Basin Management. Joint discharge measurements by both Parties were performed at the Helena profile. The measurements were jointly evaluated and the daily average flow rate data were accepted. The monthly flow rates characteristics at Helena profile in the hydrological year 2010 were as follows (calculated from daily average data):
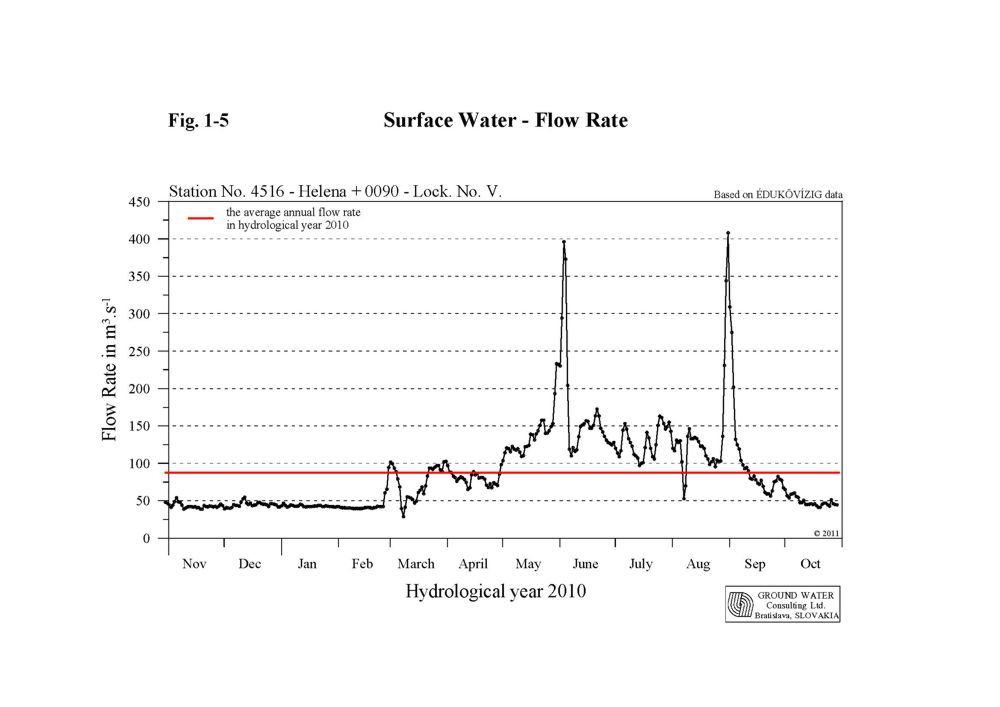
The annual average flow rate was 75.02 m3.s-1. The minimal daily average discharge was 9.30 m3.s-1; the maximal daily average discharge was 408.0 m3.s-1. The monthly flow rates characteristics at lock No. V in the hydrological year 2010 were as follows (calculated from average daily data):
The annual average flow rate was 12.56 m3.s-1. The minimal daily average discharge was 0.00 m3.s-1; the maximal daily average discharge was 34.40 m3.s-1. The monthly flow rates characteristics of the total amount of water released into inundation area in the hydrological year 2010 (Fig. 1-5), consisting of the water amount flowing through the Helena profile and water amount flowing through the Lock. No. V in the right side seepage canal, were as follows (based on average daily data):
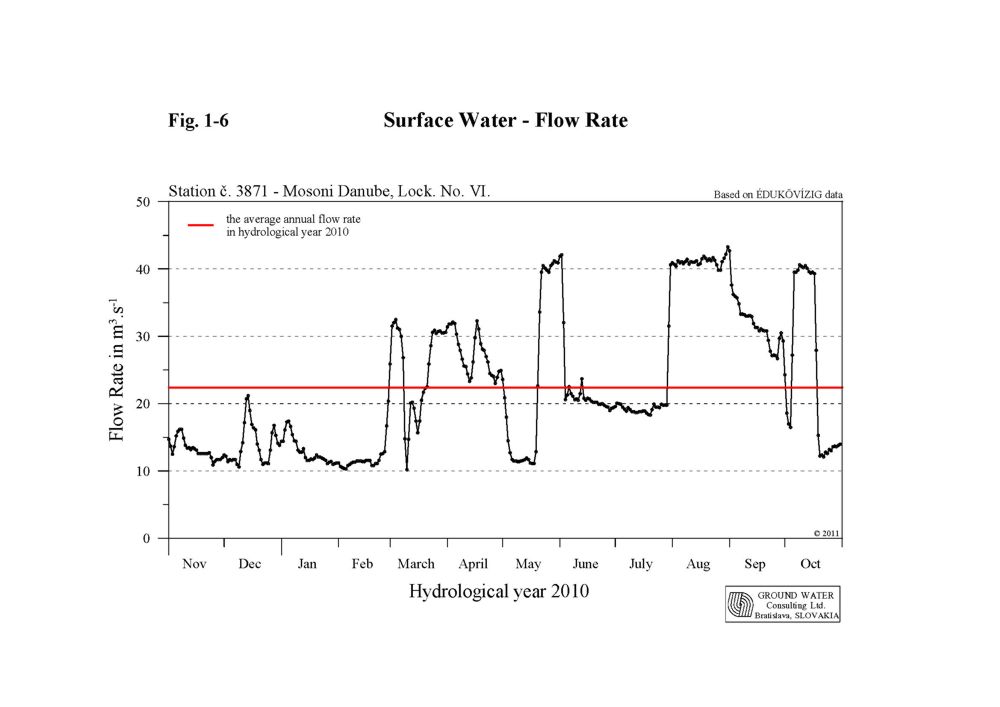
The total annual average flow rate supplied into river branches in the inundation area was 87.58 m3.s-1. The minimal daily average discharge was 28.87 m3.s-1; the maximal daily average discharge was 408.0 m3.s-1. In 2010 artificial flooding of the inundation area on both sides at the same time was not realized. Natural flood at the beginning of June increased the water levels in the Danube old riverbed and in the right side river branch system. The water amount discharged and distributed in the Hungarian river branch system created water levels characteristics for the reference status in the upper part of the inundation area – in the Tejfaluszigeti river branch system. In the middle part – Cikolai and Bodaki river branch systems, the water levels were slightly above the reference status. Water levels in the Ásványi river branch systems corresponding to the reference status cannot be achieved without water supply system. Based on the above mentioned it can be stated that for the low and medium flow rate periods the target values of the reference status were fairly well achieved. However, in the lower part of the river branch system reference water levels cannot be achieved; technical measures are needed for achieving the desired status. 1.3.2. Water supply into the Mosoni DanubeThe water supply into the Mosoni Danube is secured from the seepage canal through the lock No. VI (Fig. 1-6). The flow rate is measured at the profile downstream of the lock. The monthly characteristics of flow rates through the lock No. VI in the hydrological year 2010 were as follows (calculated from average daily data):
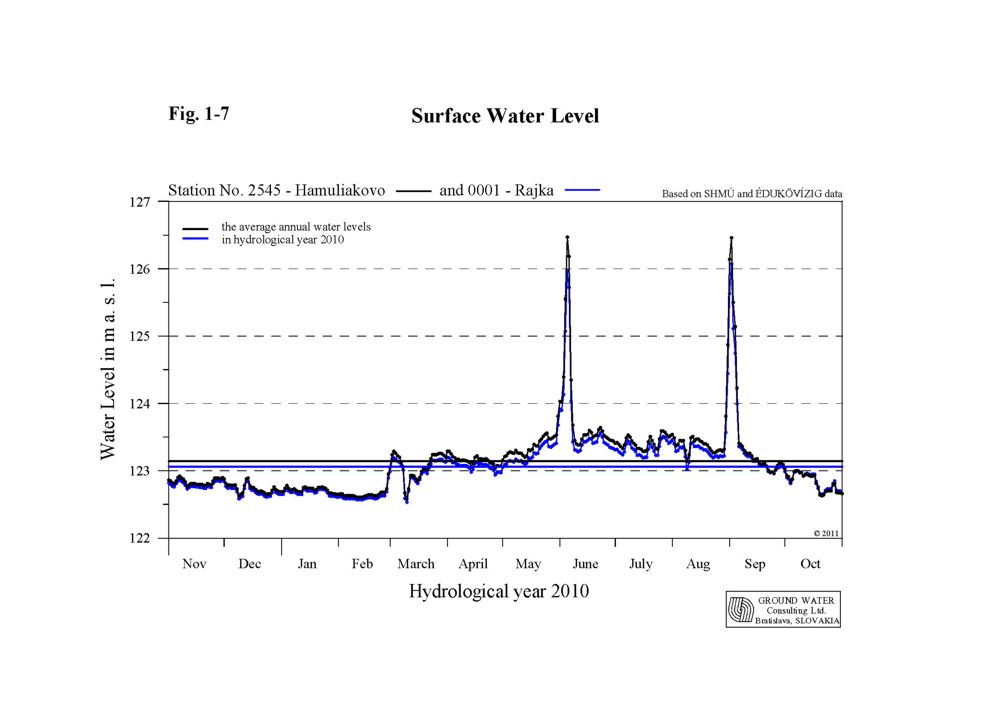
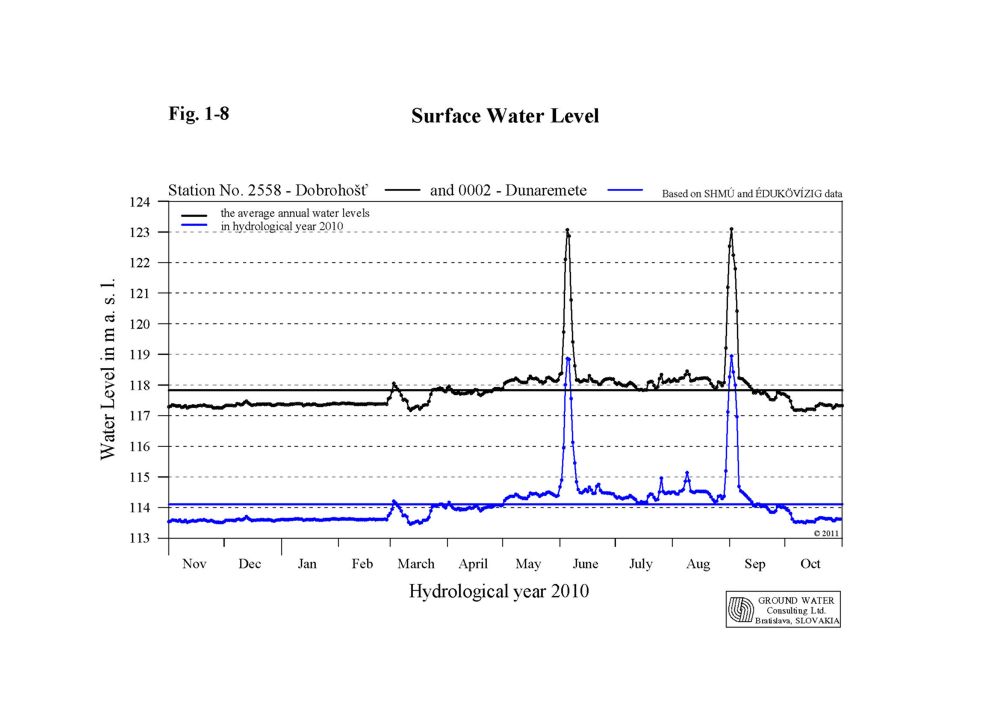
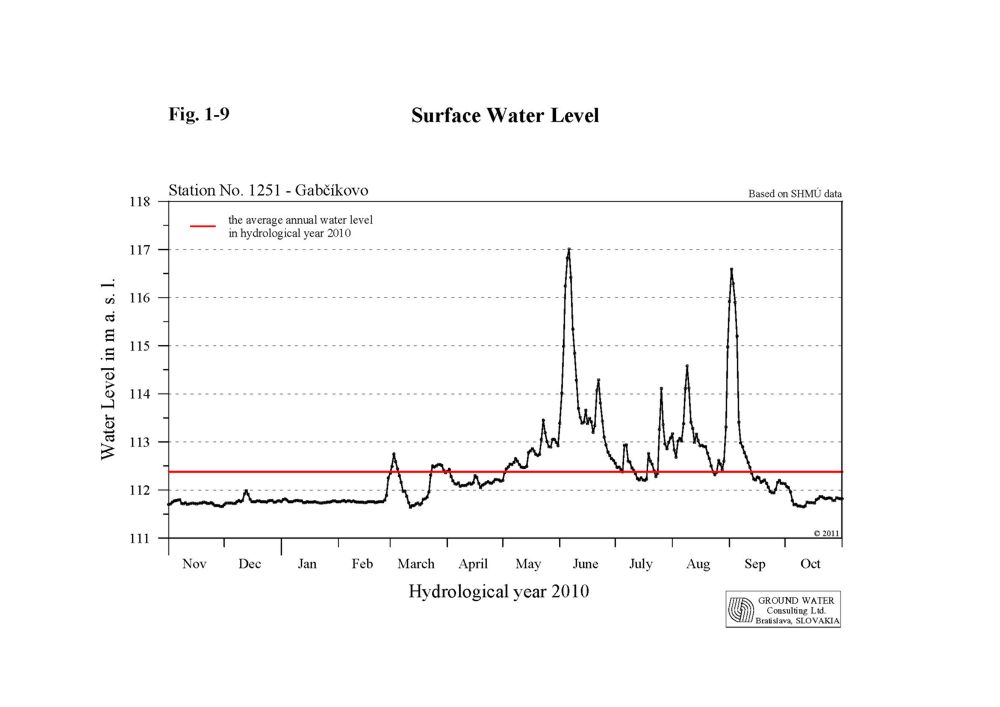
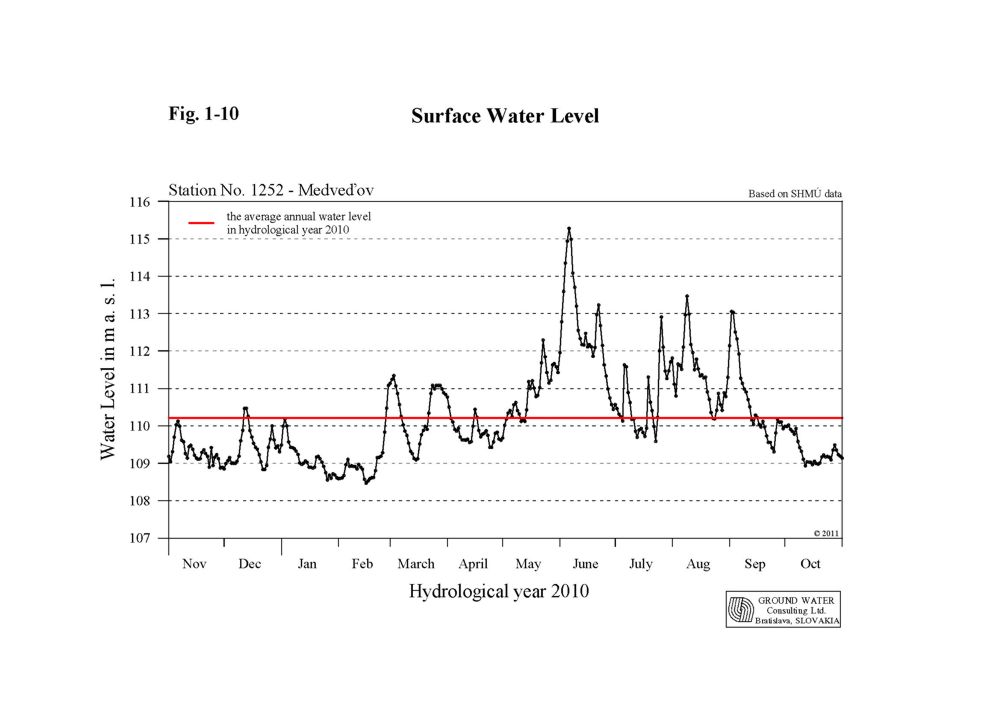
The annual average flow rate in the Mosoni Danube at lock No. VI. was 22.43 m3.s-1. The minimal daily average discharge was 10.20 m3.s-1; the maximal daily average discharge was 43.30 m3.s-1. The water supply regime is regulated by rules of operation and follows the Danube’s water regime. In non-vegetation period a low water period was simulated in the Mosoni Danube. This was realised by redirecting a greater part of the water amount into the inundation area. 1.4. The Danube water level characteristics on Čunovo-Vámosszabadi stretchThe Danube stretch between Čunovo and Vámosszabadi can be divided into four different sections according to the prevailing influence. These sections can be characterised by data obtained from the following gauging stations: Rajka and Hamuliakovo, Dunakiliti, Doborgaz and Dobrohošť, Dunaremete and Gabčíkovo. Vámosszabadi and Medveďov. The characteristics of four sections on the Čunovo - Vámosszabadi stretch in hydrological year 2010 are the following:
|
|||||||||||||||||||||||||||||||||||||||||||||||||||||||||||||||||||||||||||||||||||||||||||||||||||||||||||||||||||||||||||||||||||||||||||||||||||||||||||||||||||||||||||||||||||||||||||||||||||||||||||||||||||||||||||||||||||||||||||||||||||||||||||||||||||||||||||||||||||||||||||||||||||||||||||||||||||||||||||||||||||||||||||||||||||||||||||||||||||||||||||||||||||||||||||||||||||||||||||||||||||||||||||||||||||||||||||||||||||||||||||||||||||||||||||||||||||||||||||||||||||||||||||||||||||||||||||||||||||||||||||||||||||||||||||||||||||||||||||||||||||||||||||||||||||||||||||||||||||||||||||||||||||||||||||||||||||||||||||||||||||||||||||||||||||||||||||||||||||||||||||||||||||||||||||||||||||||||||||||||||||||||||||||||||||||||||||||||||||||||||||||||||||||||||||||||||||||||||||||||||||||||||||||||||||||||||||||||||||||||||||||||||||||||||||||||||||||||||||||||||||||||||||||||||||||||||||||||||||||||||||||||||||||||||||||||||||||||||||
