PART 2
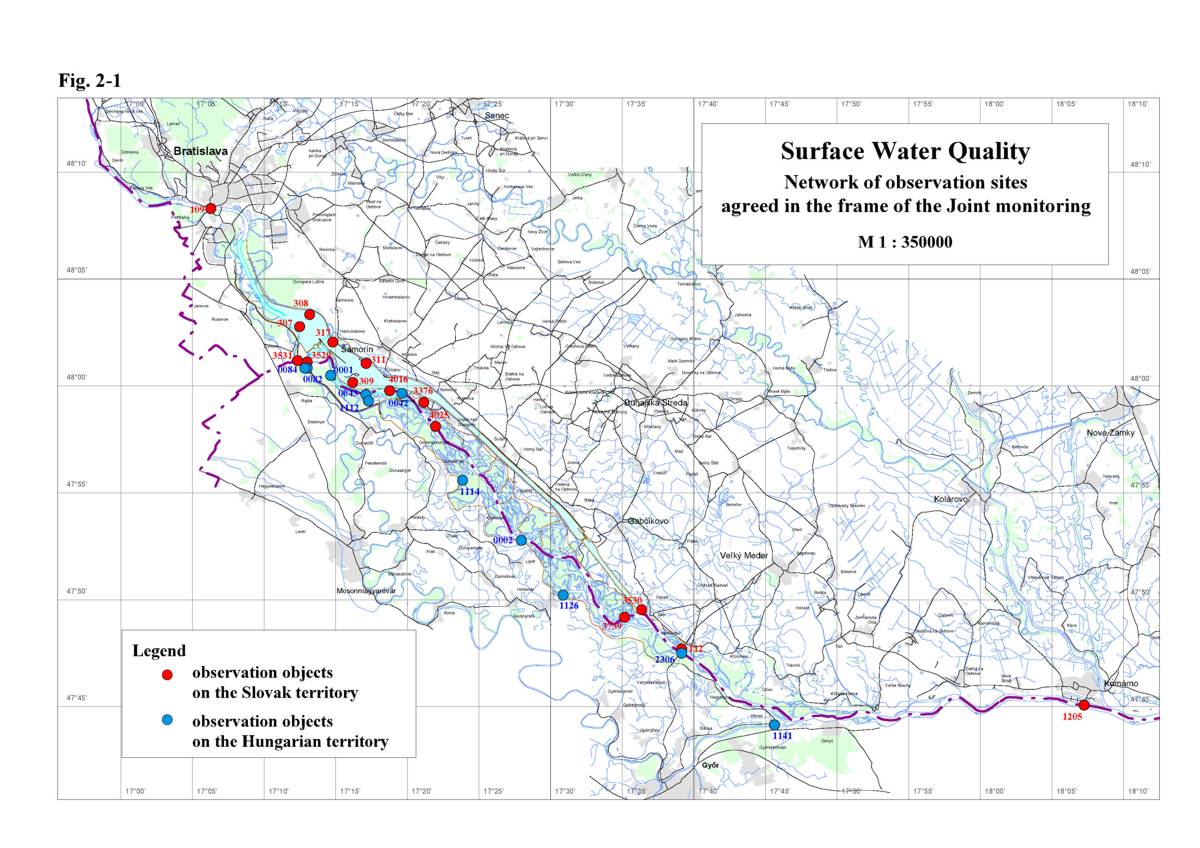
Surface Water QualityThe surface water quality measurements in the year 2009, in accordance with the Agreement, were carried out at 15 monitoring sites on Slovak territory and at 11 monitoring sites on Hungarian territory - Table 2-1, Fig. 2-1. At all monitoring sites the influence of measures, described in the Agreement, on surface water quality was observed. Main factors, which could influence the water quality, are: the backwater effect upstream of the submerged weir, the increased discharges into the Danube downstream of Čunovo dam and into the Mosoni branch of the Danube, the water supply into the right side river arm system, and morphological changes in the riverbed. Table 2-1: List of monitoring sites
* - jointly observed monitoring sites Surface water quality and sediment quality data for the agreed monitoring sites, and time series diagrams of individual surface water quality parameters, are given in the Slovak and Hungarian National Reports on the Environment Monitoring in 2009 or its Annexes. Figures in this Joint Report represent the data of selected parameters at selected monitoring sites. The data at jointly observed sites were not harmonized in 2009, so the national data were taken into account. The sampling site No. 1205 – Komárno was not observed in 2009. Table 2-2: Agreed limits for surface water quality classification
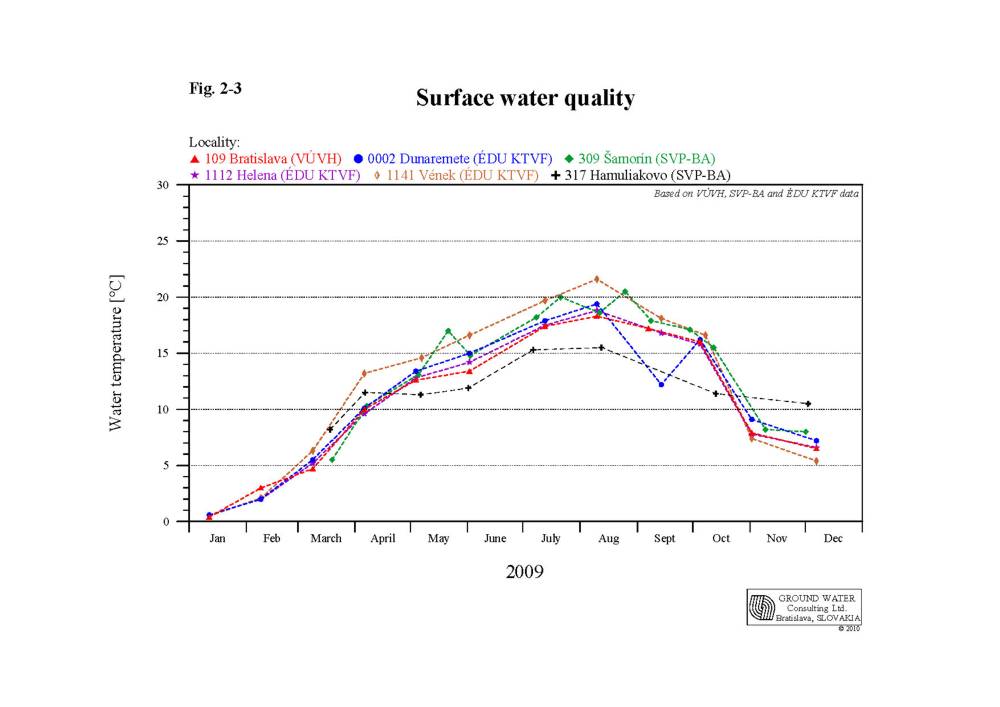
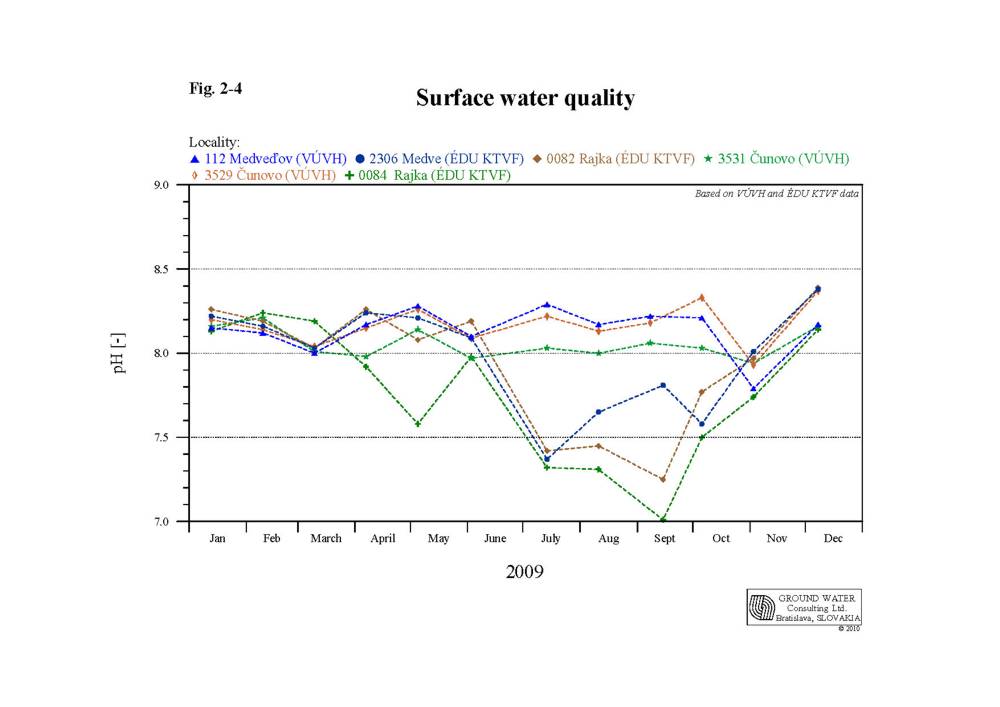
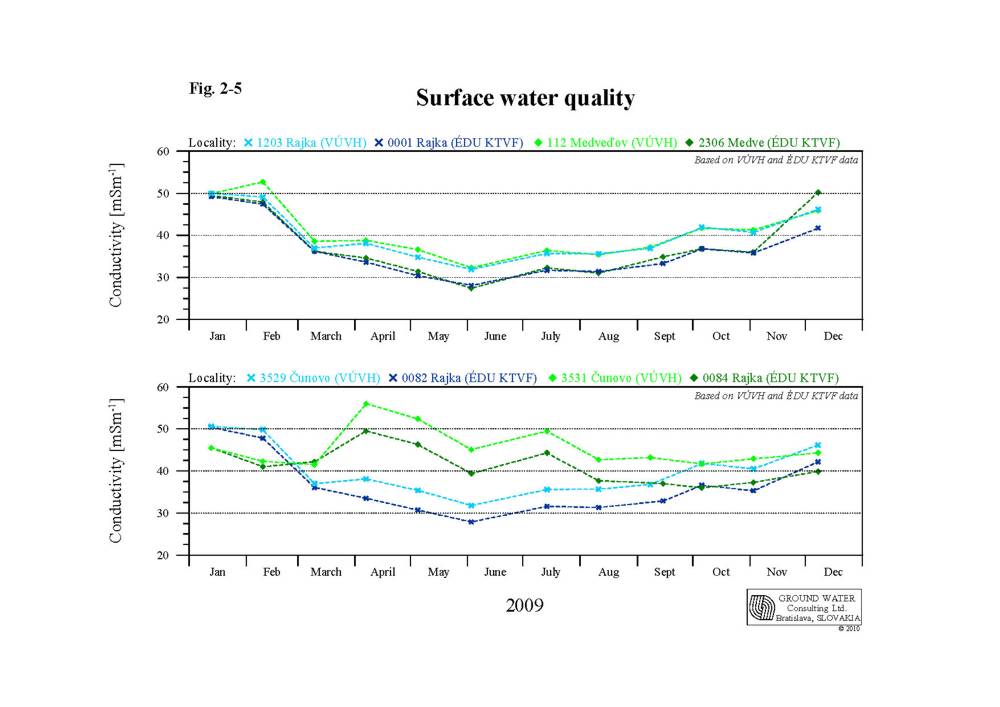
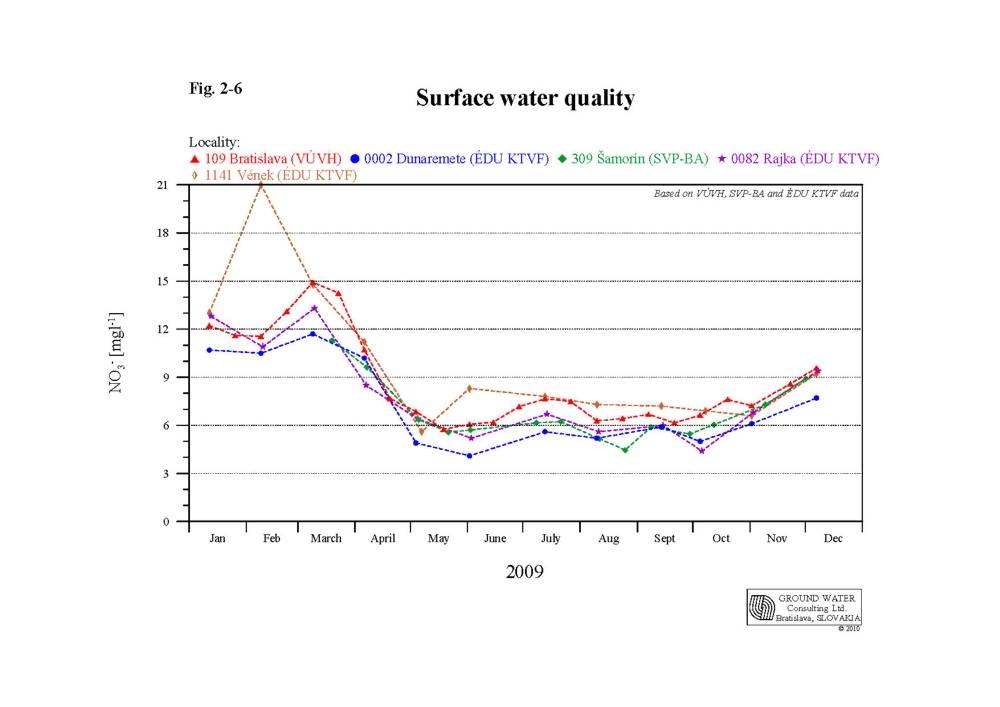
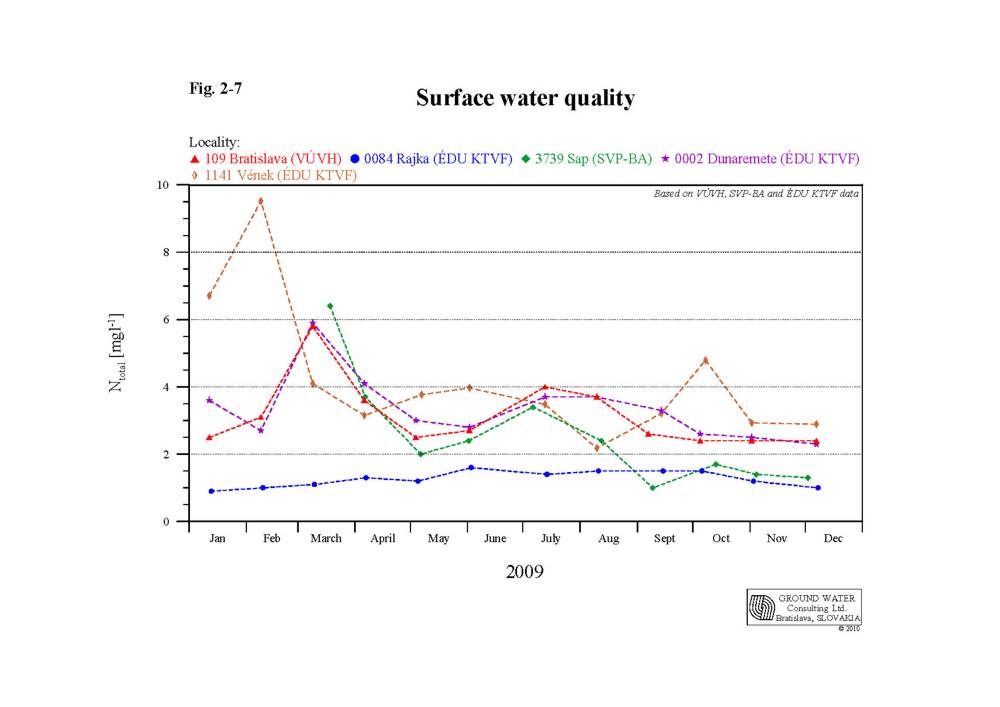
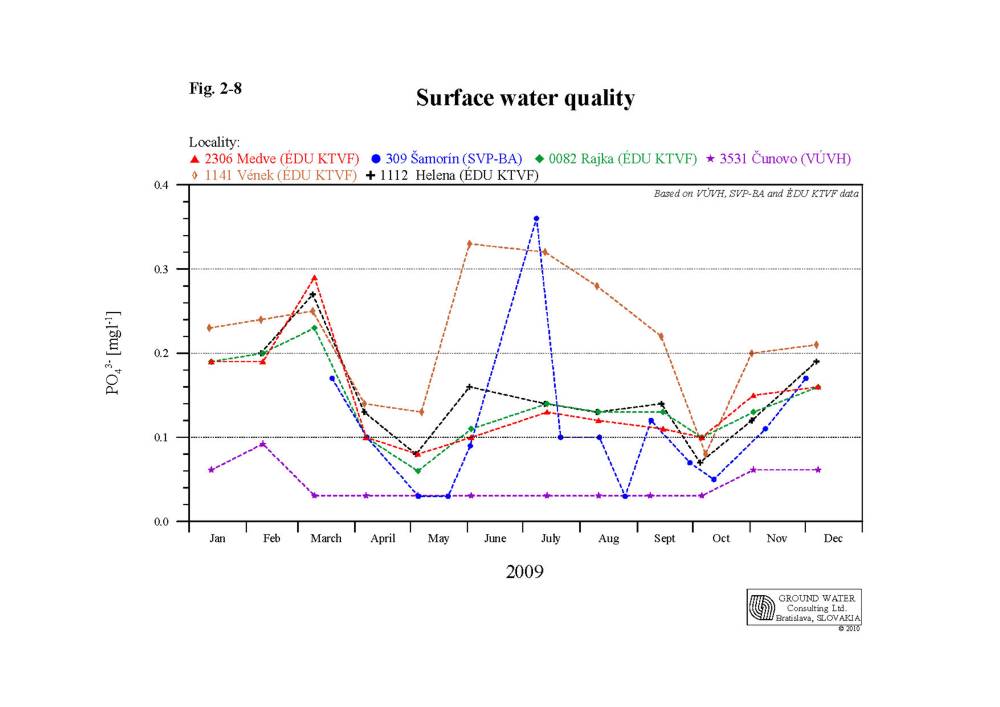
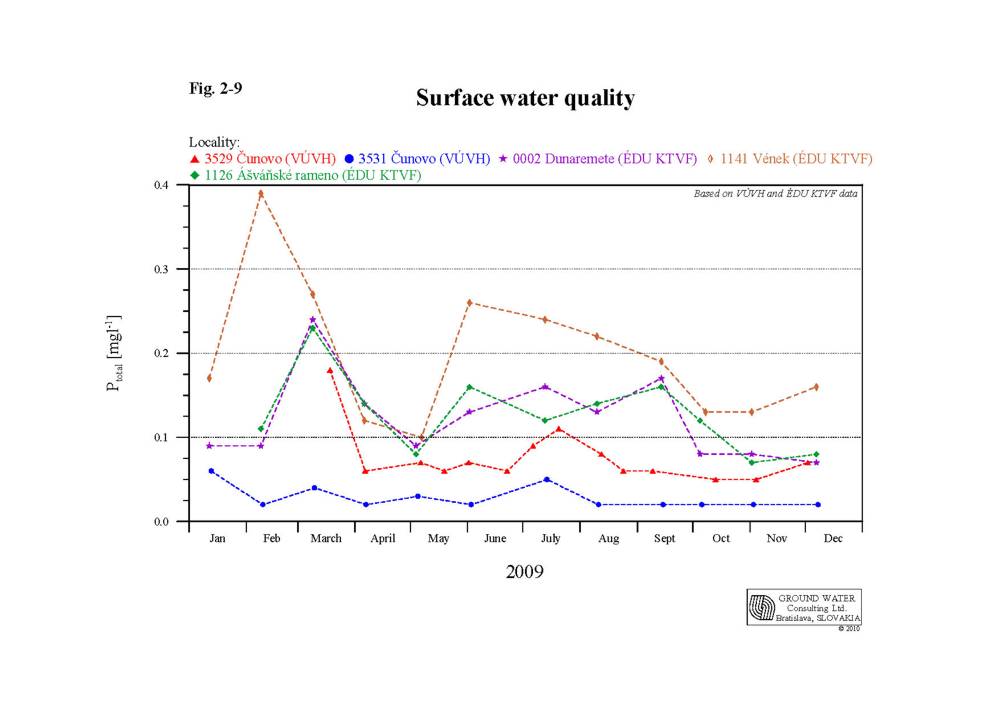
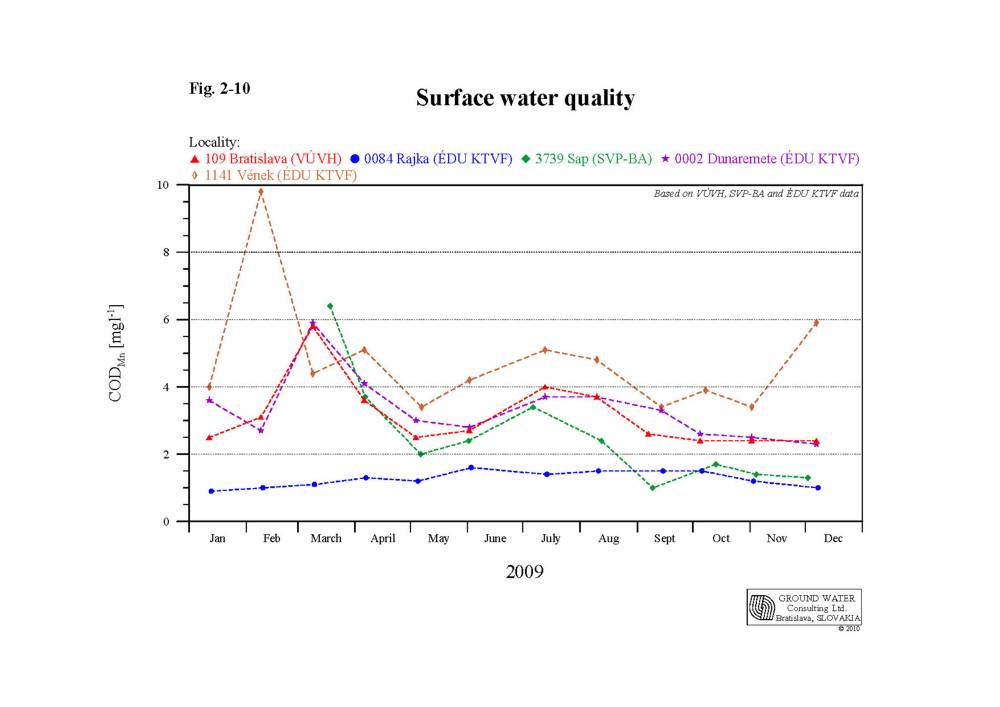
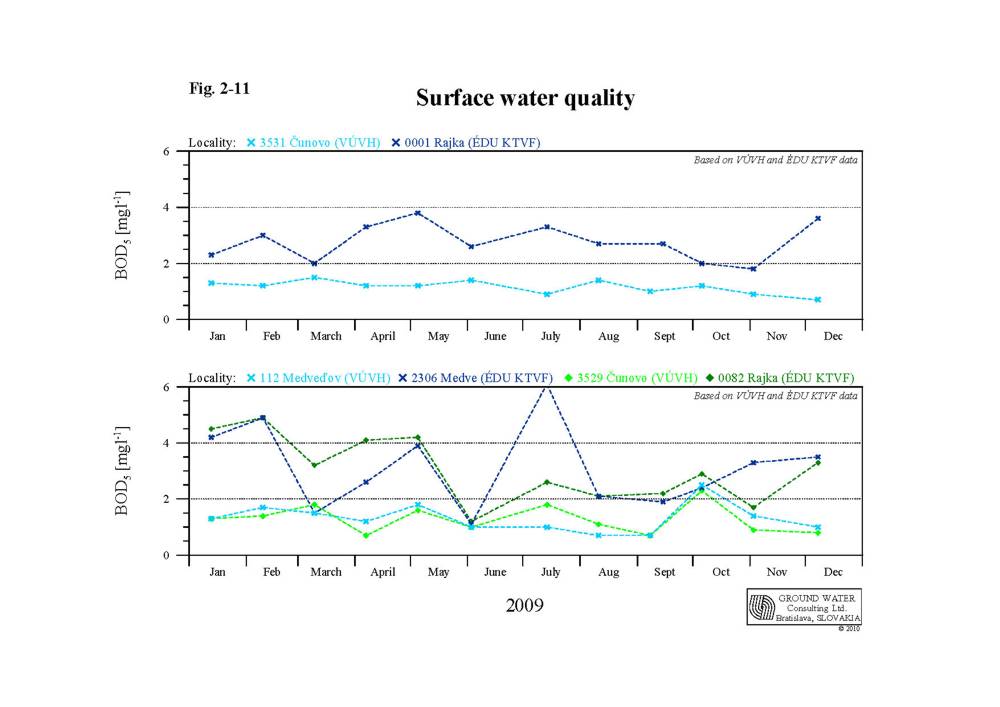
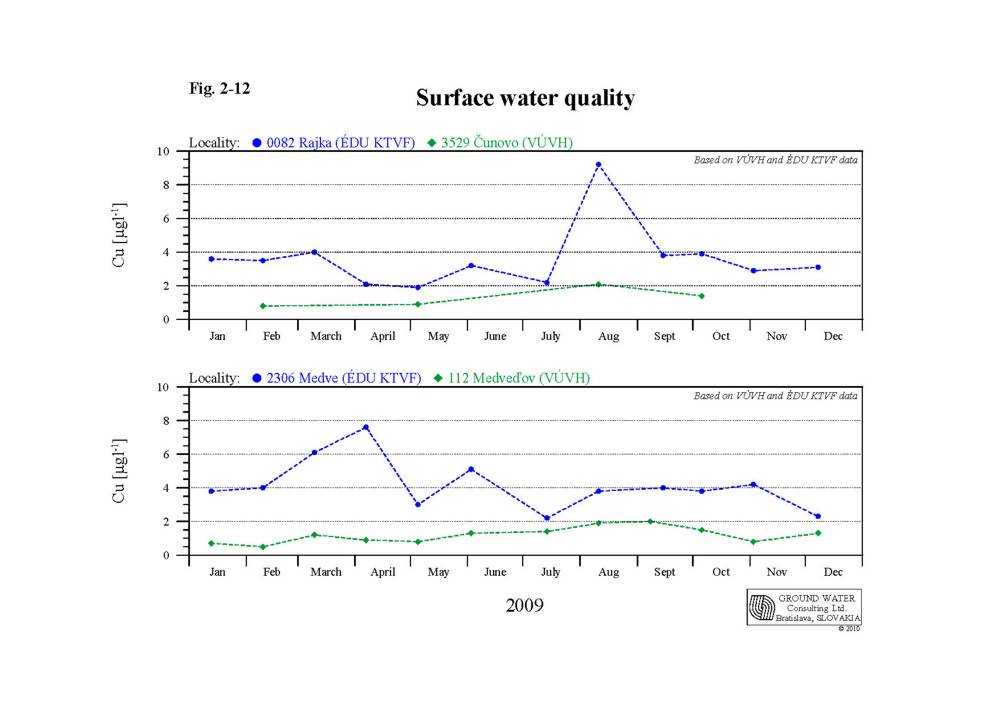
In Table 2-2 the limit values for surface water quality classification are given, which were accepted by the Slovak-Hungarian Trans-boundary Water Commission (“Surface water quality observation directive for Slovak-Hungarian boundary waters and for extended water quality monitoring on the Danube”) and were used in the surface water quality evaluation in 2009. Since 2007 the evaluation relates to the calendar year. The evaluation of hydro-biological elements was realized according to the methodology agreed within Slovak-Hungarian Trans-boundary Water Commission and according to the national methods elaborated in accordance with Water Framework Directive. 2.1. General evaluation of the actual yearThe year 2009 from the water richness point of view belonged to water rich years. The average daily flow rates in individual months were often at level of 2000-3000 m3s-1. As a consequence of rich precipitations in Alps at the end of June and beginning of July big flood wave occurred, when the maximal flow rate on June 26, 2009 at Devín reached 8288 m3s-1. At the beginning of July the flow rates were still above 6000 m3s-1. Higher flow rates in the year 2009 were recorded in the second half of July, in August and they also occurred at the beginning of September. They fluctuated in a range 3000-4000 m3s-1. The flow rates decreased to the level typical for this period during autumn and at the beginning of winter period. Temperatures above the average characterized climatic conditions in 2009 in April, and slightly above the average in September. These periods were also characteristic with precipitation amounts deeply below the average and even zero precipitation amounts. Precipitations above the average values occurred since the second half of January till the end of March, and in the second half of June, when the flood wave occurred. Precipitations above the average occurred during July and August as well. Above-mentioned hydrological and climatic conditions affected the surface water quality in the evaluated year. 2.2. Basic physical and chemical parametersWater temperature The water temperature fluctuation in the year 2009 was similar at the individual sampling sites. Its course showed seasonal character. The maximal values during the summer did not exceed the maximal values from previous year. At particular sampling sites the maximal values occurred in July and August, the minimal values occurred in January and February. The highest water temperature 22.2 ºC was measured in the right side river branch system at sampling site No. 1126 in Ásványi river branch. The water temperature in the Danube fluctuated from 0.2 to 20.4 ºC. The temperatures in the reservoir were similar as in the previous year (the maximal measured temperature was 20.5 ºC at sampling site No. 309 on the right side of the reservoir). Contrary to the last several years the water temperature in Mosoni Danube at Vének did not reached the highest values; it fluctuated maximally up to 21.6 °C. The most balanced temperature was characteristic for the water in the left side seepage canal (sampling site No. 317) where it fluctuated from 8.2 to 15.5 °C. The spread of temperatures in the right side seepage was slightly higher and fluctuated from 3.8 to 16.9 °C. Higher temperatures (above 15 °C) occurred similarly to previous year from May and lasted till October. The course of the water temperature at selected sampling sites is documented on Fig. 2-3. pH Higher pH values occur in seasons corresponding to periods of increased assimilation activity of phytoplankton. In the evaluated year it was in April and May, at several sampling sites also in August, at the beginning of September or at the beginning of October during warming up. The pH values of the Danube water in the evaluated period fluctuated in the range from 7.05 to 8.48. It was similar in the Mosoni Danube and in the river branch system. In the reservoir the pH values fluctuated in a narrower range from 7.83 to 8.63, but the values varied more in comparison to the previous year. The highest value of 8.63 was recorded at the end of August at sampling site No. 309 in the lower part of the reservoir. The course of pH values in seepage canals was balanced and the pH values varied from 7.01 to 8.24. When comparing the monitoring data it can be stated again that there are big differences between the Slovak and Hungarian data. While the pH values obtained by the Slovak Party vary in rather narrow ranges, ranges recorded by the Hungarian Party are much wider and the spread of data is higher. This difference is distinct particularly at jointly observed sampling sites (Fig. 2-4). Specific electric conductivity The specific electric conductivity of surface water refers to the dissolved salts content of mineral origin. It has a seasonal character; values are higher in winter months, lower during the summer. Minimal values in the evaluated period were registered at the end of May and at the beginning of June, depending on the sampling site. The highest values were recorded at sampling site no. 1141 in the Mosoni Danube at Vének, but contrary to the previous years it was not during the whole year. The highest measured conductivity value reached 70.2 mS.m-1 (December 2009). The course of specific conductivity at sampling sites in the Danube followed the conductivity values at the sampling site (No. 109) in Bratislava. The conductivity values fluctuated between 27.4 and 54.8 mS.m-1. The conductivity in the reservoir, in the Mosoni Danube at Čunovo/Rajka, in the river branch system and in the tailrace channel at Sap varied in narrower ranges. The dissolved solids content in seepage canals was stable. The electric conductivity values, similarly to the previous years, fluctuated in narrow range and the lowest spread of values (41,1-48,8 mS.m-1) is typical for the water in the left side canal at Hamuliakovo (sampling site No. 317). In general it can be stated that the conductivity values measured by the Slovak Party are higher that values recorded by the Hungarian party, what can be seen particularly at jointly observed sampling sites (Fig. 2-5). Suspended solids The suspended solids content is closely related to the flow rate. It increases at flood waves and higher values are characteristic mainly for the summer period. In comparison with the previous year higher values were recorded on most of sampling sites. The highest content of 260 mg.l-1 was recorded at the end of June 2009 at sampling site in Bratislava. It is probably related to the flood wave, which occurred at the end of June and at the beginning of July (flow rates above 6000 m3s-1); similarly as the high concentrations in the reservoir recorded at the beginning of July – 136 mg.l-1 at sampling site No. 309 and 119 mg.l-1 at sampling site No. 307. Besides these values the suspended solids content in the Danube and in the reservoir ranged up to 94 mg.l-1. Contents measured in the Mosoni Danube at Čunovo/Rajka (sampling sites No. 3531/0084) were lower and they fluctuated in a range from 2 to 41 mg.l-1. At sampling site No. 1141at Vének the suspended solid content was higher than in the year 2008, and it ranged from 14 to 99 mg.l-1 (the maximum in 2008 was 44 mg.l-1). The suspended solids content in seepage canals, regarding the origin of water, was low. In the left side seepage canal (No. 317) no measured concentration exceeded the detection limit value of the applied analytical method (9.5 mg.l-1). In the right side seepage canal the content fluctuated from 2 to 28 mg.l-1. The suspended solids in the river branch system reached a maximal content of 91 mg.l-1. When analysing changes in suspended solids content at sampling sites in the Danube, it can be stated that the suspended solids content downstream of reservoir (at sampling site No. 112 in Medveďov) during flood waves is lower than in the Danube at Bratislava, which refer to settling effect of the reservoir. Iron The amount of suspended solids influences the iron content in surface water, therefore higher iron content occurs in samples taken during higher discharges. The iron concentrations in the Danube water in 2009 were higher than in the previous year, fluctuated in the range from 0.07 to 0.95 mg.l-1, with one higher value at sampling site No. 109 in Bratislava recorded in August (1.34 mg.l-1) and one higher value at sampling site No. 112 in Medveďov measured in September (1.23 mg.l-1). The iron content in Mosoni Danube at Rajka (sampling site No. 0082) was lower than in the Danube and it varied from 0.06 to 0.32 mg.l-1. At sampling site No. 1141 at Vének the iron content in February and March reached higher values (2,63 and 2,02 mg.l-1), all remaining values fluctuated in the range from 0.16 to 0.75 mg.l-1. In the river branch system the iron concentrations fluctuated from 0.04 to 0.74 mg.l-1, with one higher value of 1.07 mg.l-1 recorded at sampling site No. 1112 (Helena river branch) in March. In the reservoir the iron content varied from 0.07 to 0.91 mg.l-1. The lowest iron concentrations were characteristic for the seepage water and they were similar as in the previous year. In the left side seepage canal they varied from 0.06 to 0.13 mg.l-1, in the right side seepage canal they were slightly higher, up to 0.32 mg.l-1. Manganese At sampling sites in the Danube, left side seepage canal and in the right side river branch system the concentrations of manganese in the evaluated year fluctuated in the range from <0.005 to 0.12 mg.l-1. The manganese content in the reservoir was lower, maximally up to 0,09 mg.l-1. The highest contents in the evaluated year were recorded at sampling sites in the Mosoni Danube and in the right side seepage canal at Rajka (No. 0082 and 0084) where they varied in the range from <0.02 to 0.17 mg.l-1. Generally it can be stated that the manganese content in the evaluated year was higher in comparison with the year 2008. Basic physical and chemical parameters - summary The basic physical and chemical parameters in the Danube and in the river branch system connected to the Danube main riverbed show seasonal variations and some of them predominantly depend on the flow rate. The fluctuation of basic physical and chemical parameters in the Mosoni Danube and in the seepage canal reflects the different characteristics of these water bodies. The water quality in the Mosoni Danube is influenced by the Danube water and at Vének sampling site by its affluents and wastewater from Győr. The water in the seepage canal is influenced mainly by the leaking ground water. In comparison with the year 2008 lower values of water temperature were recorded, the conductivity and pH values were similar as in the year 2008. The iron and manganese concentrations and the suspended solids content were influenced by the actual hydrological regime and they were higher in comparison with the previous year. 2.3. Cations and AnionsThe quantitative ratio of the surface water ionic composition in the evaluated year 2009 showed high stability, just as in previous years. The seasonal fluctuation of individual ions content followed the changes of conductivity. Changes of dissolved solids content are related to the flow rate fluctuation in the Danube. Compared to the long-term measurements the values of basic cations and anions have not changed. The development of cations and anions concentrations at individual sampling sites was similar. Higher content of salts is characteristic for the Vének sampling site on the Mosoni Danube due to its affluents and cleaned wastewater from Győr. The average values of sodium, potassium, chloride and sulphate ions at Vének exceeded the average values registered on the other sampling sites. The most stable ionic composition was characteristic for the seepage water. 2.4. NutrientsAmmonium ion Higher concentrations of ammonium ion in the evaluated year on most of sampling sites occurred from January to March. The highest concentration of 0.348 mg.l-1 was recorded in February at sampling site No. 109 in Bratislava. Since April the ammonium ion concentrations were low in the Danube and reached maximally 0.050 mg.l-1, however the ammonium ion concentration in the Danube old riverbed reached 0.115 mg.l-1. Ammonium ion contents in the reservoir were similar as in the previous year and fluctuated in the range from <0.013 to 0.141 mg.l-1. Higher values occurred at sampling site No. 309 in the lower part of the reservoir. In the Mosoni Danube at Vének higher value of 0.150 mg.l-1 occurred in December as well, contrary to the other sampling sites. The lowest contents of ammonium ion were registered at sampling site No. 3531/0084 in the right side seepage canal at Čunovo/Rajka, where they fluctuated from <0.020 to 0.064 mg.l-1. Nitrates Nitrates concentrations showed seasonal fluctuation, which was less noticeable in seepage canals. In winter months nitrates concentrations reached higher values, afterwards they gradually decreased; minimal values were registered from May to October and at the end of the year slightly increased again. Seasonal fluctuation is related to the vegetation period and consumption of nutrients in the water. In the vegetation period the nutrient content mostly decreases to the half of the winter amount. Except the seepage canals the course of nitrates concentration at individual sampling sites was similar. Higher values occurred mainly in the main riverbed, in the Mosoni Danube and in the reservoir (maximally up to 14.9 mg.l-1, with one higher value at Vének, when it reached 21.0 mg.l-1). Slightly lower values were measured at sampling sites in the Danube old riverbed, in the tailrace canal at Sap and in the river branch system (maximally up to 13.3 mg.l-1). Low concentrations of nitrates were characteristic for the seepage water and varied in a narrow range from 2.8 to 8.5 mg.l-1. In comparison with the previous year the nitrates concentrations were higher at most of the sampling sites. The course of nitrates concentrations at selected sampling sites is shown on Fig. 2-6. Nitrites The nitrites ion concentrations are considered as a temporary product of nitrification and denitrification processes. Excluding the reservoir and seepage canals the nitrites concentrations showed a seasonal variation on the other sampling sites, their course was similar. The concentrations fluctuated in the range from <0.007 to 0.151 mg.l-1. The nitrites content in the reservoir was varying during the whole year and it fluctuated in the range from <0.020 to 0.110 mg.l-1. In the right side seepage canal the nitrites values were balanced and their content fluctuated in a narrow range from 0.023 to 0.062 mg.l-1. In general it can be stated that the nitrites content in the evaluated year was slightly higher in comparison to the previous years. Total nitrogen The total nitrogen content is predominantly affected by fluctuation of nitrate-nitrogen and organic-nitrogen concentrations, which results from the quantitative ratio of nitrogen forms. The total nitrogen belongs to water quality parameters with significant seasonal fluctuation. Maximums are reached in colder months and minimums in warmer months (during the vegetation period). The tendency of fluctuation of the total nitrogen in the evaluated year in the Danube, in the Mosoni Danube at Čunovo/Rajka, in the tailrace canal at Sap, in the left side river branch system and in the reservoir was similar. Concentrations varied in the range from 1.26 to 5.24 mg.l-1. Total nitrogen content in the right side river branch system and in the Danube old riverbed was higher and it varied from 1.23 to 6.73 mg.l-1. The highest concentrations were documented in the Mosoni Danube at sampling site No. 1141 at Vének and they fluctuated from 2.18 to 9.52 mg.l-1. The seasonal fluctuation in the seepage canals is less remarkable and regarding the origin of the water the total nitrogen content is lower (Fig. 2-7). In the left side seepage canal (sampling site No. 317) in the evaluated year it fluctuated in a narrow range from 1.00 to 2.16 mg.l-1. In the right side seepage canal at Čunovo/Rajka (sampling site No. 3531/0084) the Slovak Party recorded values even within narrower range (from 1.10 to 1.88 mg.l-1), but the Hungarian Party measured values above 4.0 mg.l-1 in the first two months. In general the total nitrogen contents at particular sampling sites in the evaluated year were higher in comparison to the previous years. Phosphates Higher values of phosphates concentrations are characteristic for colder months and during higher flow rates. The lowest values are typical for vegetation period, when intensive growth of algae going on. There is an inversely proportional relationship between the phosphates content and the phytoplankton abundance. During the development of algae low contents of phosphates or even contents below detection limit occur. Such low values in 2009 occurred at the beginning of May. The course of phosphates concentrations during the year was similar almost on every monitoring site. An exception was the sampling site No. 1141 in the Mosoni Danube at Vének, where the maximal values occurred from June to August, and reached maximally 0.33 mg.l-1. Concentrations of phosphates in the Danube water fluctuated in the range from 0.03 to 0.29 mg.l-1. Similar concentrations were registered in the Mosoni Danube at Čunovo/Rajka sampling site, in the river branch system and in the tailrace canal at Sap. In the reservoir decrease of phytoplankton abundance occurred due to the flood at the end of June and temperature drop in July. As a consequence increase of phosphates content was registered. The highest content in 2009 of 0.36 mg.l-1 was measured at sampling site No. 309 (Fig. 2-8). The development of phosphates content in the right side seepage canal was more balanced and values varied from <0.03 to 0.09 mg.l-1. The concentrations in the left side seepage canal at Hamuliakovo were similar as in the previous year and fluctuated from 0.03 to 0.15 mg.l-1. In comparison with the previous year the concentrations of phosphates were slightly higher on most of sampling sites. Lower concentrations were registered at sampling sites in seepage canals and in the Mosoni Danube at Vének. Total phosphorus Changes of the total phosphorus content in time only partially follow the quantitative changes of phosphates. The increase of its concentration in surface water is often caused by phosphorus bound to suspended solids. The total phosphorus content in the evaluated year was higher than in the year 2008 on most observed sampling sites. Concentrations at sampling sites in the Danube, in the tailrace canal and in the river branch system varied from 0.01 to 0.23 mg.l-1. The total phosphorus content in the Danube old riverbed measured at sampling sites observed by the Slovak Party were lower (up to 0.18 mg.l-1) than at sampling sites observed by the Hungarian Party on the right bank (up to 0.24 mg.l-1). The total phosphorus concentrations in the Mosoni Danube at sampling site No. 3529/0082 at Čunovo/Rajka reached values maximally up to 0.18 mg.l-1. In the seepage canals only narrow range of concentrations was registered, varying from <0.02 to 0.08 mg.l-1. The highest contents of total phosphorus in the reservoir were registered at the beginning of July during higher flow rates in the Danube (maximally up to 0.24 mg.l-1). The highest concentrations of total phosphorus were characteristic for the sampling site No. 1141 on the Mosoni Danube at Vének, where they fluctuated from 0.10 to 0.39 mg.l-1. Nutrients - summary The individual nutrients show seasonal fluctuation. Higher concentrations are characteristic for colder months; decrease of values is recorded in the spring after getting warmer. The seasonal fluctuation relates with biochemical processes in the water, which are temperature dependent. The seasonality in the evaluated period was more remarkable in case of nitrates and total nitrogen, less remarkable in case of ammonium ions. Contents of phosphates and total phosphorus can increase at higher flow rates. The nutrients content at individual sampling sites recorded in the year 2009 was slightly higher than in the previous year. In general, however, the long-term tendency of pollution decrease continues. The lowest and the most balanced nutrients values can be found in the seepage water, what results from its groundwater origin. The nutrient content in the Danube water is potentially sufficient for development of eutrophic processes under other suitable conditions. 2.5. Oxygen regime parametersDissolved oxygen The dissolved oxygen content is besides the decay processes of organic pollution influenced by hydro-meteorological conditions and by assimilation activity of phytoplankton. The dissolved oxygen content proportionally decreases with increasing water temperature in the Danube. Low concentrations in the evaluated year were recorded from June to September, in seepage canals from July to October. The highest values occurred in the winter and spring months. In the reservoir and at several sampling sites in the Danube old riverbed higher concentrations occurred also at the beginning of May. These values are probably related to assimilation processes of phytoplankton. The development of dissolved oxygen concentrations on most of sampling sites showed a seasonal character, time series data were more balanced than in the previous period and the maximal values were lower. Concentrations in the Danube water, in the Mosoni Danube at Čunovo/Rajka, in the tailrace canal and in the reservoir varied from 8.1 to 14.2 mg.l-1. In the right side river branch system at sampling sites in the Ásványi branch (No. 1126) and Szigeti branch (No. 1114) two high values were registered – 16.3 and 17.2 mg.l-1, which represent the maximal oxygen contents measured in the year 2009. Low concentrations below 7 mg.l-1 occurred at two sampling sites only: in the Mosoni Danube at Vének (No. 1141), and in the right side river branch system at Čunovo/Rajka (No. 3531/0084), with the lowest value of 5.8 mg.l-1. In general the oxygen conditions in the year 2009 can be evaluated as very good. CODMn and BOD5 CODMn and BOD5 parameters are used for expression of organic contamination of water, they indicate the chemically and biologically degradable organic matter content. Higher values of CODMn and BOD5 usually occur at periods with higher flow rates in the Danube, when the water contains higher amount of natural organic matter. In the evaluated year higher values of CODMn than in the year 2008 were registered. The highest values were registered in the Mosoni Danube at Vének (No. 1141), where they varied in a range from 3.4 to 5.9 mg.l-1, with one high value of 9.8 mg.l-1 measured in February. The poorest water from the point of view of organic contamination was the water in seepage canals, where the CODMn values fluctuated from <0.8 to 1.6 mg.l-1. At other sampling sites the maximal values for the actual year were recorded at the beginning of March, the highest value of 6.4 mg.l-1 occurred in the Danube old riverbed at Sap, sampling site No. 3739 (Fig. 2-10). The sampling in the reservoir started in the second half of March and the maximal values occurred in July, maximally up to 6.0 mg.l-1 (sampling site No. 309). Other concentrations fluctuated in the range from 1.0 to 4.9 mg.l-1. Organic contamination expressed by the CODMn parameter was higher than in the previous year at most of sampling site. Exception was the right side seepage canal, where the CODMn values were a bit lower then in the year 2008. Contrary to CODMn decrease of values in case of biological oxygen demand (BOD5) was registered in the year 2009. The BOD5 values in the Danube water varied from 0.7 to 6.1 mg.l-1. On the sampling site at Vének two higher values were recorded at the beginning of the year – 6.9 and 7.5 mg.l-1, the remaining concentrations varied maximally up to 3.4 mg.l-1, and were significantly lower than in the previous year. The situation was similar in the right side river branch system, where higher values were recorded at the beginning of the year, up to 7.3 mg.l-1. Low concentrations were documented in the reservoir, where they fluctuated in a narrow range from <0.85 to 2.6 mg.l-1. At sampling sites in the Danube old riverbed, which did the Slovak Party observe, even lower spread of values was recorded than in the reservoir. Values varied from <0.85 to 1.8 mg.l-1. The situation at sampling sites observed by the Hungarian Party differs, the BOD5 values fluctuated in a range from 1.2 to 4.4 mg.l-1, except the first three months. In general it can be stated that the BOD5 values recorded by the Hungarian Party in 2009 were again significantly higher than values observed by the Slovak Party. This can be clearly seen in case of the sampling site No. 3531/0084 in the right side seepage canal, which is jointly monitored by both Parties. The fluctuation range of values measured by the Slovak Party in 2009 is narrow and varies from 0.7 to 1.5 mg.l-1. While the values recorded by the Hungarian Party range from 1.8 to 3.8 mg.l-1. This is similar also at other jointly observed sampling sites in the Danube at Medveďov (sampling site No. 112/2306) and in the Mosoni Danube at Čunovo/Rajka (sampling site No. 3529/0082) – Fig. 2.11. The lowest pollution is characteristic for water in the left side seepage canal at Hamuliakovo (sampling site No. 317), where the BOD5 values varied in a narrow range from <0.85 to 1.2 mg.l-1. Oxygen regime and organic carbon parameters - summary The dissolved oxygen content remained preserved on the level of previous years, even on the mostly polluted sampling site in the Mosoni Danube at Vének no situation with oxygen shortage occurred. In comparison with the previous year the oxygen content did not reach such a low values as in 2008 and the maximal values in 2009 were lower. Based on the monitoring results it can be stated that the organic contamination expressed by CODMn was higher and the BOD5 values were lower in comparison with the previous year. In the year 2009 there were differences in BOD5 values between the Slovak and Hungarian Party. BOD5 values at sampling sites observed by the Hungarian Party were significantly higher. At jointly observed sampling sites in some cases the difference between Slovak and Hungarian data was double. The water in the seepage canals remained the cleanest. The maximal values in the evaluated period, in case of CODMn and BOD5, were recorded at the most polluted sampling site on the Mosoni Danube at Vének. In case of BOD5 higher values were recorded only in first two samples at the beginning of the year, the remaining values were similar to values recorded at the other sampling sites. The water quality at Vének got better thanks to investment into the wastewater treatment plant. The oxygen regime parameters in the Danube reflect the seasonal assimilation activity of phytoplankton and organic carbon oxidation processes. The measured data (1992-2009) indicate decreasing tendency of organic load at the Bratislava section of the Danube, which is related to the substantial wastewater treatment improvement in the upstream Danubian countries. 2.6. Heavy metalsThe joint monitoring from among heavy metals includes observation of zinc, mercury, arsenic, copper, chromium, cadmium, and nickel contents and since 2008 the lead content as well. The courses of heavy metal concentrations in the evaluated period were similar as in the previous year. No heavy metals were monitored in the left side river branch system on the sampling site at Dobrohošť (No. 3376). The lowest concentrations in the year 2009 were measured in case of chromium. Only eight values were above the detection limit. These values were recorded at five sampling sites and the highest concentration of 12.9 µg.l-1 was measured in June at sampling site in the Ásványi river branch (No. 1126). Except this single higher value the others varied maximally up to 4.2 µg.l-1. Similarly to the previous year the arsenic was characteristic with low content at every sampling sites, except the left side seepage canal. Greater part of recorded concentrations remained below the detection limit of the applied analytical method. Sporadically occurred values exceeding the limit value, with a frequency from one to two times during the year, maximally reaching 3.2 µg.l-1. An exception was the sampling site at Vének, where six values were recorded, with a maximum of 6.2 µg.l-1. In case of the left side seepage canal higher concentrations of arsenic were characteristic, varying between 1.93 and 14.2 µg.l-1 in the evaluated year. In case of cadmium all values recorded by the Slovak Party were below the detection limit of the applied analytical method, but there were several concentrations exceeding this limit value in the data of Hungarian Party in the evaluated year. Concentrations varied in the range from <0.5 to 2.2 µg.l-1, and the highest value was measured at sampling site No. 1126 in the Ásványi river branch in August. All concentrations of mercury at sampling sites observed by the Hungarian Party were below the detection limit of the analytical method used (<0,02 µg.l-1). The Slovak party recorded higher mercury concentrations and they were also higher in comparison with previous year. While they ranged from <0.003 to 0.0182 µg.l-1 in 2008, in the year 2009 hey varied from <0.003 to 0.55 µg.l-1. The highest concentration was recorded in the lower part of the reservoir at sampling site No. 311. This value and six other concentrations at sampling sites No. 309, 3530, 4025 and 3739 exceeded the limit value of the highest allowable concentration 0.07 µg.l-1 according to the Directive No. 2008/105/EC of the European Parliament and Council and at the same time they failed to meet the requirement for yearly average of 0.05 µg.l-1. Nickel concentrations in the evaluated year mostly varied in the range from <0.7 to 3.0 µg.l-1, with one higher value of 9.2 µg.l-1 measured in July at sampling site No. 1141 in Mosoni Danube at Vének. The highest concentrations from among the heavy metals were characteristic for copper and zinc. In the year 2009 the copper concentrations fluctuated up to 24.9 µg.l-1. Values exceeding 10 µg.l-1 sporadically occurred at sampling sites monitored by the Hungarian Party in the Danube at Rajka – sampling site No. 0001 (12.6 µg.l-1), at Dunaremete – sampling site No. 0002 (13.2 µg.l-1) and in the right side river branch system (10.2 and 12.6 µg.l-1). The highest value recorded by the Slovak Party reached 3.6 µg.l-1 (sampling site No. 3530 in the tailrace canal at Sap). Based on results obtained at jointly observed sampling sites it can be stated that there were significant differences in copper concentrations determined by the Slovak and the Hungarian Party – Fig. 2-12. Contents of zinc in the evaluated year fluctuated mostly in the range between 1.83 to 27.9 µg.l-1. Besides this range of values higher concentrations occurred at three sampling sites: 48.4 µg.l-1 at sampling site No. 307 in the reservoir, 67.7 µg.l-1 at sampling site No. 1126 in the Ásványi river branch and the highest value of 75,8 µg.l-1 at sampling site No. 0084 in the right side seepage canal at Rajka. Since 2008 the content of lead in the surface water is observed as well. The lead concentrations in the evaluated year were low. Most of measured values were below the detection limit of applied analytical method and only 12 values at 7 sampling sites exceeded the detection limit value. They varied from 0.7 to 3.4 µg.l-1. In summary it can be stated that heavy metal concentrations, which were determined from the filtered sample, were low during the evaluated year, with occasional occurrence of higher values. Great part of the determined values was below the detection limit of applied analytical methods. The lowest concentrations were registered in case of chromium, lead, arsenic and cadmium. The highest concentrations were characteristic for zinc, copper and mercury. In case of mercury at sampling sites observed by the Slovak Party values exceeding the limit value of the highest allowable concentration 0.07 µg.l-1 according to the Directive No. 2008/105/EC of the European Parliament and Council were recorded and at the same time they failed to meet the requirement for yearly average of 0.05 µg.l-1. From the heavy metal point of view the most polluted sampling site in 2009 was the sampling site in the Mosoni Danube at Vének. The detection limits of particular heavy metals often correspond to the II. or III. class of surface water quality. The detection limits differ depending on the laboratory. 2.7. Biological parametersChlorophyll-a The chlorophyll-a concentrations refer to the quantity of phytoplankton and provide information about the eutrophic state of water. The growth of algae on the respective section of river is represented by the relative increase of chlorophyll-a concentration between two compared sites. The amount of chlorophyll-a is influenced by flow rate and temperature conditions of the evaluated year and by the fluctuation of nutrients content. Due to higher flow rates in 2009 and more frequent occurrence of cooler periods the chlorophyll-a contents were low and in comparison with the previous year reached only half values. The increase of chlorophyll-a content was similarly to the year 2008 registered at the beginning of May, when the highest value was measured at sampling site No. 3739 in the Danube old riverbed at Sap, reaching 37.4 mg.m3. Other concentrations fluctuated from 1.8 to 32.6 mg.m-3. After the temperature drop in the second half of June the chlorophyll-a content significantly decreased and often did not reached the detection limit value. Besides the increase in May higher values occurred in October and in the reservoir in August as well. The chlorophyll-a contents in the river branch system were very low during the year and varied in the range from 2.0 to 16.7 mg.m-3. In the seepage water similar values were registered as in the previous year. In the left side seepage canal the chlorophyll-a content varied below the detection limit of applied analytical method, which was 6 mg.m-3. In the right side seepage canal at sampling site No. 3531/0084 at Čunovo/Rajka the chlorophyll-a content fluctuated from <2.0 to 15.4 mg.m-3. Contrary to the previous year, when the highest chlorophyll-a concentrations were recorded at sampling site No. 1141 in the Mosoni Danube at Vének (the value in May 2008 reached 101.8 mg.m3), one of the lowest range of values was documented here in the evaluated year, ranging from<2.0 to 13.0 mg.m3. Other biological parameters The evaluation of biological elements of quality in 2009 at jointly observed sampling sites and at sampling sites monitored by the Hungarian Party was carried out in harmony with the methodology agreed within the Trans-boundary Water Commission. At sites monitored by the Slovak Water Management Authority (SVP-BA) the evaluation used in the previous period continued. Biological parameters at jointly monitored sampling sites The surface water quality observation in 2009 in the frame of Trans-boundary Water Commission was realized according to the “Surface water quality observation directive of Slovak-Hungarian boundary water bodies and for extended water quality monitoring on the Danube” accepted on the LXV. Session of the Slovak-Hungarian Trans-boundary Water Commission with regard to the national methods of observation of the ecological and chemical status of water bodies in accordance with the requirements of Water Framework Directive (WFD). The goal of WFD is to protect all kind of water bodies and water dependent ecosystems, improve their status and achieve a good water status, which results from the good ecological and good chemical status of water bodies. Biological elements together with supporting hydro-morphological, physicochemical and chemical quality elements determine the ecological surface water status. The evaluation of the ecological status of water bodies in 2009 for individual biological quality elements was focused on sampling sites not on water bodies. The basic principle of evaluation is the type specificity and the comparison of changes in environment quality with reference values, which reflect the environment status without or with minimal anthropogenic influence. From among the biological quality elements the benthic invertebrates (macrozoobenthos), phytobenthos, phytoplankton and macrophytes were evaluated in the year 2009. The evaluation of observation results for particular biological elements was performed according to the classification schemes, which include limit values for classification into the respective quality classes in the range I.-V. quality class together with corresponding ecological status: I. class – high, II. – good, III. – moderate, IV. – poor, V. – bad. In Table 2-3 ecological status evaluation of particular biological quality elements is given separately for each country. When the final ecological status was determined the rule of “the worst value” was used for classification (worst case approach). Table 2-3: Evaluation of ecological status for biological quality elements at jointly monitored sampling sites
M – median level of reliability Based on the biological quality elements evaluation results in 2009 it can be stated that sampling sites in the Danube were classified into moderate status by the Slovak party (III. class), while the Hungarian Party classified the sampling site at Medveďov into good status (II. class) and the sampling site at Rajka even into high status (I. class). At this sampling place, however, the final biological status was determined according to phytoplankton only. Similar situation was at sampling sites in the seepage canal and in the Mosoni Danube at Rajka, where the final biological status was also determined according to phytoplankton only (II. class – good status). According to the macrophytes evaluation at sampling site in the Mosoni Danube at Vének the final biological status was poor (IV. class), but due to the shortcomings of the method for macrophytes evaluation this biological parameter was not taken into account when the final biological status was determined as good (II. class). According to WFD the final evaluation have to be accompanied by a level of reliability of the correct ecological status evaluation (high, median or low level of reliability). At determining of the reliability level several criterions are taken into account, which are more or less in coherence with criterions agreed by ICPDR. Similarly to the ecological status the same rule of the lowest reliability level is used for determining the final reliability level of water bodies ecological status evaluation. Biological parameters at sampling sites monitored only by the Hungarian Party At sampling sites, which were monitored only by the Hungarian Party, only the phytoplankton and phytobenthos were observed from among the biological quality elements. Phytoplankton samples were taken at four occasions in the year. The highest density of algae was registered at samples taken in the spring, when the centric diatoms of the Centrales order were the most abundant. The dominant phytoplankton species in the river branch system were mostly the same as in the Danube water, but the species diversity was higher. Phytobenthos samples were taken at one or two occasions during the evaluated year depending on the sampling site. An overview of biological quality elements evaluation results is given in Table 2-4. Table 2-4: Evaluation of ecological status for biological quality elements at sampling sites observed only by the Hungarian Party
Based on obtained results from the monitoring of biological quality elements it can be stated that according to the phytoplankton I. quality class was determined at every sampling site, which corresponds to high ecological status. From the phytobenthos point of view good ecological status was determined (II. class). The final biological status at sampling sites observed only by the Hungarian Party in 2009 was good, so the II. quality class. Biological parameters at sampling sites monitored only by the Slovak Party The monitoring and evaluation of biological quality elements was carried out according to the methodology applied in the previous years. Phytoplankton In the period between March and October 2009 twelve phytoplankton samples were taken at monitored sampling sites (Table 2-5). The phytoplankton abundance changes in the evaluated year were more dynamic, but values similar to that in the year 2008 were not reached. Higher values were recorded for the first time not until May. Warming in August and relatively warm September and October was reflected in increase of phytoplankton abundance again. The highest abundance of phytoplankton – 11336 individuals was recorded at the end of August in the reservoir at sampling site No. 309. This was the only case in 2009 when the measured value exceeded the limit value of 10000 individuals/ml, which is the limit for mass growth of phytoplankton. Similarly to the previous period the most abundant in the Danube old riverbed, in the reservoir, in the tailrace channel at Sap and in the river branch system were the centric diatoms (Bacillariophyceae - Centrales). In the left side seepage canal at Hamuliakovo sampling site the pennate diatoms (Bacillariophyceae - Pennales) created a significant portion of phytoplankton. The phytoplankton composition significantly determines the saprobe index of biosestone. The saprobe index in 2009 varied from 1.61 to 2.48 (Table 2-5). It fluctuated in the range, which corresponds to beta-mezosaprobity. Such environment offers suitable living conditions for a wide scale of organisms with high species diversity. The average values of saprobe indexes at observed sampling sites were similar in 2008 and 2009 (Table 2-5). Table 2-5: Values of saprobe index of biosestone in 2009
Concerning the phytoplankton abundance, as a substantial determinant of the saprobe index, it can be stated that the hydropower system had no negative influence on saprobity either in 2009. Macrozoobenthos From the ecological point of view the macrozoobenthos observation in the flowing water bodies appears to be the most suitable method for bioindication. The samples could be relatively easily accessible and quickly processed. In the year 2009 the macrozoobenthos samples were taken at monitoring sites given in Table 2-6. In section with quickly flowing water with gravely and stony bottom (sampling site No. 4025) rheophilous and oxibiontic macrozoobenthos species prevail indicating beta-mezosaprobity. Species Dikerogammarus villosus, Corophium curvispinum, Cricotopus sp., Ancylus fluviatilis and Dikerogammarus haemobaphes dominated at this sampling site in 2009. In sections with slowly flowing water stagnophilous and oligooxibiontic species appear, which are resistant to slight contamination. On these sections sandy and muddy bottom can be found – sampling sites in the Danube old riverbed No. 4016 at Dobrohošť and 3739 at Sap. In the evaluated year Dikerogammarus villosus, Lumbricidae g. sp. div., Cricotopus sp., at sampling site No. 3739 also Lithoglyphus naticoides and Corophium curvispinum, and at sampling site No. 4016 furthermore Corophium curvispinum, Simulium sp., Hydropsyche angustipennis and Hydropsyche contubernalis dominated in the evaluated year. There are places with different flow velocities in the reservoir. Depending on the flow velocity there exist different types of bottom substrates. Sandy and gravely substrate (sampling site No. 307) gradually changes into muddy substrate at places with slow flow velocity (sampling sites No. 308, 309 and 311). Dominant macrozoobenthos species in the reservoir in 2009 were Potamopyrgus antipodarum, Lumbricidae g. sp. div., Pisidium sp., Dikerogammarus villosus and Corophium curvispinum. At sampling site No. 307 also Sphaerium rivicola and Sphaerium solidum, at sampling site No. 308 in the upper part of the reservoir furthermore Cricotopus sp. Nais sp. and Phytochironomus fodiens and at sampling site No. 309 in the lower part of the reservoir Plumatella repens, Chironomus sp. and Lithoglypus naticoides as well. In the river branch system species Dikerogammarus villosus, Cricotopus sp., Theodoxus danubialis, Dreissena polymorpha, Corophium curvispinum and Simulium sp. dominated. Based on the determined species the saprobe indexes of macrozoobenthos were calculated, which fluctuated in the range from 1.97 to 2.81 (Table 2-6). Values in the Danube old riverbed varied from 2.12 to 2.47, which correspond to beta-mezosaprobity. The saprobe index in the reservoir reached values from 2.10 to 2.81, which correspond to beta and alpha-beta mezosaprobity depending on the sampling site location. Table 2-6: Values of saprobe index of macrozoobenthos in 2009
The other aspects of development of macrozoobenthos communities are evaluated in Part 7 – Biological monitoring, where more detailed evaluation for Cladoceras (Cladocera), copepods (Copepoda), molluscs (Mollusca), dragonflies (Odonata), mayflies (Ephemeroptera) and caddisflies (Trichoptera) can be found. 2.8. Evaluation of the overall ecological and chemical status of surface water bodies at jointly monitored sampling sites(based on the report “Evaluation of status of water bodies in Slovak-Hungarian boundary watercourses in 2009”, May 2010) The working group for protection of water quality of Slovak-Hungarian boundary watercourses of the Trans-boundary Water Commission (TWC) elaborated the evaluation of the ecological and chemical status in 2009 paying regard to national methodologies prepared according to requirements of the Water Framework Directive (WFD). The evaluation was elaborated separately for observation results obtained by the Slovak Party and separately for Hungarian results. Evaluation of the overall ecological status at jointly monitored sampling sites and at sampling sites observed only by the Hungarian Party Based on Slovak results (Table 2-7) the Danube between Bratislava and Medveďov was classified into moderate ecological status (III. class). The seepage canal at Čunovo was classified into good ecological status (II. class), and the Mosoni Danube at Čunovo reached moderate ecological status (III. class). According to WFD the final evaluation have to be accompanied by a level of reliability of the correct ecological status evaluation (high, median or low level of reliability). At all sampling sites observed by the Slovak party median level of reliability was determined in 2009. Table 2-7: Evaluation of the overall ecological status in 2009
Y – in accordance with the Environmental Quality Standard (EQS) N – not in accordance with the Environmental Quality Standard (EQS) Based on Hungarian results the overall ecological status in 2009 was good at all sampling sites – II. class. At sampling site in the Mosoni Danube at Vének the evaluation according to macrophytes were not taken into account (shortcomings in the methodology) and at sampling sites in the seepage canal and in the Mosoni Danube at Rajka only results of phytoplankton were taken into account from among the biological quality elements (Table 2-3). The final biological status at sampling sites observed only by the Hungarian Party was determined according to biological quality elements – phytoplankton and phytobenthos (Table 2-4). According to them the overall biological status was good (II. class). According to supporting physicochemical quality elements the sampling sites reached good status and non-synthetic specific substances relevant for Hungary (heavy metals) were in accordance with the National environmental quality standards. The overall ecological status at these sampling sites was good (Table 2-7). Evaluation of chemical status at jointly monitored sampling sites In the evaluation of chemical status the priority substances are taken into account. The basic principle of the chemical status evaluation is the determination of accordance (Y) or incongruence (N) of the calculated statistical value of particular priority substance with the respective Environmental Quality Standards – EQS (according to the Directive No. 2008/105/EC of the European Parliament an d Council). The accordance with the respective EQS is expressed as “good chemical status”, the incongruence is expressed as “good chemical status not achieved”. In 2009 good chemical status was not achieved at three jointly observed sampling sites: in the Danube old riverbed at Rajka, in the Danube at Medveďov and in the Mosoni Danube at Vének (Table 2-8). The incongruence was caused by the content of DEHP organic matter. The Directive 2008/105/EC also establishes the technical specifications for chemical analysis and it is necessary to note, that in case of several priority substances the methods are not in accordance with the requirements of this Directive. Table 2-8: Evaluation of the chemical status in 2009
Y – in accordance with the Environmental Quality Standard (EQS) N – not in accordance with the Environmental Quality Standard (EQS) M – median level of evaluation reliability DEHP – Bis(2-ethylhexyl)phthalate
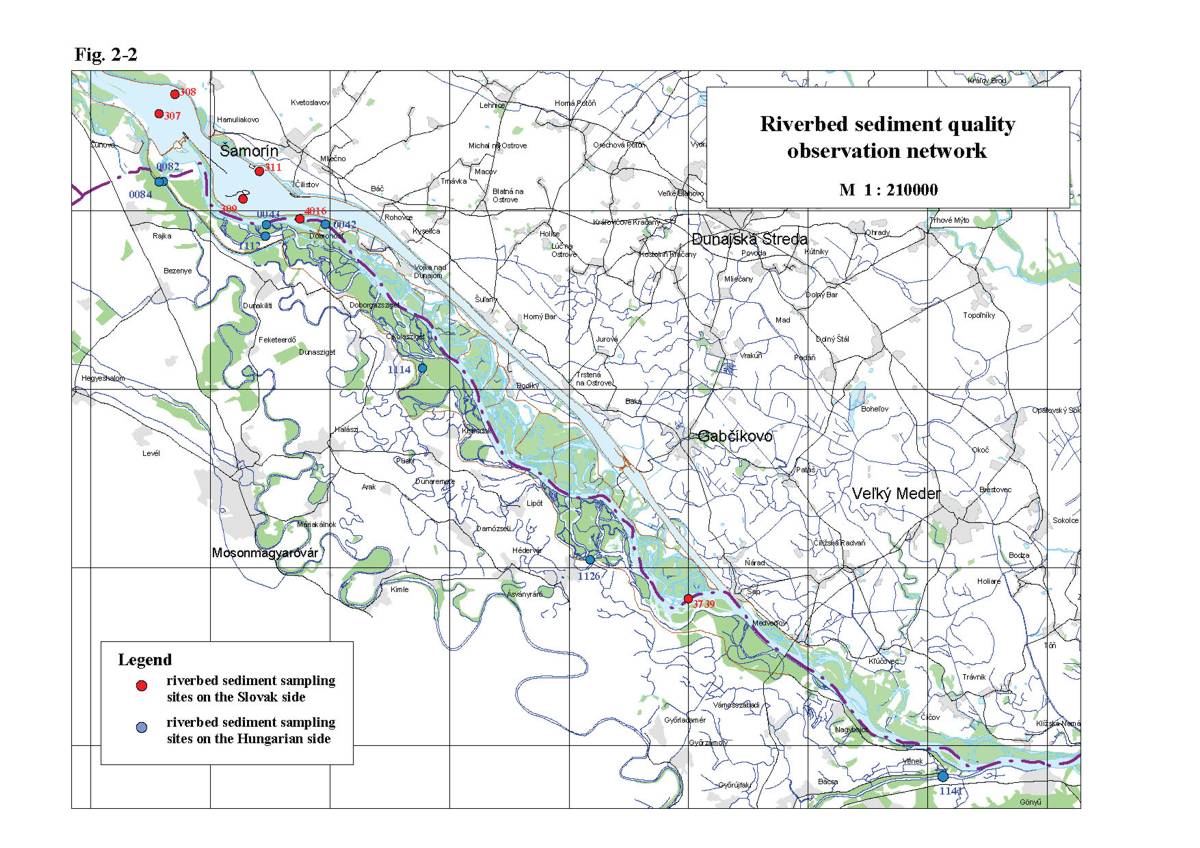
2.9. Quality of sedimentsIn the evaluated year 2009, similarly to the previous year, the Slovak and Hungarian Parties have realized unified evaluation of sediment quality according to the “Canadian Sediment Quality Guideline for Protection of Aquatic Life” (CSQG) published in 1999, revised in 2002. The sediment sampling in the frame of the Joint Monitoring by the Slovak Party was carried out at the beginning of October 2009 at six sampling sites. The Hungarian Party sampled the sediments in June and September 2009 at seven sampling sites. The situation of sampling sites is shown on Fig. 2-2. The list of analysed parameters was the same as in 2008. Besides the inorganic and organic micro components the total phosphorus and total nitrate content were analysed as well. At sampling sites observed by the Slovak Party several exceeding of threshold limit value for heavy metals were registered, contrary to sampling sites on the Hungarian territory, but the measured concentrations varied closely to the Threshold Effect Level (TEL). The lowest content was characteristic for lead and mercury, since no value reached the TEL. At such a concentrations the unfavourable effect on biological life occurs rarely and it corresponds to an uncontaminated natural environment. The content of zinc was low too, and it slightly exceeded the TEL at only one sampling site. Contents of chromium, copper and arsenic exceeded the TEL limit value at five sampling sites, the content of cadmium at all sampling sites. However, the concentrations varied in the range >TEL and <PEL (Probable Effect Level), when the unfavourable effect on biological life occurs occasionally, and represent potential possibility of eco-toxicological effect. In sediment samples taken on the Hungarian territory lower number of exceeding of threshold values for heavy metals occurred, but their contents were higher. The lowest contents were documented in case of arsenic, cadmium, chromium and copper in both samples in June and September. Their concentrations varied either below the TEL limit value or closely to this limit. In case of zinc and mercury exceeding of PEL limit value (Probable Effect Level) occurred, when the unfavourable effect on biological life occurs frequently. The zinc concentration exceeding the PEL limit value occurred at sampling site No. 1126 in Ásványi river branch in June and reached 322 mg.kg-1. All other concentrations varied in the range between >TEL and <PEL and in the seepage canal they were lower than TEL. The mercury concentrations exceeded the PEL limit value at five sampling sites. The maximum (0.8 mg.kg-1) was recorded at sampling site No. 1141 in the Mosoni Danube at Vének. In samples from September however, the high content of mercury in the sediment was not proved and the measured values belonged to the lowest from among the heavy metals. In case of organic micro-pollutants exceeding of PEL limit was not measured in 2009. The recorded concentrations mostly varied below the TEL limit value, when the unfavourable effect on biological life occurs rarely. Concentrations exceeding the TEL fluctuated in the range >TEL <PEL and were only slightly above the TEL limit. The best sediment quality was proved at sampling site No. 0084 in the right side seepage canal, the worst sediment quality was documented at sampling site No. 1141 in the Mosoni Danube at Vének. In the reservoir at sampling sites No. 307 and 309 exceeding of the TEL limit value occurred in case of several parameters, but they were slight only. On the Hungarian side the total phosphorus and total nitrate content in sediments was analysed as well. The total phosphorus content in 2009 varied in the range from 134 mg.kg-1 to 1907 mg.kg-1 and the concentrations of total nitrogen varied in the range from 490 to 3119 mg.kg-1. The lowest contents for both parameters were recorded in the right side seepage canal at Rajka and the highest content occurred in the Mosoni Danube at Vének (sampling site No. 1141). Comparing to the year 2008 the total nitrogen content was significantly lower at all observed sampling sites. 2.10. ConclusionsThe surface water quality in the evaluated year 2009 was similar as in previous years. Regarding the specific hydrological and climatic conditions in the actual period the observed surface water quality parameters did not reach extreme values. Increased values of some parameters in the Danube were related to higher flow rates in the Danube. The quantitative ratio of ionic composition of the surface water shows high stability in last years. In case of nutrients slightly higher concentrations were registered in comparison with the previous year, however in long-term they did not violate the tendency of pollution decrease. The dissolved oxygen content remained preserved at the level of previous years; the organic pollution represented by CODMn was higher in comparison with the previous year 2008, in case of BOD5 decrease of pollution was registered. When analysing the changes in suspended solids content at sampling sites in the Danube, it can be stated that the suspended solids content downstream of the reservoir (at Medveďov sampling site) during flood waves is lower than in the Danube at Bratislava, which refer to settling effect of the reservoir. From among the heavy metals the highest concentrations were recorded in case of zinc, copper and mercury (on the Slovak side). The lowest contents were registered in case of chromium and lead. A large part of analysed concentrations was below the detection limits of the applied analytical methods. The fluctuation of surface water quality parameters in the right side river branch system since introducing the water supply in 1995 follows their fluctuation in the Danube. The water quality in the Mosoni Danube differs in the upper and lower section of the river. The water quality at the sampling site at Čunovo/Rajka follow the water quality in the Danube, while the water quality on the lower section of Mosoni Danube (upstream of the confluence with the Danube) is formed by its affluents and local pollution from settlements. Compared to previous years the water quality significantly improved thanks to investments realized in the wastewater treatment plant. In general it can be stated that the content of all nutrients decreased at this sampling site, although their concentrations in comparison with other sampling sites still reach the highest values. The cleanest water is characteristic for seepage canals, which results from its groundwater origin. The monitoring of biological elements of the surface water quality in the evaluated year at jointly monitored sampling sites and at sampling sites observed by the Hungarian Party was realised according to the national methodologies for particular biological quality elements in harmony with the Water Framework Directive. Both Parties carried out the evaluation of biological quality elements separately. Based on the Slovak evaluation results of the biological quality elements the sampling sites in the Danube and Mosoni Danube at Čunovo/Rajka were classified into III. quality class, which correspond to moderate ecological status. Water in the seepage canal corresponded to the II. quality class. Based on the Hungarian results the sampling site in the Danube old riverbed at Rajka was classified into the I. quality class (high status), while all other sampling sites into the II. quality class, which corresponds to good status. It have to be noted however, that in the Hungarian evaluation only results from phytoplankton and phytobenthos monitoring, and only the phytoplankton at sampling site at Rajka, were taken into account. Evaluation of sampling sites observed by the Slovak Party only was carried out according to methodology used in previous years. Macrozoobenthos and phytoplankton were evaluated. Saprobe indexes varied in ranges corresponding to beta-mezosaprobity, so to environment offering suitable living conditions for a wide scale of organisms. Exceptions were two sampling site in the reservoir where in case of the saprobe index of macrozoobenthos beta-alpha-mezosaprobity (sampling site No. 309) and alpha-beta-mezosaprobity (sampling site No. 311) occurred. According to the National methodologies also the overall ecological and chemical status at observed sampling sites was determined. Based on the Slovak results the overall ecological status at sampling sites in the Danube and Mosoni Danube at Čunovo was moderate (III. class) and in the seepage canal at Čunovo it was good (II. class). Based on Hungarian results all sampling sites were classified into good ecological status (II. class). Good chemical status was not achieved at three sampling sites (Rajka, Medveďov and Mosoni Danube at Čunovo). Incongruence was caused by the content of DEHP organic substance. The sediment quality was evaluated according to the “Canadian Sediment Quality Guideline for Protection of Aquatic Life” (CSQG) published in 1999, revised in 2002. In case of inorganic and organic contamination of sediments on the Slovak side concentrations close to TEL limit value within the range >TEL and <PEL, or even concentrations lower than TEL limit value were recorded. In sediments analysed by the Hungarian Party, similarly as in the year 2008, several exceeding of PEL (Probable Effect Level) were recorded, when the unfavourable effect on biological life occurs frequently. In 2009 exceeding occurred in case of zinc and mercury in June. In samples taken in September the high concentrations were not proved and the measured contents belonged to the lowest ones from among the heavy metals. Concentrations of organic pollution mostly varied below the TEL limit value, when the unfavourable effect on biological life occurs rarely. In the Table 2-9 an orientational classification of selected sampling sites and selected surface water quality parameters was done. The orientational classification was realised using the limit values of five-classes system according to the trans-boundary water quality classification accepted by the Slovak-Hungarian Trans-boundary water Commission on its LXV. session and given in the “Surface water quality observation directive for Slovak-Hungarian boundary waters and for extended water quality monitoring on the Danube”. Some part of observed parameters shows seasonal fluctuation, which subsequently influences the classification into the quality classes. In case that a range is given (e.g. I-II) it means natural seasonal fluctuation of particular parameters or their dependency on climatic conditions. The quality class in brackets means, that the measured value occurred only once or two times in the evaluated period (mostly during higher discharges or flood waves). The range with asterisks (e.g. I*-II*) represents a situation, when every recorded value was below the detection limit of applied analytical method, but the two Parties have different detection limits. Table 2-7: Orientational classification of surface water quality parameters according to the agreed limits for surface water quality classification
* all the data below the detection limit ** most of the data below the detection limit Based on comparison of water quality entering the influenced area (sampling site at Bratislava) and water quality leaving the influenced area (sampling site at Medveďov) it is evident, that the water quality leaving the system is very similar.
|
|||||||||||||||||||||||||||||||||||||||||||||||||||||||||||||||||||||||||||||||||||||||||||||||||||||||||||||||||||||||||||||||||||||||||||||||||||||||||||||||||||||||||||||||||||||||||||||||||||||||||||||||||||||||||||||||||||||||||||||||||||||||||||||||||||||||||||||||||||||||||||||||||||||||||||||||||||||||||||||||||||||||||||||||||||||||||||||||||||||||||||||||||||||||||||||||||||||||||||||||||||||||||||||||||||||||||||||||||||||||||||||||||||||||||||||||||||||||||||||||||||||||||||||||||||||||||||||||||||||||||||||||||||||||||||||||||||||||||||||||||||||||||||||||||||||||||||||||||||||||||||||||||||||||||||||||||||||||||||||||||||||||||||||||||||||||||||||||||||||||||||||||||||||||||||||||||||||||||||||||||||||||||||||||||||||||||||||||||||||||||||||||||||||||||||||||||||||||||||||||||||||||||||||||||||||||||||||||||||||||||||||||||||||||||||||||||||||||||||||||||||||||||||||||||||||||||||||||||||||||||||||||||||||||||||||||||||||||||||||||||||||||||||||||||||||||||||||||||||||||