PART 1
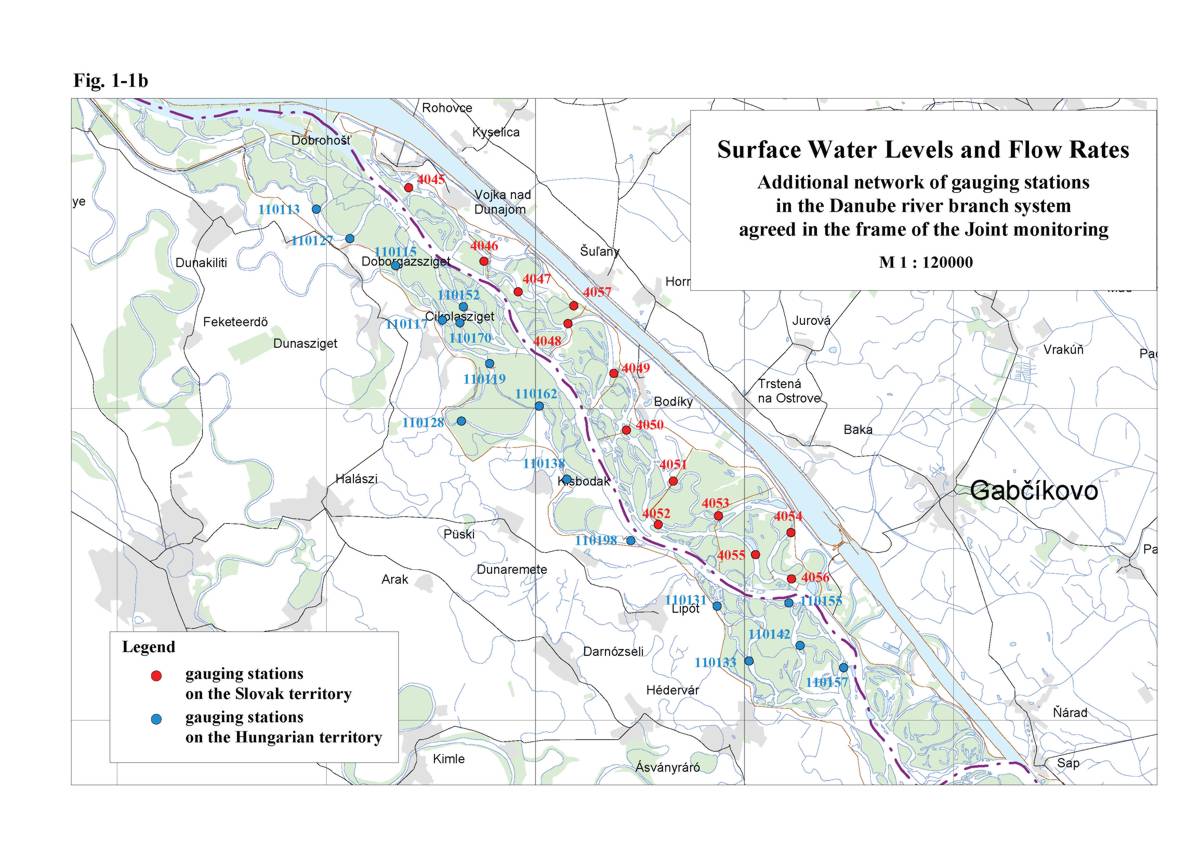
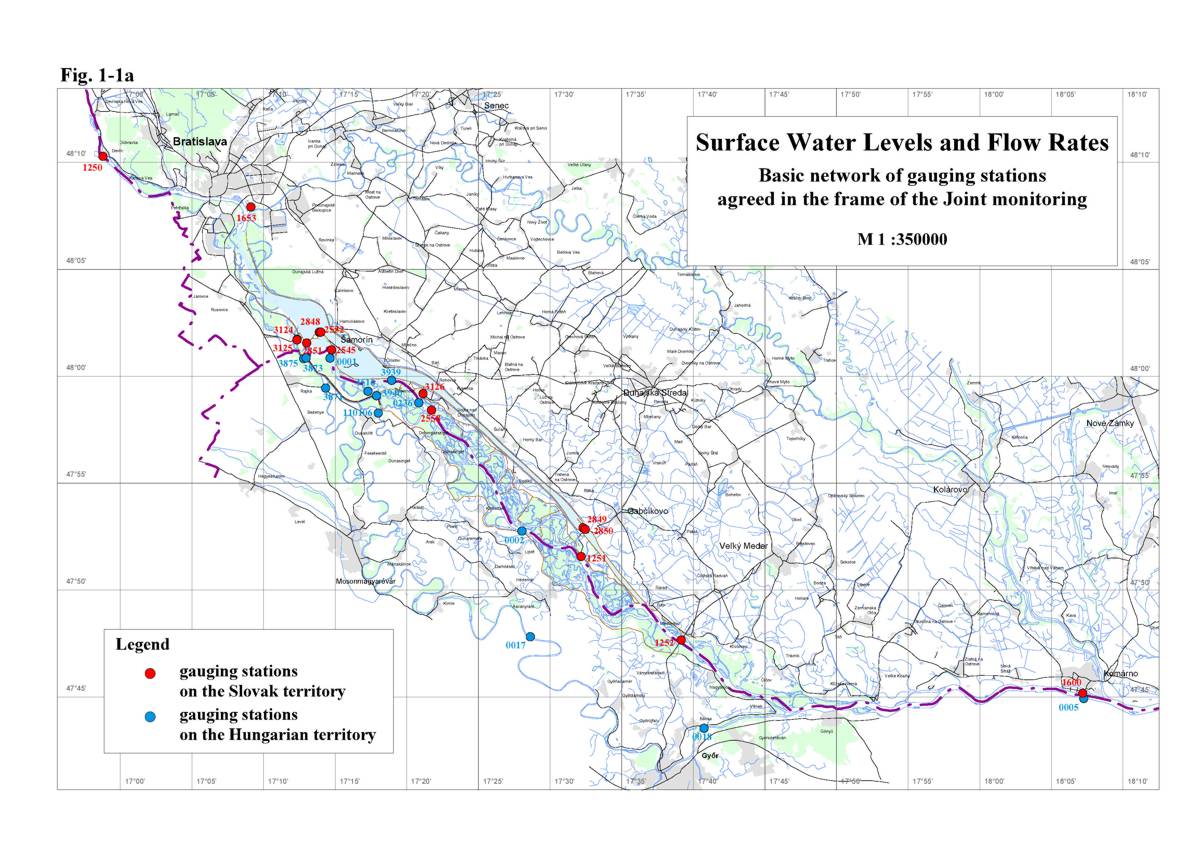
Surface water levels and flow ratesThe monitoring of surface water levels and discharges continued in the same extent as in previous years. The evaluation of the surface water regime was done for the hydrological year (period from November 1 of the previous year to October 31 of the evaluated year). Surface water level recording in the hydrological year 2009 was carried out at 28 gauging stations on the Slovak side and 29 gauging stations on the Hungarian side (Tab. 1-1). There were some changes in numbering of the gauging stations on the Hungarian side in order to unify it with the numbering in the Hungarian National Annual Report. On several gauging stations flow rate calculations were performed (10 gauging stations on each side). The observation network is shown in Fig. 1-1a, Fig. 1-1b. The Parties in the intergovernmental Agreement have agreed to mutually exchange data from these gauging stations. Common flow rate measurements helped the joint evaluation of flow rates discharged into the Danube downstream of the Čunovo dam and into the Mosoni branch of the Danube. Based on mutual evaluation of common measurements, time series data of surface water levels and flow rates were accepted. These data create the basis for joint evaluation of measures and water supply realised according to Articles 1-3 of the Agreement. Table 1-1: List of gauging stations
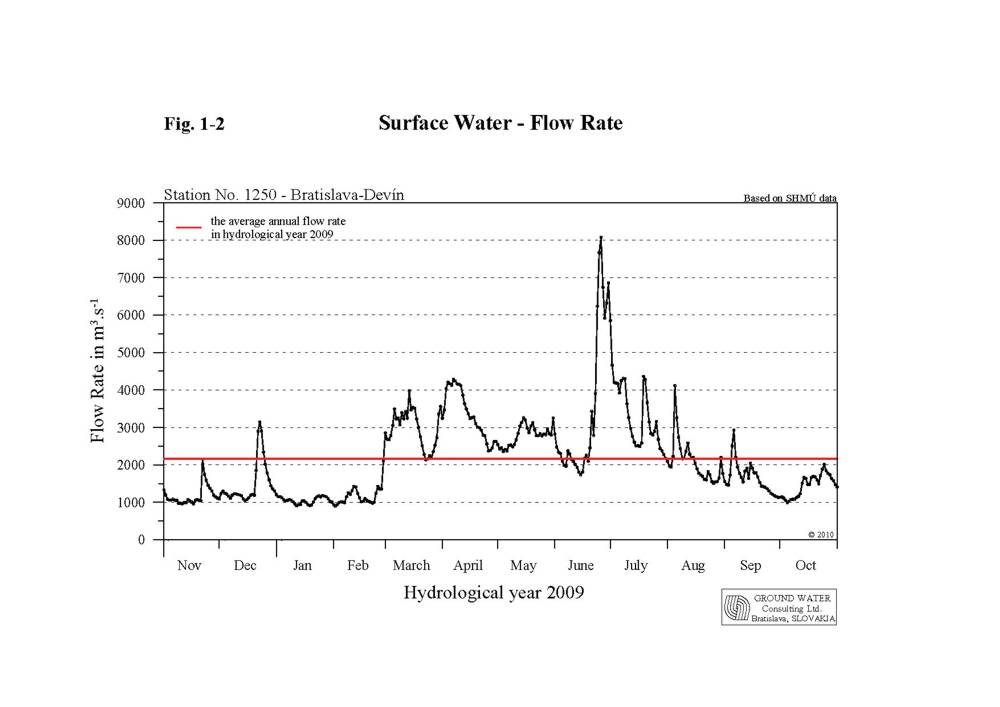
In the intergovernmental Agreement, signed on April 19, 1995 a temporary water management regime was set up. It was agreed that in the case of average annual flow rate of 2025 m3.s-1 in the Danube at the Bratislava-Devín gauging station an annual average of 400 m3.s-1 should be discharged into the Danube old riverbed downstream of the Čunovo weir. The actual daily amount of water is governed by the flow rate reaching the Bratislava-Devín profile, taking into consideration the rules of operation described in Annex 2 of the Agreement. The flow rate in the vegetation period, depending on hydrological conditions, should fluctuate between 400 and 600 m3.s-1; in non-vegetation period the flow rate should not be less than 250 m3.s-1. In case of flow rates over 5400 m3.s-1 the amount of water above 600 m3.s-1 discharged through the Čunovo weir is not taken into consideration when the annual average is calculated. An additional 43 m3.s-1 of water was agreed in the Agreement to be discharged into the Mosoni branch of the Danube and the right side seepage canal. The gauging station Bratislava-Devín plays a key role in determining the amount of water to be discharged into the old Danube riverbed downstream of the Čunovo weir. The annual minimum daily flow rate of 850 m3.s-1 occurred on January 14, 2009, when the average daily flow rate was 941.4 m3.s-1. The lowest daily average flow rate was recorded on February 2, 2009 and reached 896.0 m3.s-1.The annual maximum flow rate occurred on June 26, 2009, when it reached 8288 m3.s-1, with a maximum average daily flow rate of 8080 m3.s-1. The average annual flow rate at this station in the hydrological year 2009 reached 2163 m3.s-1, which belongs to flow rates on the Danube above the average (Tab. 1-2). Considering the course of water levels and flow rates during the hydrological year 2009 it can be stated that no extraordinary values occurred, however one high flood occurred at the end of June. The course throughout the year was typical – low flow rates in the winter period; higher flow rates in the spring and a flood in the summer. Extremely dry months did not occurred. November 2008, January, February and August 2009 belonged to dry months. September and October were moderately water rich, while December 2008, May, June and July 2009 belonged to water rich months. April 2009 was extremely water rich month. Table 1-2: Average annual flow rates
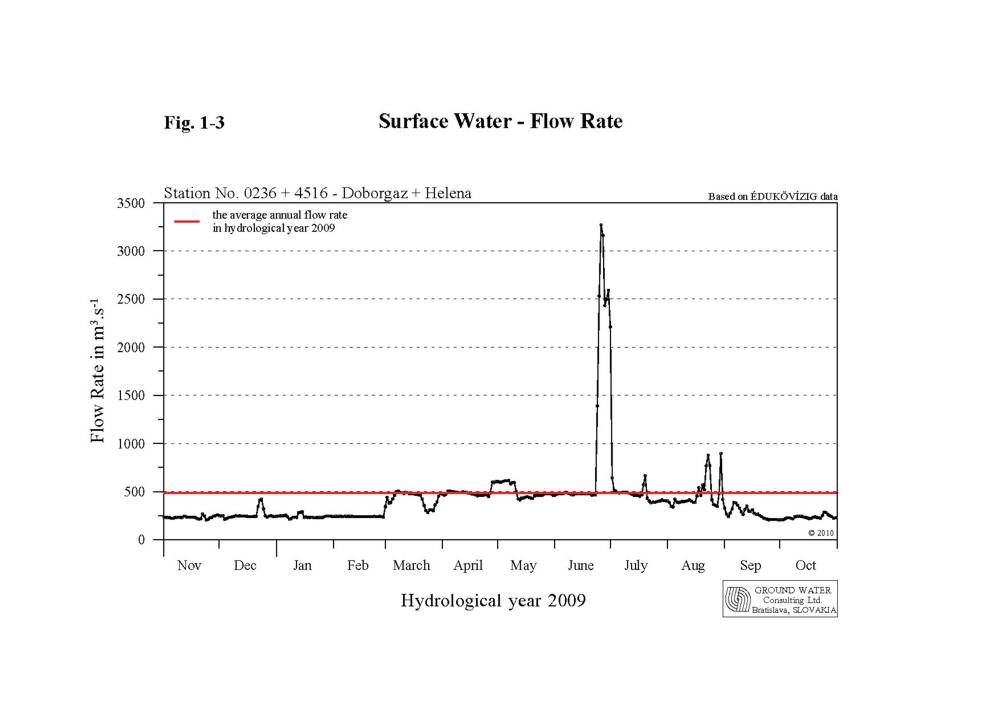
In the hydrological year 2009 the Danube flow regime was typical contrary to several previous years – i.e. low flow rates in the winter period, increased flow rates during the spring and one big flood wave at the beginning of summer, which was followed by continuous flow rate decrease till the end of September. Flow rates in the winter period (November 2008 till the end of February 2009) mostly fluctuated below the long-term average daily values. In November and December 2008 the average daily values exceeded the long-term daily average due to higher precipitation amount in the Austrian and German Danube catchment area. The increase of flow rate in December was significant and the average daily value on December 23, 2008 reached 3144 m3.s-1, at culmination of 3183 m3.s-1. The lowest average daily flow rates occurred during November 2008, in the middle of January 2009 and at the beginning and at the end of February, when they fluctuated below 1000 m3.s-1. The yearly minimum occurred on January 14, 2009, when the flow rate reached 850 m3.s-1, however the lowest average daily flow rate was recorded on February 2, 2009 at 896 m3.s-1. At the end of February the flow rate considerably increased due to warming and precipitation, what lasted till the end of the second decade of March (culmination on March 14, 2009 at 4107 m3.s-1). After a temporary decrease the flow rate started to increase again at the end of March, due to strong warming, and during the period from April 4 to 12 it ranged around 4000 m3.s-1, with culmination on April 7, 2009 at 4359 m3.s-1. Subsequently the flow rates continuously decreased till the end of April. The flow rates in May fluctuated around or above the long-term average daily values, however they significantly decreased till the middle of June. From the middle of June the flow rates steeply rose up due to increased precipitation amount, mainly in the Austrian Danube catchment area. Due to lasting rainfall a high flood wave was created in the third decade of June, which culminated on June 26, 2009 at 8288 m3.s-1. After this culmination a second one occurred as well, due to heavy local storms in the Austrian catchment area (on June 30, 2009 at 6998 m3.s-1). Due to heavy rains in July and August another two considerable increases of flow rate occurred, which exceeded 4000 m3.s-1 (culmination on July 19, 2009 at 4840 m3.s-1, and culmination on August 5, 2009 at 4589 m3.s-1). At the end of August and in September the flow rates mostly ranged below the long-term average daily values, however at the beginning of September a discharge wave occurred due to rainfall in the German catchment area of the Danube, which culminated on September 6, 2009 at 3225 m3.s-1. The flow rates decreased at the beginning of October as well, when they decreased below 1000 m3.s-1. The course of flow rates during the hydrological year 2009 at gauging station No. 1250 - Bratislava-Devín is shown in Fig. 1-2. 1.1. Discharge into the Danube downstream of Čunovo weirThe determination of the average daily amount of water discharged into the Danube downstream of the Čunovo weir was based on average daily flow rates determined at gauging stations Doborgaz and Helena (Fig. 1-3). At these stations joint flow rate measurements were performed to determine the flow rate supplied into the Danube old riverbed. The monthly characteristics of the daily average flow rates into the Danube in the hydrological year 2009 were as follows (calculated from average daily data):
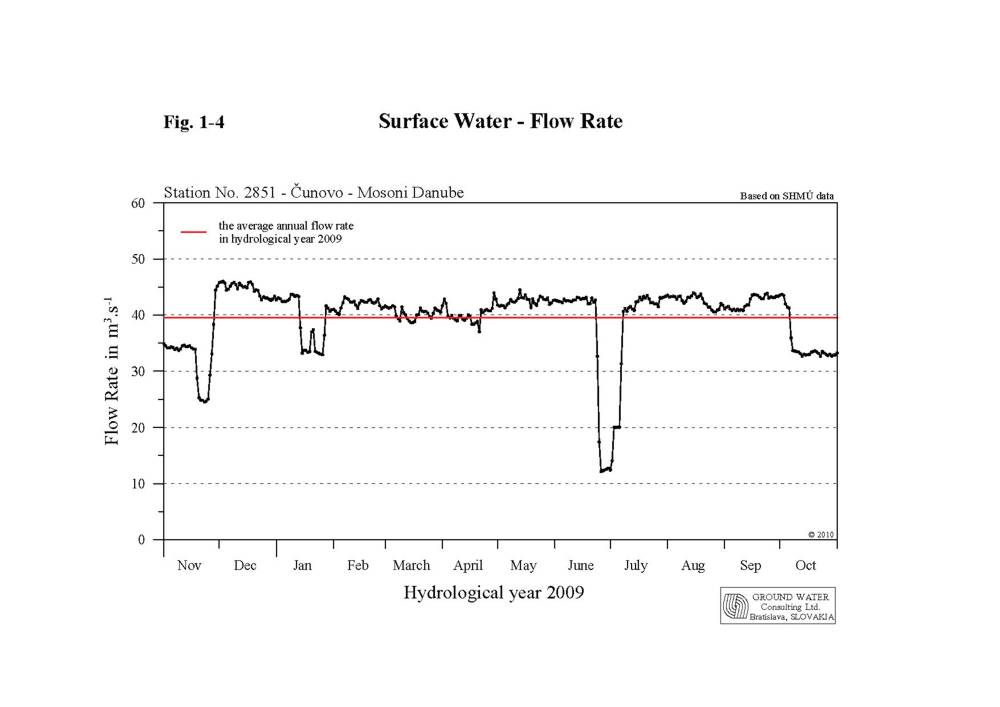
The average annual flow rate in the Danube at the Bratislava-Devín profile in hydrological year 2009 was 2163 m3.s-1. Taking into consideration obligations envisaged in the intergovernmental Agreement, the Slovak Party was obliged to release an average annual discharge of 427.3 m3.s-1 into the Danube riverbed downstream of the Čunovo weir. The total average annual discharge released to the Danube downstream of Čunovo was 484.8 m3.s-1. During the hydrological year 2009 it was necessary to release an amount of water exceeding 600 m3.s-1 into the riverbed downstream of Čunovo due to flood wave in June 2009. Higher discharge was released in the period from April 28 to May 11, 2009 as well, when artificial flooding of the right side river branch system was realised. Discharges above 600 m3.s-1 occurred in July and August as well (two and six days respectively), when technical maintenance of the water barrage system was performed. According to the modified method of yearly average discharge calculation, accepted in the Joint Annual Report on the environment monitoring in 2004, reduction of the discharge released to the Danube old riverbed was done for 8 days (reduction to 600 m3.s-1). According to this the average annual flow rate in the Danube old riverbed corresponded to 435.5 m3.s-1, which represents 101.9 % of the amount requested by the Agreement. The yearly average minimum of 219.6 m3.s-1 in the Danube old riverbed was measured on January 8, 2009; the yearly average maximum of 3756 m3.s-1 was recorded on June 26, 2009. When evaluating the amount of water discharged to the Danube old riverbed, it can be stated that Slovak Party fulfilled the average annual discharge jointly agreed in the intergovernmental Agreement. Taking into consideration the minimal values prescribed in the Agreement (in the winter period not less than 250 m3.s-1, in the vegetation period at least 400 m3.s-1) it can be stated that considering the accuracy of the measurements (±7 %) discharges below 250 m3.s-1 in the winter period occurred in three occasions, and discharges below 400 m3.s-1 in the summer period occurred in 10 days in July and in 9 days in August. On the other side discharge higher than 600 m3.s-1 prescribed by the Agreement + 7 % accuracy of measurement was released due to artificial flooding of the right side river branch system (15 days) and higher discharge (600 m3.s-1 + 7 % accuracy of measurement) also occurred in July (2 days) and August (5 days). 1.2. Discharge into the Mosoni branch of the DanubeAccording to the intergovernmental Agreement, the discharge into the Mosoni branch of the Danube should be 43 m3.s-1, which is composed of both, the discharge released to the Mosoni branch of the Danube through the intake structure at Čunovo, and the discharge through the seepage canal. Discharge measurements are carried out downstream of the intake structure on the Slovak territory at 0.160 rkm and also upstream of lock No. I on the Hungarian territory. The average daily discharges were agreed after the joint evaluation of joint discharge measurements performed at both profiles. In this evaluation, data measured just downstream of the intake structure was considered (Fig. 1-4). The monthly characteristics of the amount of water released into the Mosoni Danube through intake at Čunovo in the hydrological year 2009 were as follows (calculated from average daily data):
The average annual discharge was 39.56 m3.s-1. The minimal daily average discharge was 12.14 m3.s-1; the maximal daily average discharge was 46.00 m3.s-1. The flow rate in the right side seepage canal was measured at two sites as well. The first is on Slovak territory at Čunovo; the second is on Hungarian territory at lock No. II. In the evaluation the data observed at lock No. II was considered. The monthly characteristics of the flow rates recorded at lock No. II in the hydrological year 2009 were as follows (calculated from average daily data):
The average annual flow rate was 1.75 m3.s-1. The minimal daily average discharge was 0.95 m3.s-1; the maximal daily average discharge was 3.20 m3.s-1. The monthly characteristics of the total flow rate released into the Mosoni Danube in the hydrological year 2009, consisting of the water amount discharged through the intake structure at Čunovo and water amount flowing in the right side seepage canal, were as follows:
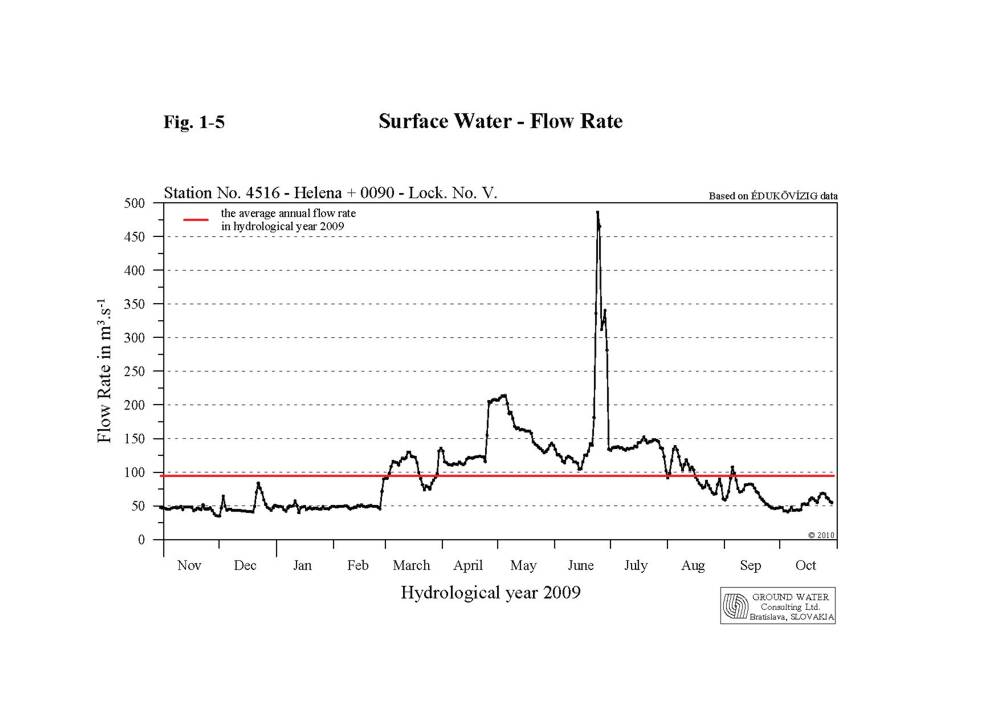
The total average annual flow rate was 41.31 m3.s-1, which represents 96.1 % of the agreed amount. The minimal daily average discharge was 15.04 m3.s-1; the maximal daily average discharge was 47.60 m3.s-1. The water amount discharged to the Mosoni branch of the Danube was reduced during the flood wave in June. Taking into account the technical and hydrological conditions it can be stated that the obligation envisaged in the Agreement was fulfilled. 1.3. Water distribution on the Hungarian territoryCorresponding to the EU Water Framework Directive waters on the Hungarian territory belong to heavy modified (the Danube old riverbed, the Upper, Middle and Lower parts of the Mosoni Danube and the river branches on the flood-protected area) and artificial (right side seepage channel) water bodies. The goal of the water distribution on the Hungarian side is to provide a continuous water supply into the inundation area, into the river branches on the flood-protected area and into the Mosoni Danube. 1.3.1. Water supply into the inundation areaRiver branches in the inundation area on Hungarian side can be supplied by water from two sources. These two sources are summed to get the total amount. a) Through three openings in the Danube riverbank, by manipulating the water level increased by the submerged weir and the Dunakiliti dam. The total inflowing discharge is measured at Helena profile. b) From the seepage canal through lock No. V. The criterions for regulation of water distribution were set up to satisfy the needs determined at right-side river branch system revitalization planning. The reference status was determined at the end of nineties with the involvement of stakeholders. Taking various needs into consideration it reflects the hydrological regime of fifties. Creation of water levels characteristic for this period was targeted in the arms of inundation area. The flow rate was determined as a function of flow rate entering the Bratislava - Devín profile. The environmental status of Szigetköz in the reference period was determined as the most similar to a state, which can be sustained on a long run, and serves adequate information on riverbed morphology and hydro-geological regime for determining the reference status. This is in full harmony with recommendations of the Water Framework Directive and goals of the River Basin Management. Joint discharge measurements by both Parties were performed at the Helena profile. The measurements were jointly evaluated and the average daily flow rate data were accepted. The monthly flow rates characteristics at Helena profile in the hydrological year 2009 were as follows (calculated from average daily data):
The average annual flow rate was 80.58 m3.s-1. The minimal daily average discharge was 0.53 m3.s-1; the maximal daily average discharge was 486.0 m3.s-1. The monthly flow rates characteristics at lock No. V in the hydrological year 2009 were as follows (calculated from average daily data):
The average annual flow rate was 14.20 m3.s-1. The minimal daily average discharge was 0.00 m3.s-1; the maximal daily average discharge was 37.70 m3.s-1. The monthly flow rates characteristics of the total amount of water released into inundation area in the hydrological year 2009 (Fig. 1-5), consisting of the water amount flowing through the Helena profile and water amount flowing through the Lock. No. V in the right side seepage canal, were as follows:
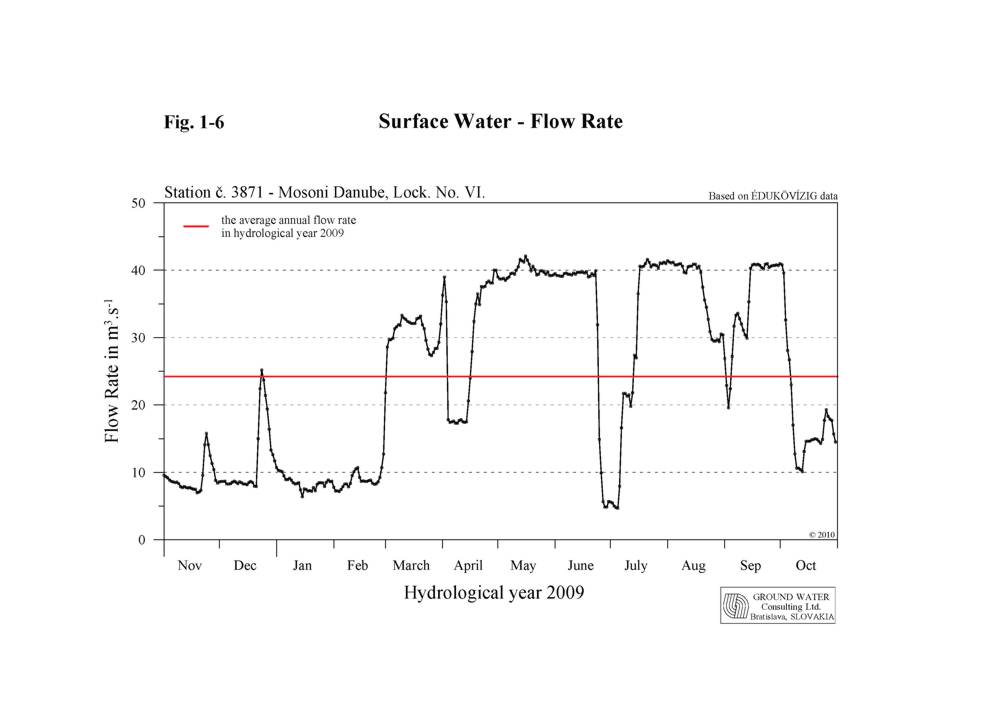
The total average annual flow rate supplied into river branches in the inundation area was 94.77 m3.s-1. The minimal daily average discharge was 35.13 m3.s-1; the maximal daily average discharge was 486.0 m3.s-1. In 2009 artificial flooding of the inundation area on both sides at the same time was realized (April 28 – May 11, 2009). The simultaneous artificial flooding in the left and right side river branch system slightly increased the influence of flooding. The water amount discharged and distributed in the Hungarian river branch system created water levels characteristics for the reference status in the upper and middle part of the inundation area – in the Tejfaluszigeti, Cikolai and Bodaki river branch systems, and along the canal near Lipót. Water levels monitored in the Ásványi river branch systems slightly differ from the reference status. The lack of revitalization works in the downstream areas plays a role at not achieving the desired status. Based on the above mentioned it can be stated that for the low and medium flow rate periods the target values of the reference status were fairly achieved. However, the water amount discharged to the Danube old riverbed does not allow the creation of reference water levels; technical measures are needed for achieving the desired status. 1.3.2. Water supply into the Mosoni DanubeThe water supply into the Mosoni Danube is secured from the seepage canal through the lock No. VI (Fig. 1-6). The flow rate is measured at the profile downstream of the lock. The monthly characteristics of flow rates through the lock No. VI in the hydrological year 2009 were as follows (calculated from average daily data):
The average annual flow rate in the Mosoni Danube at lock No. VI. was 24.23 m3.s-1. The minimal daily average discharge was 4.66 m3.s-1; the maximal daily average discharge was 42.10 m3.s-1. The water supply regime is regulated by rules of operation and follows the Danube’s water regime. In non-vegetation period a low water period was simulated again in the Mosoni Danube. This was realised by redirecting a greater part of the water amount into the inundation area. Besides its water supply function lock No. I also has a flood protection function. It prevents floods entering the flood-protected area. Reduction of flow rate was necessary during the summer flood in order to lower the culmination level in the Mosonmagyaróvár region. 1.4. The Danube water level characteristics on Čunovo-Vámosszabadi stretchThe Danube stretch between Čunovo and Vámosszabadi can be divided into four different sections according to the prevailing influence. These sections can be characterised by data obtained from the following gauging stations: Rajka and Hamuliakovo, Dunakiliti, Doborgaz and Dobrohošť, Dunaremete and Gabčíkovo. Vámosszabadi and Medveďov. The characteristics of four sections on the Čunovo-Vámosszabadi stretch in hydrological year 2009 are the following: a) Čunovo - Dunakiliti
section. The water level in this section has been impounded since
construction of the submerged weir. This impounded section supplies water into
the right side river branch system. The amount of water released to the river
branch system is determined by water level regulation at the Dunakiliti dam.
Since putting the submerged weir into operation the water level is kept in the
mid-water riverbed. Average flow velocities fluctuated in the range between
0.35-2.43 m.s-1. In hydrological year 2009 discharges exceeding 600
m3.s-1 were released into the Danube old riverbed on
several occasions: during the artificial flooding of the right side river
branch system (April-May 2008), during the flood wave in June and during
technical maintenance of the water barrage system (July and August 2009), the
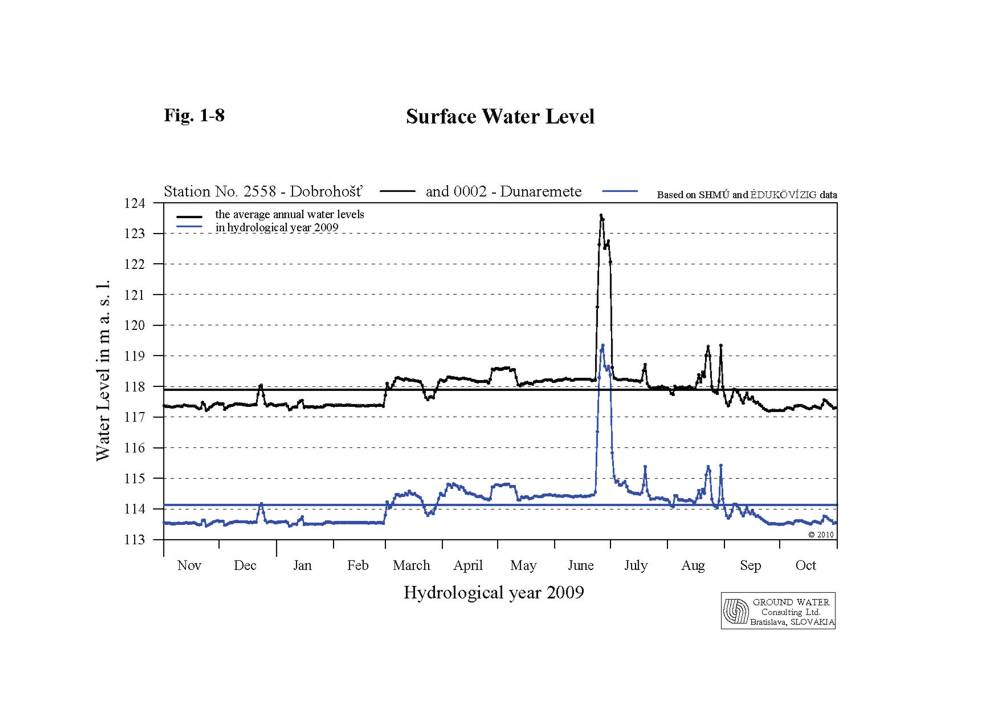
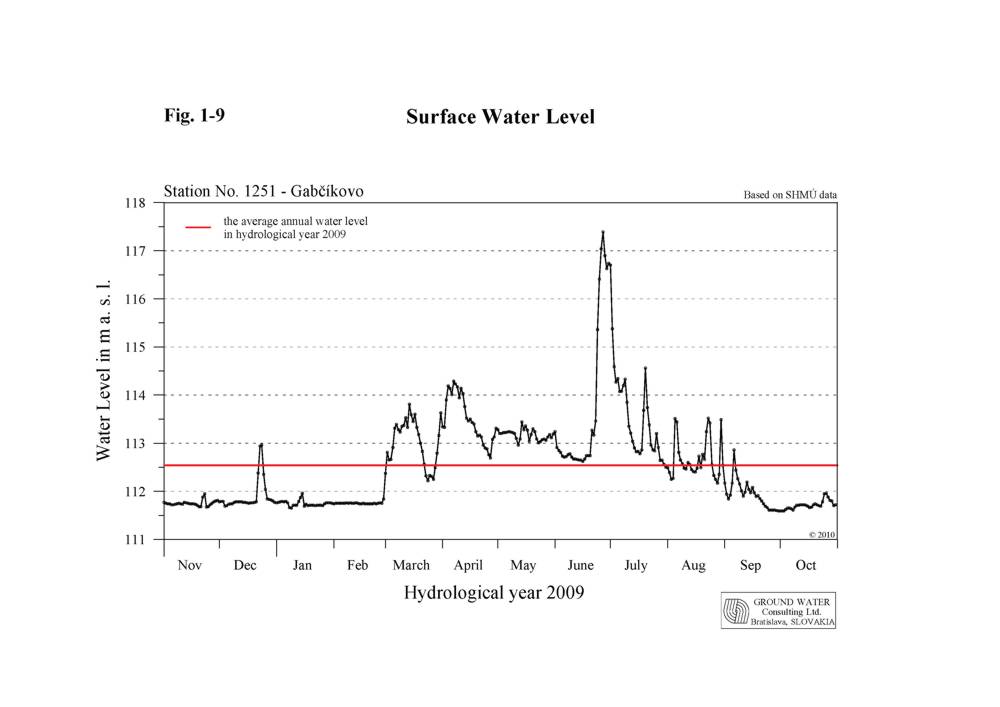
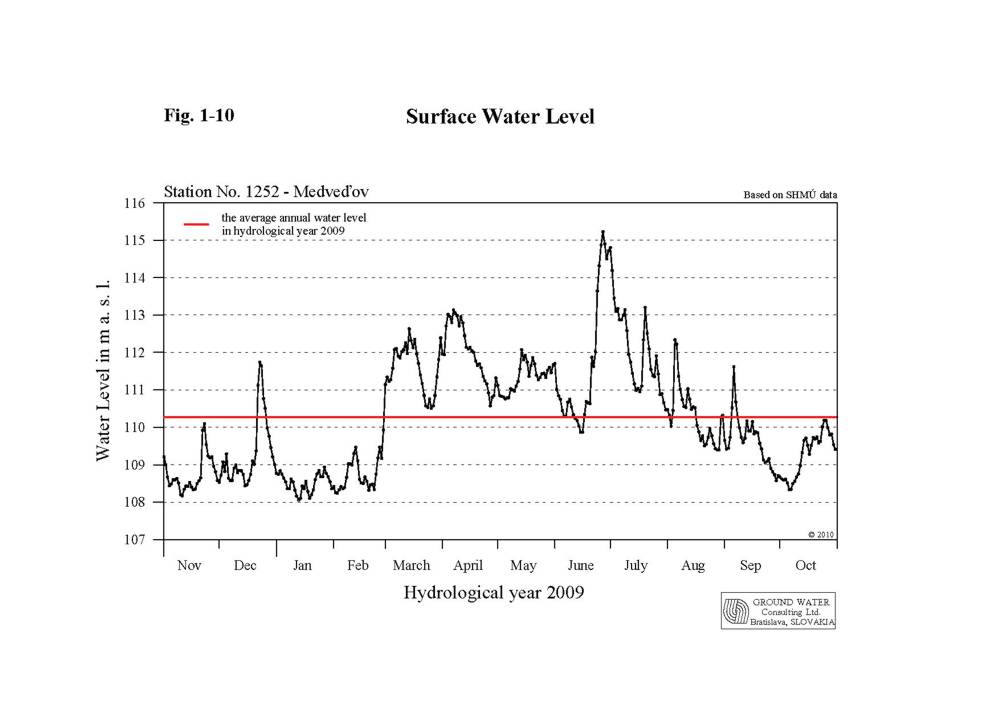
maximal average daily flow rate was 3756 m3.s-1. b) Section between Dunakiliti and Dunaremete. This section of Danube is not influenced by any measures and the water level is determined only by the flow rate in this river section. In the upper part of this section the water level in river branches is about 3 m higher than the water level in main riverbed. The average daily water level at the Dobrohošť gauging station (rkm 1838.6) fluctuated in the range from 117.19 to 123.59 m a. s. l. and the average annual water level was 117.89 m a. s. l. The average daily water level at the Dunaremete profile (1825.5) fluctuated from 113.44 to 119.34 m a. s. l. and the average annual water level was 114.13 m a. s. l (Fig. 1-8). Average flow velocities fluctuated in the range between 0.89 - 2.30 m.s-1. c) Section between Dunaremete and Sap. The water level in this section is influenced by the backwater effect from the confluence of the tailrace canal and the Danube old riverbed (rkm 1811). The water level changes, especially in the lower part of this section, are influenced by the flow rates in the tailrace canal. The length of the upstream section influenced by the backwater effect depends on the actual flow rate distribution between the hydropower station and the Danube old riverbed. At regular operation it can be stated that the backwater effect reaches the Dunaremete profile (rkm1825.5) at flow rates over 2500 m3.s-1 at Medveďov. The average daily water level at the Gabčíkovo gauging station (rkm 1819) fluctuated in the range from 111.59 to 117.39 m a. s. l. and the average annual water level was 112.54 m a. s. l (Fig. 1-9). The daily water level fluctuation at the Gabčíkovo gauging station in the Danube old riverbed can reach app. 0.20 m as a consequence of hydropower station operation. d) Sap – Vámosszabadi section. The flow rate in this section approximately equals to the flow rate at Bratislava and is additionally influenced by the Gabčíkovo hydropower station operation. The daily water level fluctuation at this stretch (up to 0.30 m) depends on the hydropower station operation. Higher changes occur at low flow rates in the Danube due to the ratio of the total flow rate and the capacity of one turbine, which may be put into operation or stopped. The average annual flow rate at the Vámosszabadi-Medveďov profile in 2009 was 2122 m3.s-1. The average daily water level at Medveďov profile (rkm 1806.3) fluctuated in the range from 108.06 to 115.23 m a. s. l. and the average annual water level was 110.27 m a. s. l (Fig. 1-10). Average flow velocities fluctuated in the range between 1.24 - 2.09 m.s-1
|
|||||||||||||||||||||||||||||||||||||||||||||||||||||||||||||||||||||||||||||||||||||||||||||||||||||||||||||||||||||||||||||||||||||||||||||||||||||||||||||||||||||||||||||||||||||||||||||||||||||||||||||||||||||||||||||||||||||||||||||||||||||||||||||||||||||||||||||||||||||||||||||||||||||||||||||||||||||||||||||||||||||||||||||||||||||||||||||||||||||||||||||||||||||||||||||||||||||||||||||||||||||||||||||||||||||||||||||||||||||||||||||||||||||||||||||||||||||||||||||||||||||||||||||||||||||||||||||||||||||||||||||||||||||||||||||||||||||||||||||||||||||||||||||||||||||||||||||||||||||||||||||||||||||||||||||||||||||||||||||||||||||||||||||||||||||||||||||||||||||||||||||||||||||||||||||||||||||||||||||||||||||||||||||||||||||||||||||||||||||||||||||||||||||||||||||||||||||||||||||||||||||||||||||||||||||||||||||||||||||||||||||||||||||||||||||||||||||||||||||||||||||||||||||||||||||||||||||||||||||||||||||||||||||||||||||||||||||||
