PART 6
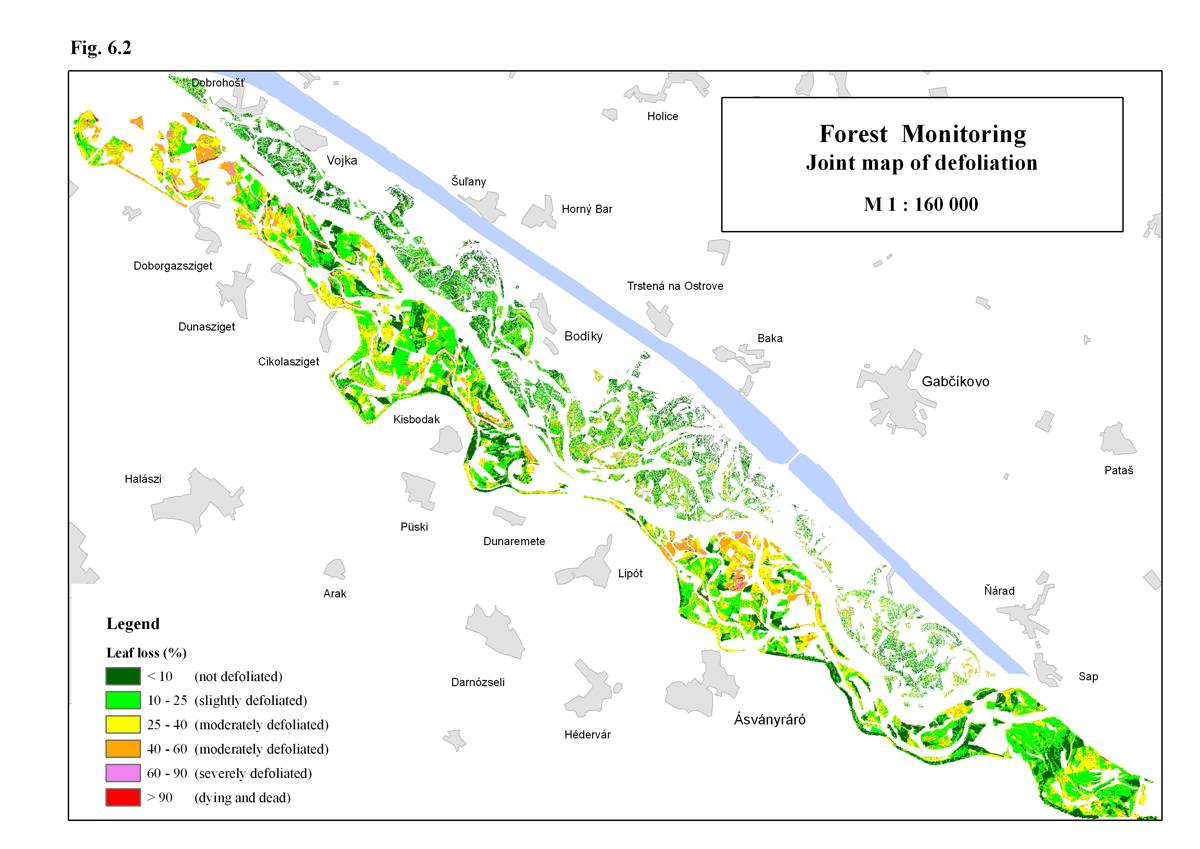
Forest MonitoringThe development of forest communities in 2008 (including fauna and flora evaluated in Part 7 – Biological Monitoring) was on both sides, Slovak and Hungarian, influenced by abiotic conditions, which can be summarized as follows: The meteorological and hydrological conditions were favourable from the forest and biota development point of view, but they were not typical. The soil moisture reserves created during the winter period represented a good base for initiation of plants growth in the spring. In spite of the lack of precipitation from the beginning of spring until the middle of May the vegetation could gain moisture from the soil profile. The air temperature values were average during this period. The moisture deficit in the upper soil layers was replenished by precipitations in May, June and second half of July. Favourable impact on vegetation had the temperature decrease in July and August. However, the Danube flow rates in this period, especially in June and first half of July, significantly dropped below the long-term daily average values, which resulted in groundwater level decrease as well. The end of the vegetation period was less favourable from the vegetation point of view. Flow rates in the Danube fluctuated deeply below the average daily values and this period was also poor in precipitation. Unfavourable was the absence of floods on the Danube, no natural flooding of the left and right side inundation occurred. However, positive impact had the increased discharge into the river branches during May and June, which resulted in increase of groundwater levels. Artificial flooding of the Slovak or Hungarian inundation area was not realised. The lack of precipitation in August was partially eliminated by higher discharge into the Danube old riverbed due to the technical maintenance on the Power station. 6.1. Evaluation of the Slovak territoryThe forest monitoring on the Slovak side is carried out on monitoring areas in the inundation. The list of monitored sites is presented in Table 6-1 and the situation is shown on Fig. 6-1. The Slovak Party on monitoring areas in the actual year evaluated the development of basic growth parameters, weekly girth growth and the health state of trees by terrestrial and aerial survey. The aerial survey of the Slovak inundation area is carried out regularly since 1996 every three years. Joint map of forest stands defoliation of the Slovak and Hungarian side was compiled for the first time in the evaluated year. National maps of defoliation were used for the compilation – Fig. 6-2. In the Slovak inundation area the development of the most productive cultivated poplars are observed. The mostly spread poplar clone Pannonia gradually replaces stands of cultivated poplars I-214 and Robusta cleared in last years. The areal spreading of willow stands in the whole inundation area decreases; at present observation of weekly girth growth only is realized on one substitutional monitoring area. The monitored forest communities mostly represent the development of the stand conditions in different parts of the inundation area after putting the Gabčíkovo hydropower structure into operation. The main aspects of the moisture development in these regions were characterized in previous Joint Annual Reports on environment monitoring (e.g. in years 2003 or 2004). Table 6-1: List of the forest monitoring areas on the Slovak side
* - on sub-areas marked by letters “a” or “b” temporary measurement of weekly girth growth is carried out only The development of forest stands in the evaluated year mostly did not left the existing tendencies, but some positive changes were registered. The quality classification according to the height increase remained unchanged in the older stands and reaches very good level (areas No. 3802, 3803). Gradually it becomes truth also for the young stands with the “Pannonia” poplar clones, which were considered as problematic after the reforestation. At present gradual improving of their state and stabilisation of growth increments is registered (areas No. 2681, 2684, 2687). These young stands are healthy as well, no further replacement of dried trees, which was necessary in previous years, is needed. Significant improving of height increment was registered in young stands on areas No. 2685 and 2689. Based on weekly girth growth increments significant improving of width increments can be registered in the whole area along the Danube stretch between Dobrohošť and Sap for the second year (poplar and white willow stands are observed). The trees in 2007 and 2008 reached significantly higher width increments (twice or triple) than in the previous period. Zero weekly girth growth values were significantly reduced already in 2007, and in 2008 they occurred very sporadically. The unambiguous reason of these changes was not identified yet, but probably it can be assigned to the actual hydro-meteorological conditions. The growing period of the evaluated year was long; growing was registered already in the first week of April and lasted till the end of September. The monitored cultivated poplar stands are healthy, resistant to pests and immune to illnesses. The occurrence of illnesses and pests in most of stands was sporadic during the whole growing period. An exception was the slight spreading of fungicidal illness at several stands in August, but in general the spreading of illnesses in August was higher than in June. Premature yellowing and defoliation in July and August, when the precipitation was relatively rich, were not registered. The results of aerial survey focused on the forest stands health state in the Slovak inundation area show very good state of softwood forest (Fig. 6-2). Although the health state in 2008 was slightly worse than during the previous survey in 2005, the differences are assigned to more precise methodology of the defoliation evaluation and to improvement of the quality of aerial photos enabling to identify the defoliation on the level of individual treetops. The average defoliation in 2008 was 17.9 % with an uncertainty of ±2.3 %, which means that it is higher by 2.5 % than in 2005. The average defoliation value for deciduous forest according to the national monitoring reached 21.2 %. This means that the natural and site-specific conditions in the monitored area are favourable. The assumption of adverse impact of the Gabčíkovo hydropower structures on the forest health state on large area was not proved. It have to be mentioned, that on the Joint Map of forest stands defoliation in the Slovak and Hungarian inundation area (Fig. 6-2) results on pixel level had been shown in order to achieve some comparability of results of both Parties. Also the defoliation range was modified, applying the ICP Forests methodology. The map of forest stands defoliation on the level of individual forest areas is given in the Slovak National Report on environmental monitoring in 2008. In spite of the above mentioned positive results it should be repeatedly emphasized the necessity of the most effective utilisation of existing weirs in the river branch system for elimination of groundwater level decrease and for application of artificial floods. In the lower part, in the Istragov region the water supply have to be solved to recharge the river branch system. Also the impact of erosion of the Danube riverbed, below the confluence of the Danube old riverbed and the tailrace canal, has to be monitored. 6.2. Evaluation of the Hungarian territory and the Joint Slovak-Hungarian evaluation of defoliation based on aerial surveyThe forest monitoring on the Hungarian side in year 2008 was carried out on monitoring areas presented in Table 6-2. All areas, except monitoring sites at Hédervár 11B and Ásványráró 45A, are situated in the inundation area (Fig. 6-1). However, the observed stands situated out of the inundation area were cleared in previous two years. On areas listed below the dendrometric characteristics were measured, the health state of stands were observed and on selected sites the weekly girth growth was registered. These data were mentioned in the Hungarian National Annual Report in tabular form only. Table 6-2: List of the forest monitoring areas on the Hungarian side
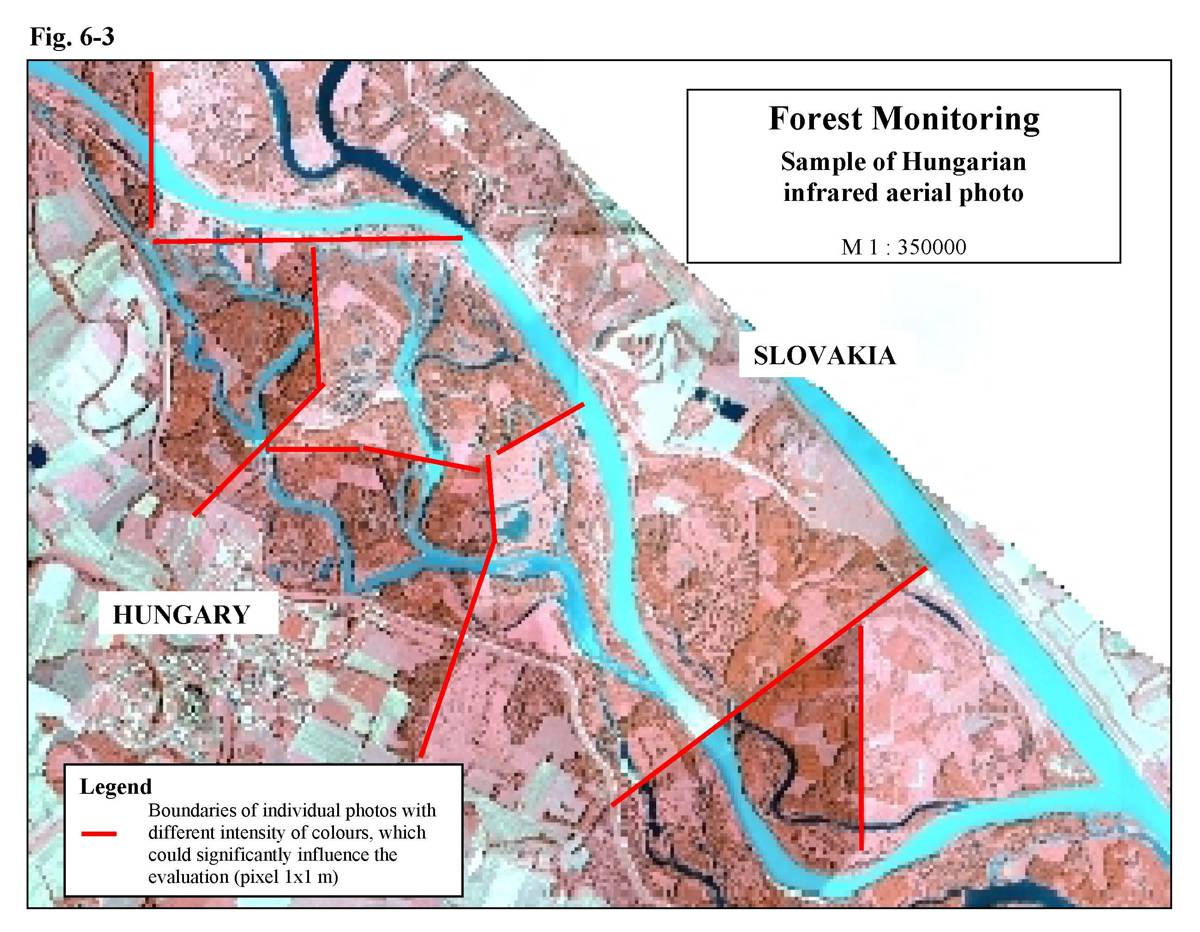
In the actual year forest stands health state in the Hungarian inundation area based on aerial survey was evaluated as well. The present evaluation was the first one, which was focused on the forest health state on large area performed on the Hungarian side. Aerial survey was done in 2003 as well, however the evaluation was focused on changes in forested area (land use). The actual evaluation was done in close cooperation with experts of the Slovak party in order to achieve comparable results on both sides of the Danube. However, evaluations given in National Reports were not comparable due to several differences in technical parameters of aerial photographing and in evaluation on the Slovak and Hungarian sides. Descriptions of the methodology of aerial photographing and of the evaluation are parts of the respective National Annual Reports on monitoring on the Slovak and Hungarian sides. Following additional consultancy between the Slovak and Hungarian Party new evaluation of the Hungarian territory was performed. New results from the Hungarian side and results from the Slovak side were compiled into a Joint Map of Defoliation – Fig. 6-2. Two substantial changes in methodology were applied in the new evaluation of the Hungarian side, which significantly improved the Hungarian leaf loss map:
There persist several differences in comparison with the methodology used by the Slovak Party, but they mainly originate in technical parameters of the aerial survey:
Compilation of Joint Map of Defoliation (Fig. 6-2) required unification of the level for forest health state evaluation. The evaluation on pixel level was chosen, because of not precise definition of boundaries of the individual forest stands (areal distribution of forest units) on the Hungarian side. Similarly, unified range for expression of the defoliation level had to be chosen as well. The ICP Forest methodology was chosen. Based on the Joint Map of Defoliation it can be stated that the defoliation of forest stands on the Slovak side are low almost in the whole inundation area. Defoliation map of forest stands on the Hungarian side shows that the defoliation parameters are less favourable in the Dunakiliti, Kisbodak and Lipót regions, which is conform with the field results. Good state was identified in the lower part, where the backwater effect took place or at places where the soil profile reach higher thickness upon the gravel layers. These results correspond to results mentioned in the Hungarian National Report as well. The subject of further analysis will be further examination of the identified differences arising from the Joint Map of Defoliation and the identification of the dependency between the defoliation results and the wood production. Further improvement of the evaluation methodology is required as well to increase the comparability of Slovak and Hungarian results.
|

|
 |
 |
|
Fig. 6-1 Monitoring network of observation objects
agreed in the frame of the Joint monitoring |
Fig. 6-2 Joint map
of defoliation |
Fig. 6-3 Sample of aerial photo |