PART 1
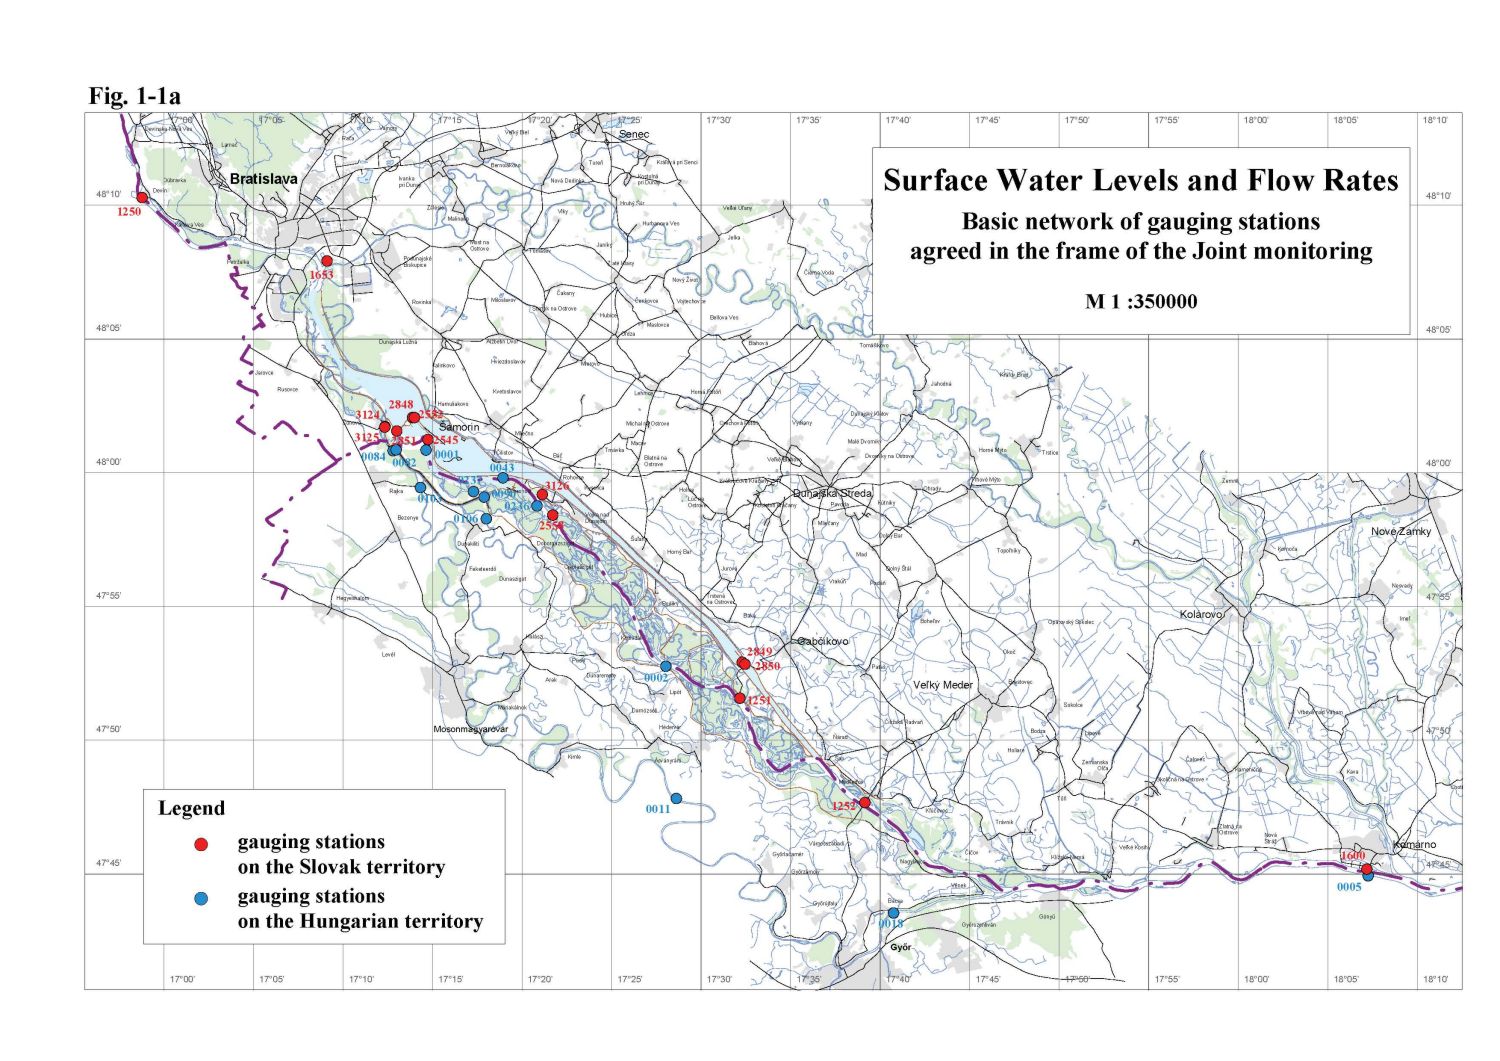
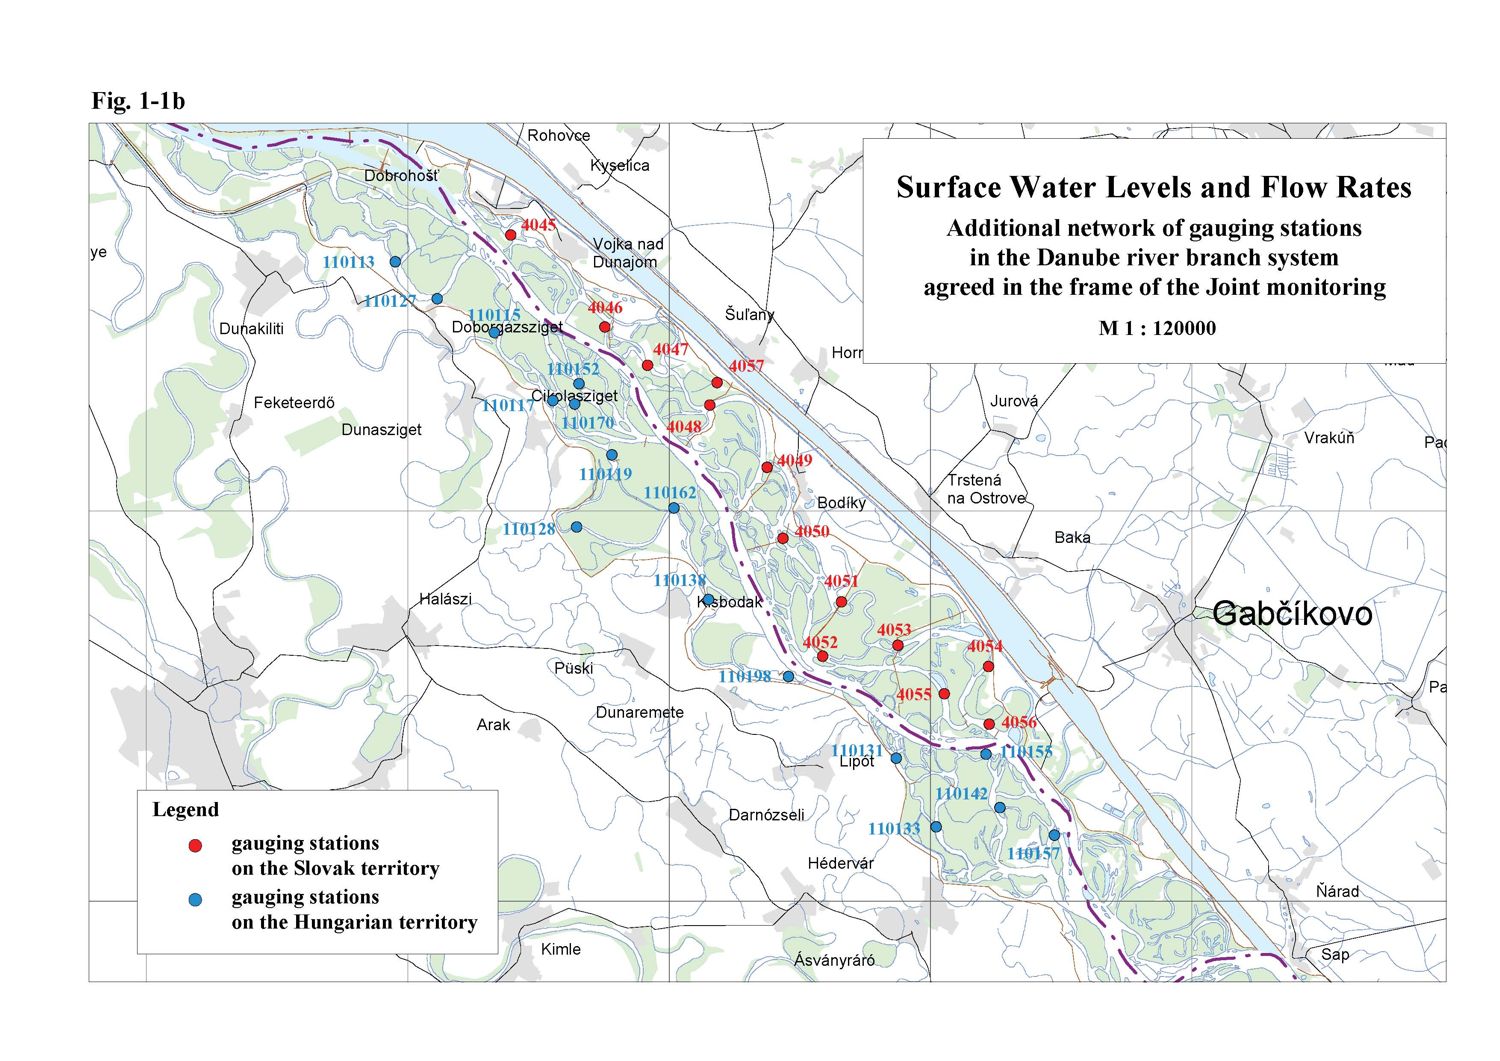
Surface water levels and flow ratesSimilarly to the previous years there were no changes registered in the monitoring of surface water levels and discharges. The evaluation of the surface water regime is carried out for so called hydrological year (period from November 1 of the previous year to October 31 of the evaluated year). Surface water level recording in the hydrological year 2008 was carried out at 28 gauging stations on the Slovak side and 29 gauging stations on the Hungarian side (Tab. 1-1). On several gauging stations flow rate calculations were performed (10 gauging stations on each side). The observation network is shown in Fig. 1-1a, Fig. 1-1b. The Parties in the intergovernmental Agreement have agreed to mutually exchange data from these gauging stations. Common flow rate measurements helped the joint evaluation of flow rates discharged into the Danube downstream of the Čunovo dam and into the Mosoni branch of the Danube. Based on mutual evaluation of common measurements, time series data were accepted. These data create the basis for joint evaluation of measures and water supply realised according to Articles 1-3 of the Agreement. Table 1-1: List of gauging stations
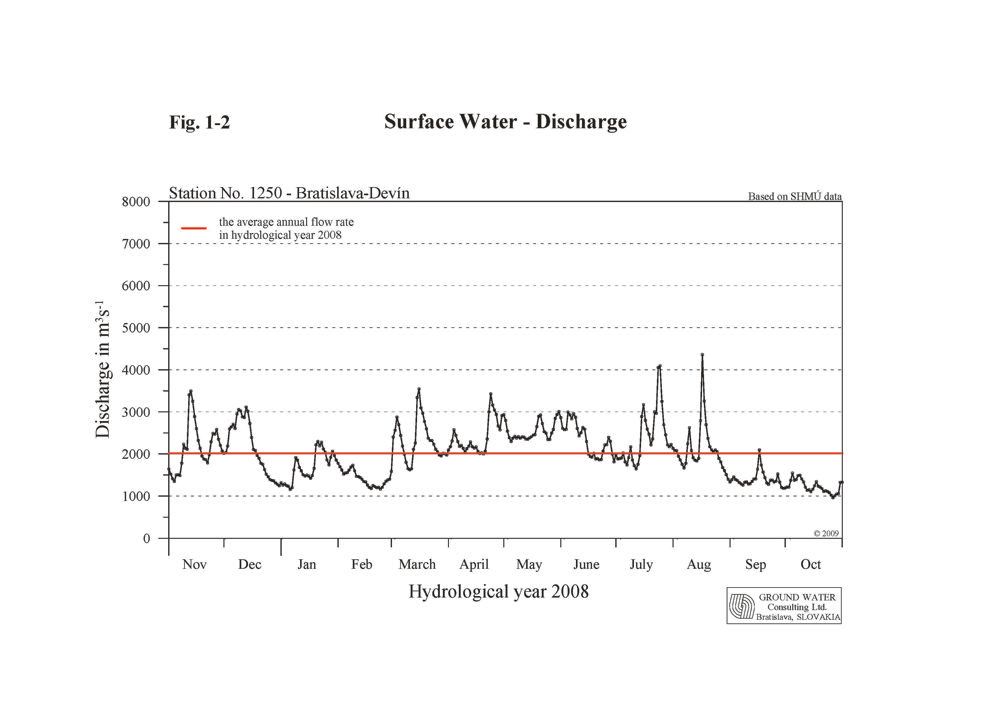
As a part of the intergovernmental Agreement, signed on April 19, 1995 a temporary water management regime was set up. It was agreed that in the case of average annual flow rate of 2025 m3.s-1 in the Danube at the Bratislava-Devín gauging station an annual average of 400 m3.s-1 should be discharged into the Danube old riverbed downstream of the Čunovo weir. The actual daily amount of water is governed by the flow rate reaching the Bratislava-Devín profile, taking into consideration the rules of operation described in Annex 2 of the Agreement. The flow rate in the vegetation period, depending on hydrological conditions, should fluctuate from 400 to 600 m3.s-1; in non-vegetation period the flow rate should not be less than 250 m3.s-1. In case of flow rates over 5400 m3.s-1 the amount of water above 600 m3.s-1 discharged through the Čunovo weir is not taken into consideration when the annual average is calculated. An additional 43 m3.s-1 of water was agreed in the Agreement to be discharged into the Mosoni branch of the Danube and the right side seepage canal. The gauging station Bratislava-Devín plays a key role in determining the amount of water to be discharged into the old Danube riverbed downstream of the Čunovo weir. The annual minimum daily flow rate 900 m3.s-1 occurred on October 27, 2008, when the average daily flow rate was 958.5 m3.s-1. The annual maximum flow rate occurred on August 17, 2008, when it reached 4780 m3.s-1, with a maximum average daily flow rate of 4361 m3.s-1. The average annual flow rate at this station in the hydrological year 2008 reached 2014 m3.s-1, which belongs to an average flow rate on the Danube (Tab. 1-2). Considering the course of water levels and flow rates during the hydrological year 2008 it can be stated that no unusual values occurred. However, the course was again not typical. Extremely dry or extremely water rich months did not occurred. February and the period from June to October 2008 belonged to dry months. April and May were moderately water rich, while the remaining months - November and December 2007, January and March 2008 belonged to water rich months. Table 1-2: Average annual flow rates
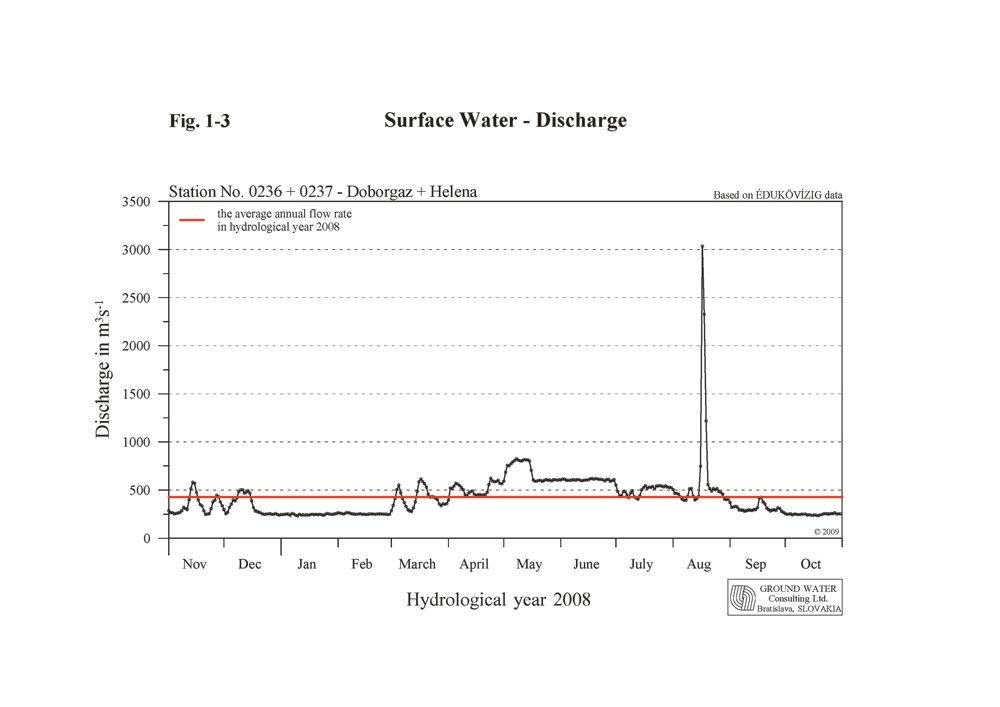
Rich rainfalls in the Austrian and German catchments area significantly influenced the flow rates in the Danube at he beginning of the hydrological year 2008 (November and the first half of December 2007). The average daily discharges till the half of December fluctuated almost entirely over the long-term average values. Decrease of flow rates occurred in the second half of December 2007. The lowest average daily flow rates in the winter period occurred at the end of December 2007, in first decade of January 2008 and in the second half of February 2008. However, contrary to the previous years they did not decreased below 1150 m3.s-1. Following the temporary decrease of discharges, when the precipitation was formed by snow, sudden increase occurred after warming up at the end of February. There were two culminations during the March, from which the second one reached 4175 m3.s-1 (average daily flow rate of 3546 m3.s-1). After the culmination the flow rates decreased below the long-term average values and fluctuated around 2000 m3.s-1. At the end of April due to rich precipitation in the German catchment area an increase exceeding 3000 m3.s-1 occurred again. During the May and in the first half of June 2008 the average daily flow rate values fluctuated around the long-term average values and varied between 2200 and 3000 m3.s-1, while in the second half of June and first half of July they decreased and fluctuated below the long-term average values, they varied around 2000 m3.s-1. In July and August 2008 two discharge waves occurred, which exceeded 4000 m3.s-1. The discharge wave in July was caused mainly by rich precipitations in the Austrian catchment area and culminated at 4612 m3.s-1. The discharge wave in August was caused by rich precipitations in both, the Austrian and German catchments area and culminated on August 17, 2008 at 4780 m3.s-1, which represented the yearly maximum value (average daily discharge was 4361 m3.s-1). Flow rates after the culmination decreased gradually and practically till end of the hydrological year they fluctuated below the long-term average values. In the middle of September an inconsiderable discharge wave occurred, slightly exceeding 2000 m3.s-1. The end of the hydrological year can be characterized as a low discharge period. The lowest flow rates occurred mostly in the second half of October 2008, when the yearly minimum occurred as well. The flow rate at October 27, 2008 decreased to 900 m3.s-1 (average daily value was 958.5 m3.s-1). The course of flow rates during the hydrological year 2008 at gauging station No. 1250 - Bratislava-Devín is shown in Fig. 1-2. 1.1. Discharge into the Danube downstream of Čunovo weirThe determination of the average daily amount of water discharged into the Danube downstream of the Čunovo weir was based on average daily flow rates determined at stations Doborgaz and Helena (Fig. 1-3). At these stations joint flow rate measurements were performed to determine the flow rate supplied into the Danube old riverbed. The monthly characteristics of the daily average flow rates into the Danube in the hydrological year 2008 were as follows:
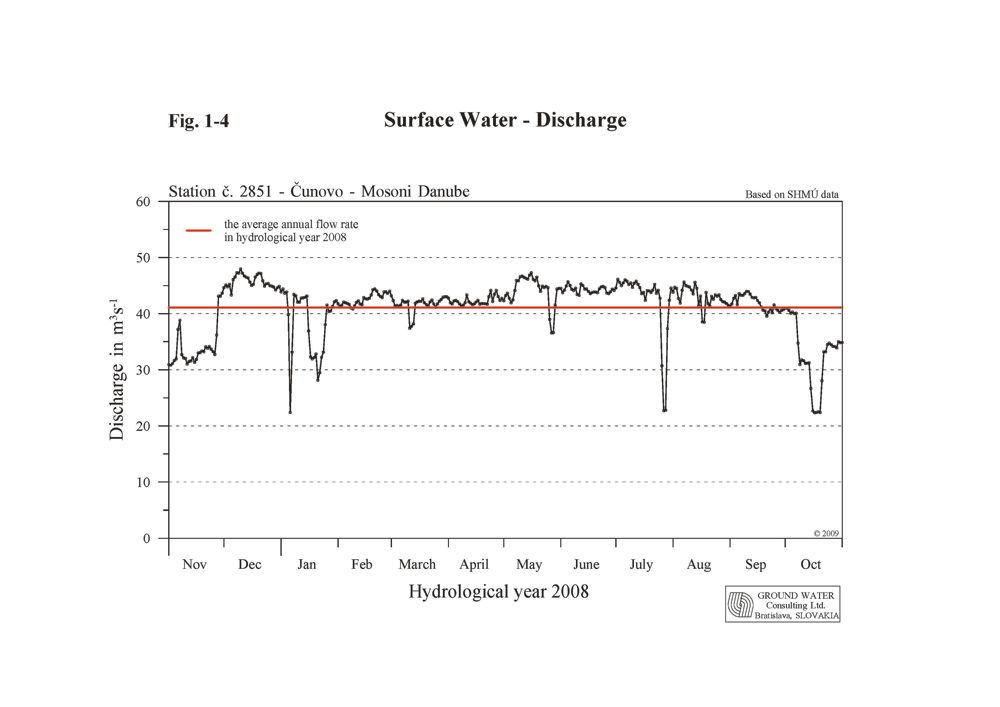
The average annual flow rate in the Danube at the Bratislava-Devín profile in hydrological year 2008 was 2014 m3.s-1. Taking into consideration obligations envisaged in the intergovernmental Agreement, the Slovak Party was obliged to release an average annual discharge of 397.8 m3.s-1 into the Danube riverbed downstream of the Čunovo weir. The total average annual discharge released to the Danube downstream of Čunovo was 426.0 m3.s-1. During the hydrological year 2008 it was not necessary to release an amount of water exceeding 600 m3.s-1 into the riverbed downstream of Čunovo due to hydrological conditions. However, in August technical maintenance was performed at the Power Station when the highest discharge wave in 2008 occurred on the Danube. So greater part of the Danube flow rate had to be discharged into the Danube old riverbed. During the culmination it exceeded 3000 m3.s-1. According to the modified method of yearly average discharge calculation, accepted in the Joint Annual Report on the environment monitoring in 2004, no reduction of released discharge had to be done. The average annual flow rate in the Danube old riverbed corresponded to 426.0 m3.s-1, which represents 107.1 % of the amount requested by the Agreement. Even when the discharge exceeding 600 m3.s-1 released during the technical maintenance is reduced to 600 m3.s-1, the average annual flow rate would be 412.6 m3.s-1, which represents 103.7 % of the amount requested by the Agreement. The yearly average minimum of 233.5 m3.s-1 in the Danube old riverbed was measured on January 10, 2008; the yearly average maximum of 3035 m3.s-1 was recorded on August 17, 2008. When evaluating the amount of water discharged to the Danube old riverbed, it can be stated that Slovak Party fulfilled the average annual discharge jointly agreed in the intergovernmental Agreement. Taking into consideration the minimal values prescribed in the Agreement (in the winter period not less than 250 m3.s-1, in the vegetation period at least 400 m3.s-1) it can be stated that considering the accuracy of the measurements (10 %) discharges below 250 m3.s-1 in the winter period, and discharges below 400 m3.s-1 in the summer period did not occurred. 1.2. Discharge into the Mosoni branch of the DanubeAccording to the intergovernmental Agreement, the discharge into the Mosoni branch of the Danube should be 43 m3.s-1, which is composed of both the discharge released to the Mosoni branch of the Danube through the intake structure at Čunovo, and the discharge through the seepage canal. Discharge measurements are carried out downstream of the intake structure on the Slovak territory at 0.160 rkm and also upstream of lock No. I on the Hungarian territory. The average daily discharges were agreed after the joint evaluation of joint discharge measurements performed at both profiles. In this evaluation, data measured just downstream of the intake structure was considered (Fig. 1-4). The monthly characteristics of the amount of water released into the Mosoni Danube through intake at Čunovo in the hydrological year 2008 were as follows:
The average annual discharge was 41.08 m3.s-1. The minimal daily average discharge was 22.35 m3.s-1; the maximal daily average discharge was 47.96 m3.s-1. The flow rate in the right side seepage canal was measured at two sites as well. The first is on Slovak territory at Čunovo; the second is on Hungarian territory at lock No. II. In the evaluation the data observed at lock No. II was considered. The monthly characteristics of the flow rates recorded at lock No. II in the hydrological year 2008 were as follows:
The average annual flow rate was 2.37 m3.s-1. The minimal daily average discharge was 1.34 m3.s-1; the maximal daily average discharge was 3.72 m3.s-1. The monthly characteristics of the total flow rate released into the Mosoni Danube in the hydrological year 2008, consisting of the water amount discharged through the intake structure at Čunovo and water amount flowing in the right side seepage canal, were as follows:
The total average annual flow rate was 43.46 m3.s-1, which represents 101.1 % of the agreed amount. The minimal daily average discharge was 24.33 m3.s-1; the maximal daily average discharge was 51.03 m3.s-1. Regardless the technical (maintenance of turbines) and hydrological conditions it can be stated that the total water amount of 43 m3.s-1 envisaged in the Agreement, discharged through the Mosoni Danube and through the seepage canal, was satisfied. 1.3. Water distribution on the Hungarian territoryThe goal of distributing water on the Hungarian side is to provide a continuous water supply into the inundation area, into the river branches on the flood-protected area and into the Mosoni Danube. 1.3.1. Water supply into the inundation areaRiver branches in the inundation area on Hungarian side can be supplied by water from two sources. These two flows are summed to get the total amount.
The criterions for regulation of water distribution were set up to satisfy the needs determined at right-side river branch system revitalization planning. The reference status was determined at the end of nineties with the involvement of stakeholders. Taking various needs into consideration it reflects the hydrological regime of fifties. Creation of water levels characteristic for this period was targeted in the arms of inundation area. The flow rate was determined as a function of flow rate entering the Bratislava - Devín profile. The environmental status of Szigetköz in the reference period was determined as the most similar to a state, which can be sustained on a long run, and serves adequate riverbed morphology and hydro-geological information for determining the reference status. This is in full harmony with recommendations of the Water Framework Directive and goals of the River Basin Management. Joint discharge measurements by both Parties were performed at the Helena profile. The measurements were jointly evaluated and the average daily flow rate data were accepted. The monthly flow rates characteristics at Helena profile in the hydrological year 2008 were as follows:
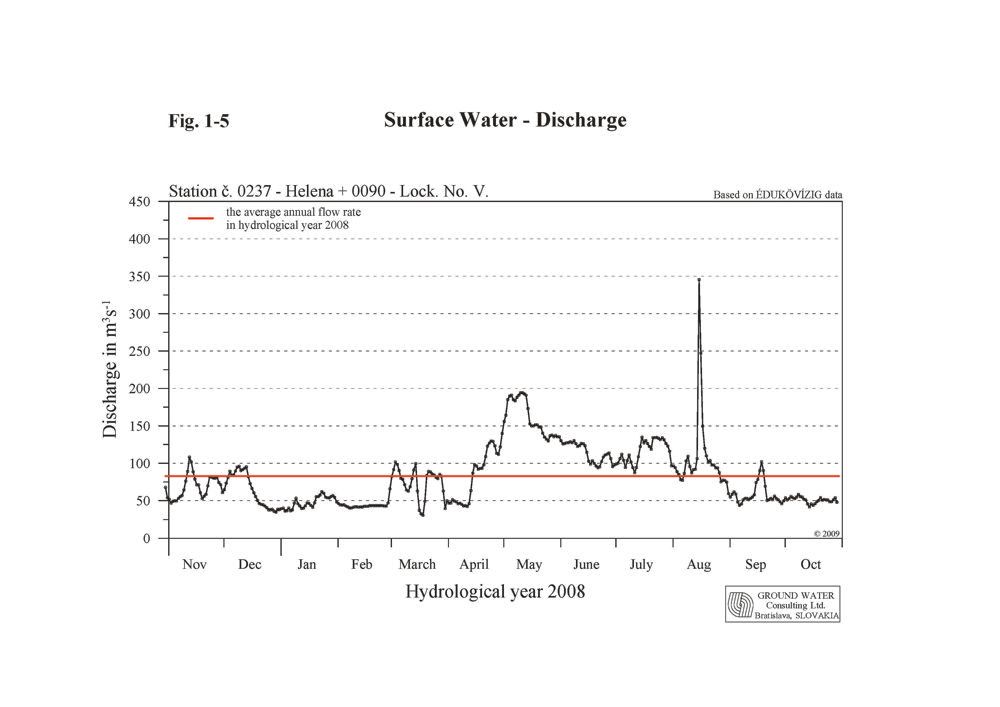
The average annual flow rate was 66.50 m3.s-1. The minimal daily average discharge was 0.49 m3.s-1; the maximal daily average discharge was 345.1 m3.s-1. The monthly flow rates characteristics at lock No. V in the hydrological year 2008 were as follows:
The average annual flow rate was 16.20 m3.s-1. The minimal daily average discharge was 0.00 m3.s-1; the maximal daily average discharge was 36.70 m3.s-1. The monthly flow rates characteristics of the total amount of water released into inundation area in the hydrological year 2008 (Fig. 1-5), consisting of the water amount flowing through the Helena profile and water amount flowing through the Lock. No. V in the right side seepage canal, were as follows:
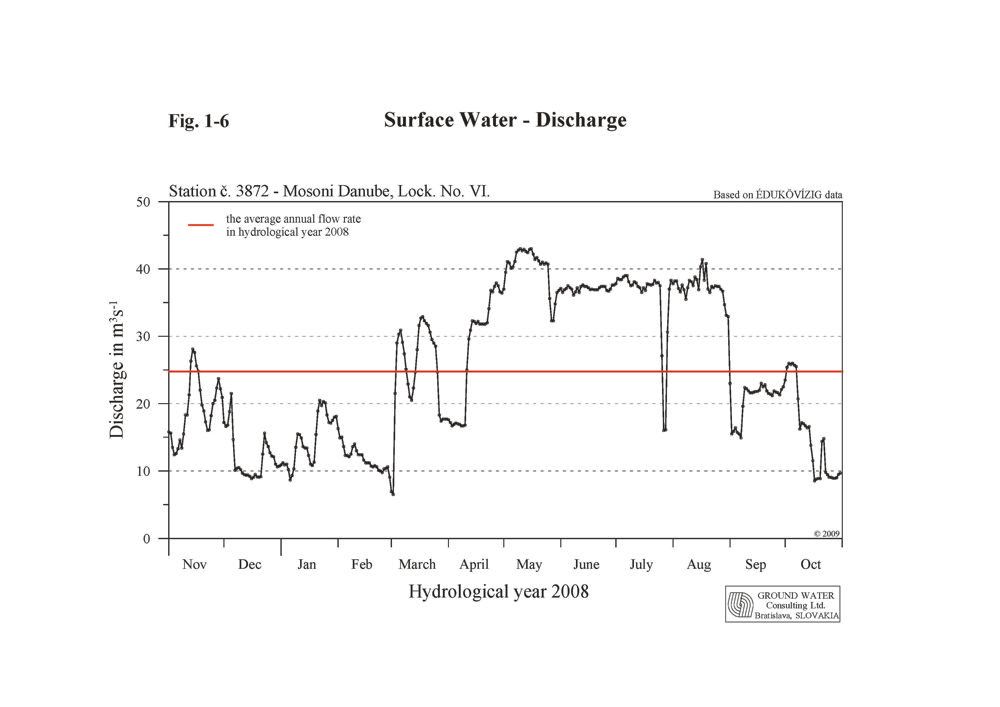
The total average annual flow rate supplied into river branches in the inundation area was 82.70 m3.s-1. The minimal daily average discharge was 30.86 m3.s-1; the maximal daily average discharge was 345.5 m3.s-1. In 2008 artificial flooding of the inundation area on both sides at the same time was realized (May 2-17, 2008). The simultaneous artificial flooding in the left and right side river branch system slightly increased the influence of flooding. The water amount discharged and distributed in the Hungarian river branch system created water levels characteristics for the reference status in the upper part of the inundation area – in the Tejfaluszigeti and Cikolai river branch systems, and along the canal near Lipót. Water levels monitored in the Bodaki and Ásványi river branch systems were slightly higher then the values belonging to the reference status. The lack of revitalization works in the downstream areas plays a role at not achieving the desired status. Based on the above mentioned it can be stated that for the low and medium flow rate periods the target values of the reference status were fairly achieved. However, regarding the every concerned water body, it has to be noticed that the hydro-morphological risk continues to exist. 1.3.2. Water supply into the Mosoni DanubeThe water supply into the Mosoni Danube is secured from the seepage canal through the lock No. VI (Fig. 1-6). The flow rate is measured at the profile downstream of the lock. The monthly characteristics of flow rates through the lock No. VI in the hydrological year 2008 were as follows:
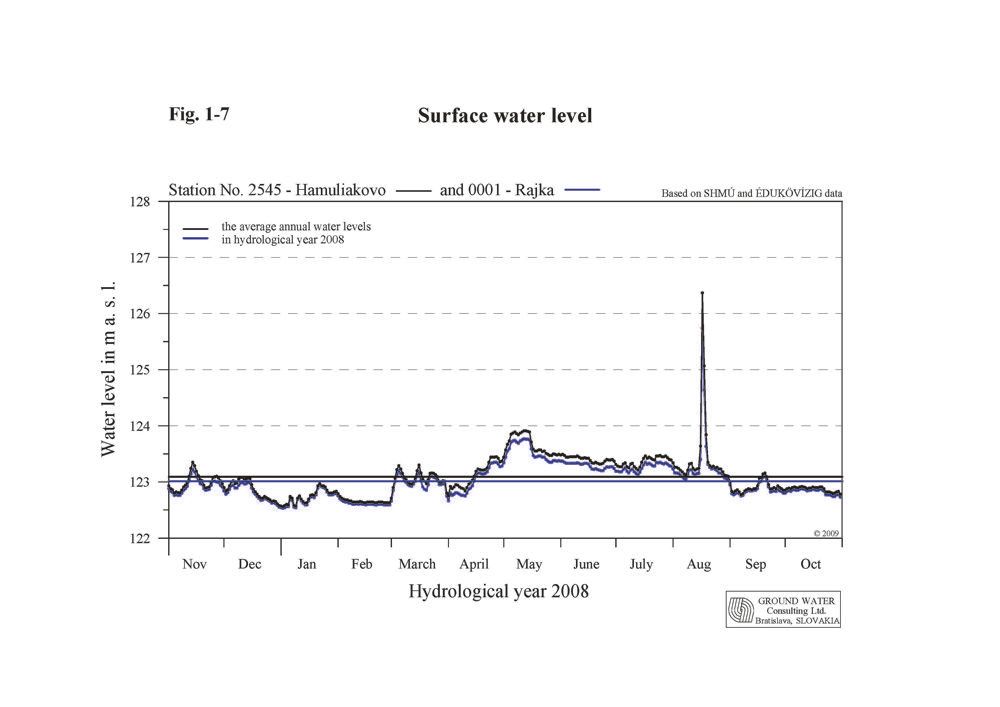
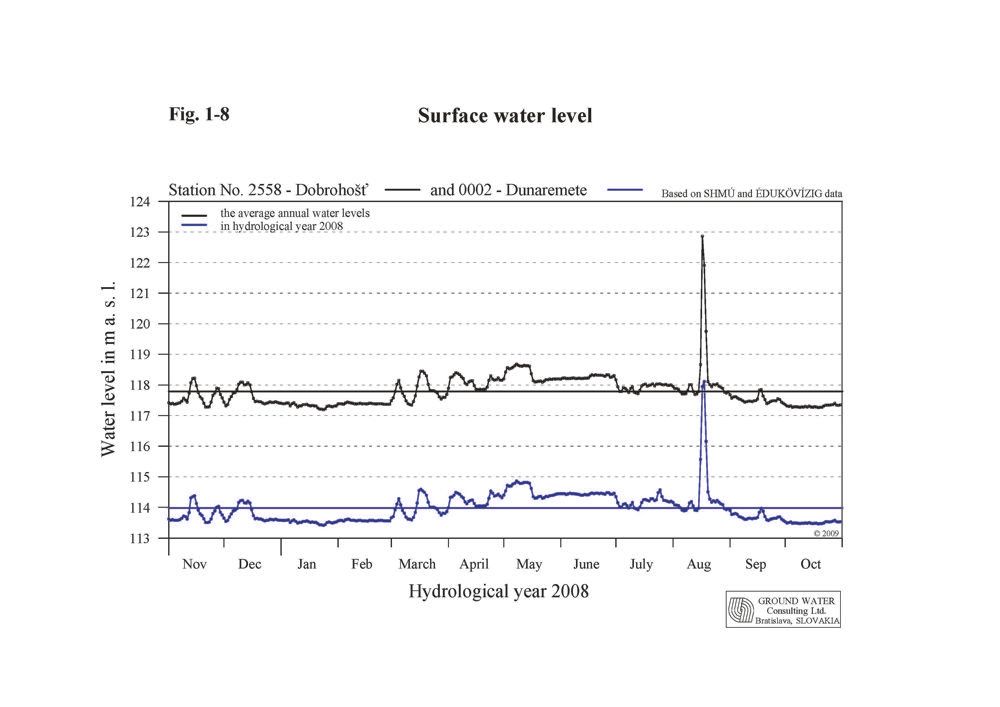
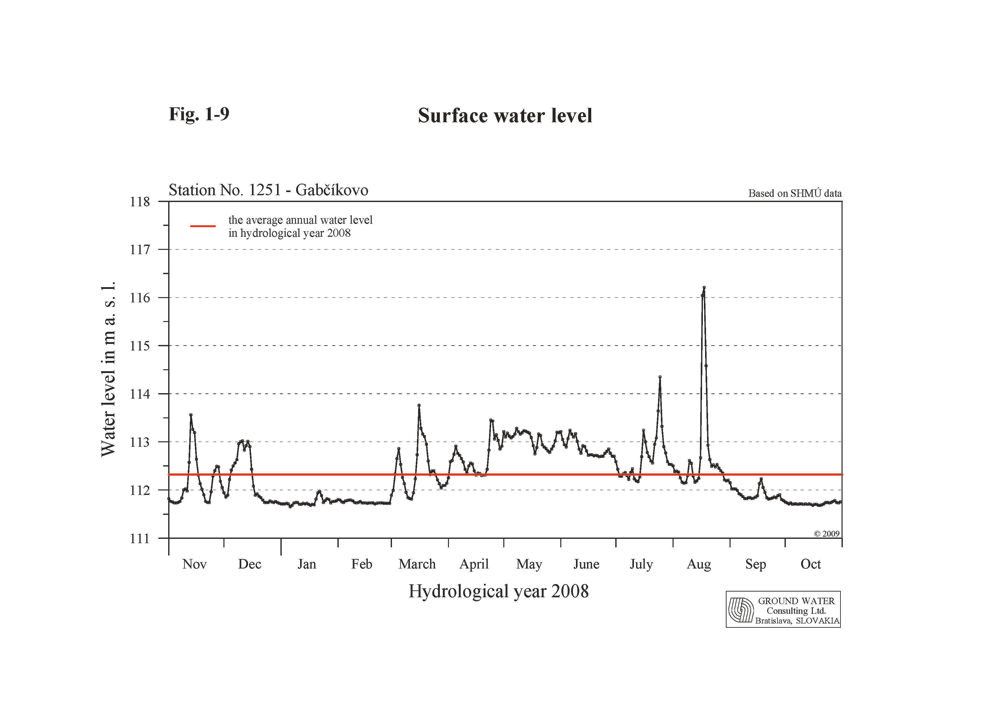
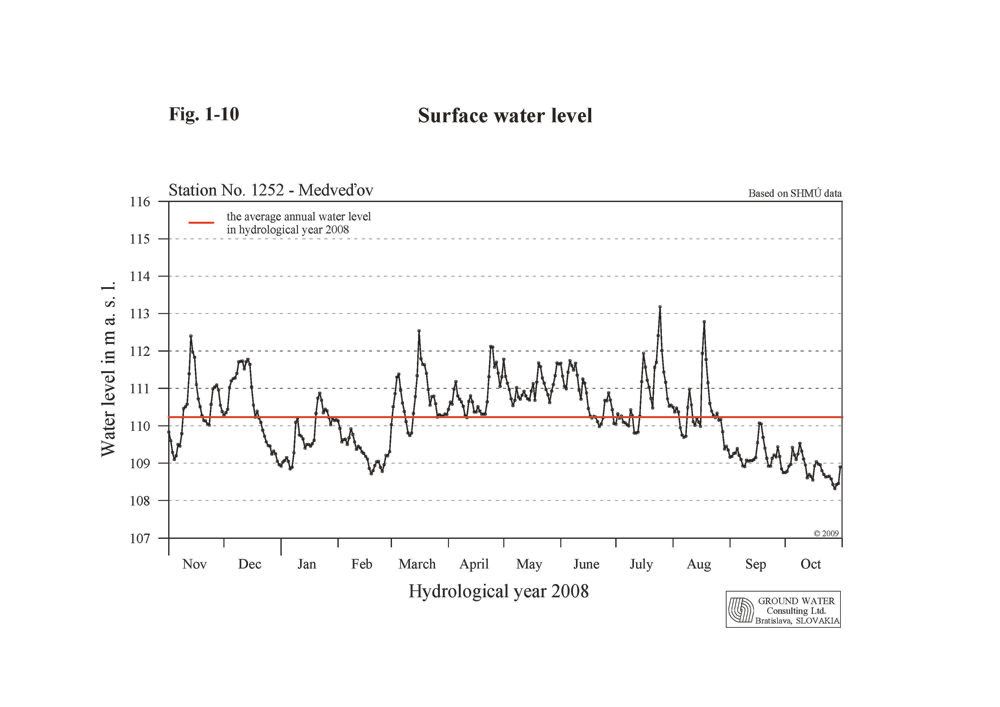
The average annual flow rate in the Mosoni Danube at lock No. VI. was 24.77 m3.s-1. The minimal daily average discharge was 6.49 m3.s-1; the maximal daily average discharge was 43.0 m3.s-1. The water supply regime is regulated by rules of operation and follows the Danube’s water regime. In non-vegetation period a low water period was simulated again in the Mosoni Danube. This was realised by redirecting a greater part of the water amount into the inundation area. Besides its water supply function lock No. I also has a flood protection function. It prevents floods entering the flood-protected area. 1.4. The Danube water level characteristics on Čunovo-Vámosszabadi stretchThe Danube stretch between Čunovo and Vámosszabadi can be divided into four different sections according to the prevailing influence. These sections can be characterised by data obtained from the following gauging stations: Rajka and Hamuliakovo, Dunakiliti, Doborgaz and Dobrohošť, Dunaremete and Gabčíkovo. Vámosszabadi and Medveďov. The characteristics of four sections on the Čunovo-Vámosszabadi stretch in hydrological year 2008 are the following:
|
|||||||||||||||||||||||||||||||||||||||||||||||||||||||||||||||||||||||||||||||||||||||||||||||||||||||||||||||||||||||||||||||||||||||||||||||||||||||||||||||||||||||||||||||||||||||||||||||||||||||||||||||||||||||||||||||||||||||||||||||||||||||||||||||||||||||||||||||||||||||||||||||||||||||||||||||||||||||||||||||||||||||||||||||||||||||||||||||||||||||||||||||||||||||||||||||||||||||||||||||||||||||||||||||||||||||||||||||||||||||||||||||||||||||||||||||||||||||||||||||||||||||||||||||||||||||||||||||||||||||||||||||||||||||||||||||||||||||||||||||||||||||||||||||||||||||||||||||||||||||||||||||||||||||||||||||||||||||||||||||||||||||||||||||||||||||||||||||||||||||||||||||||||||||||||||||||||||||||||||||||||||||||||||||||||||||||||||||||||||||||||||||||||||||||||||||||||||||||||||||||||||||||||||||||||||||||||||||||||||||||||||||||||||||||||||||||||||||||||||||||||||||||||||||||||||||||||||||||||||||||||||||||||||||||||||||||||
