PART 1
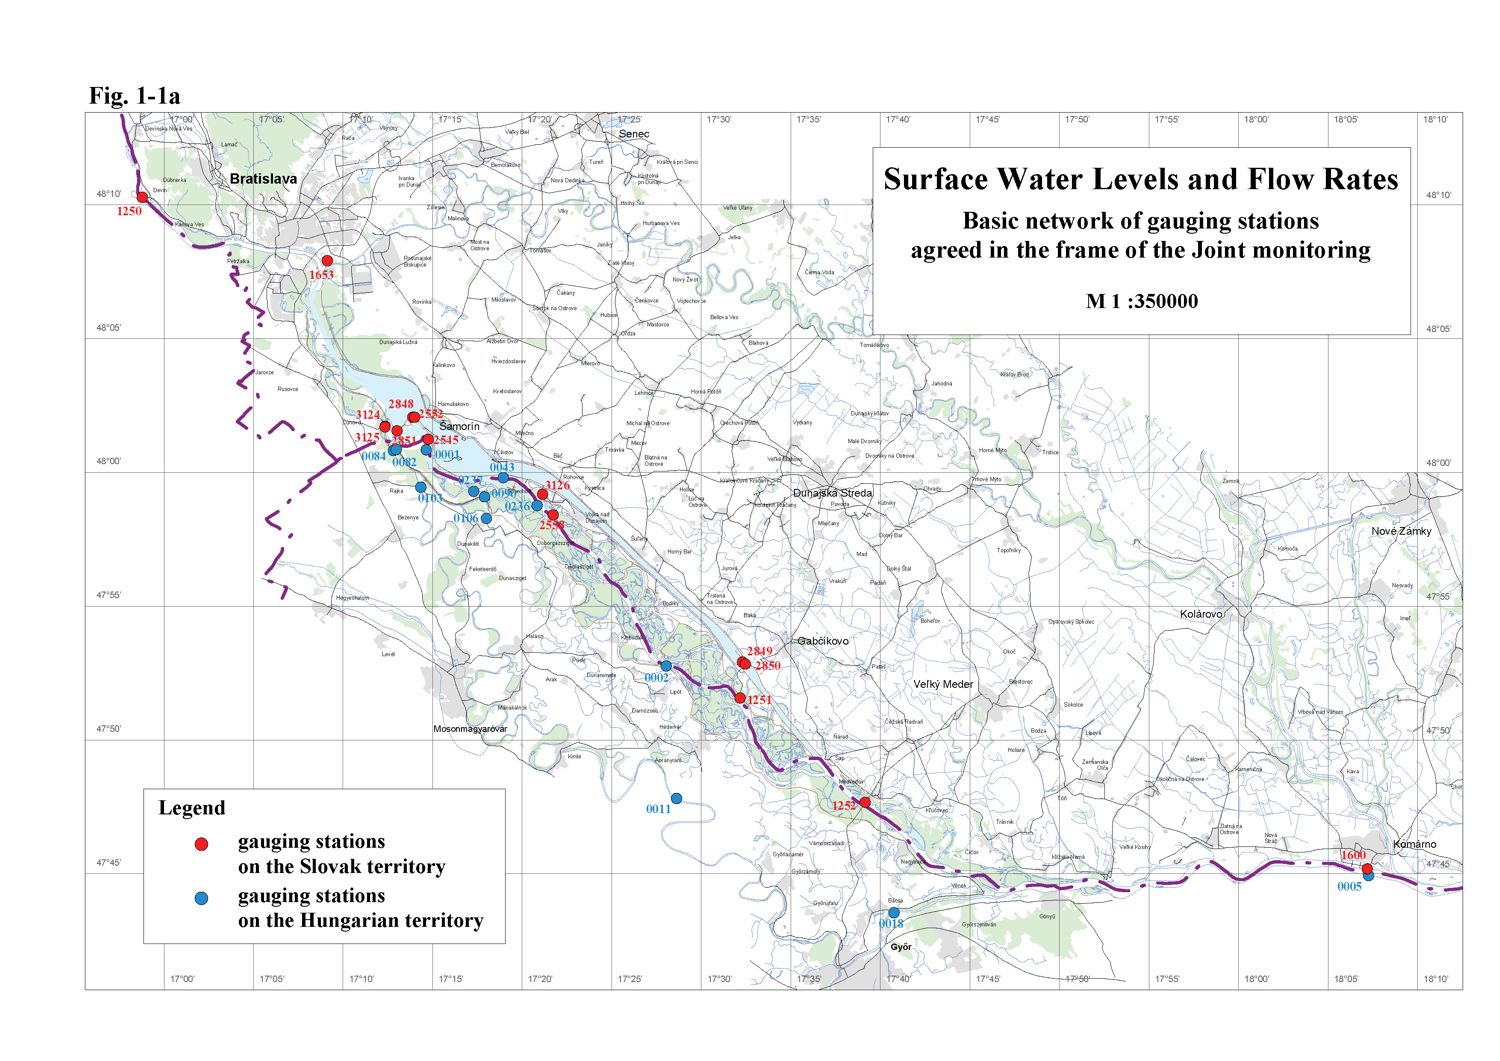
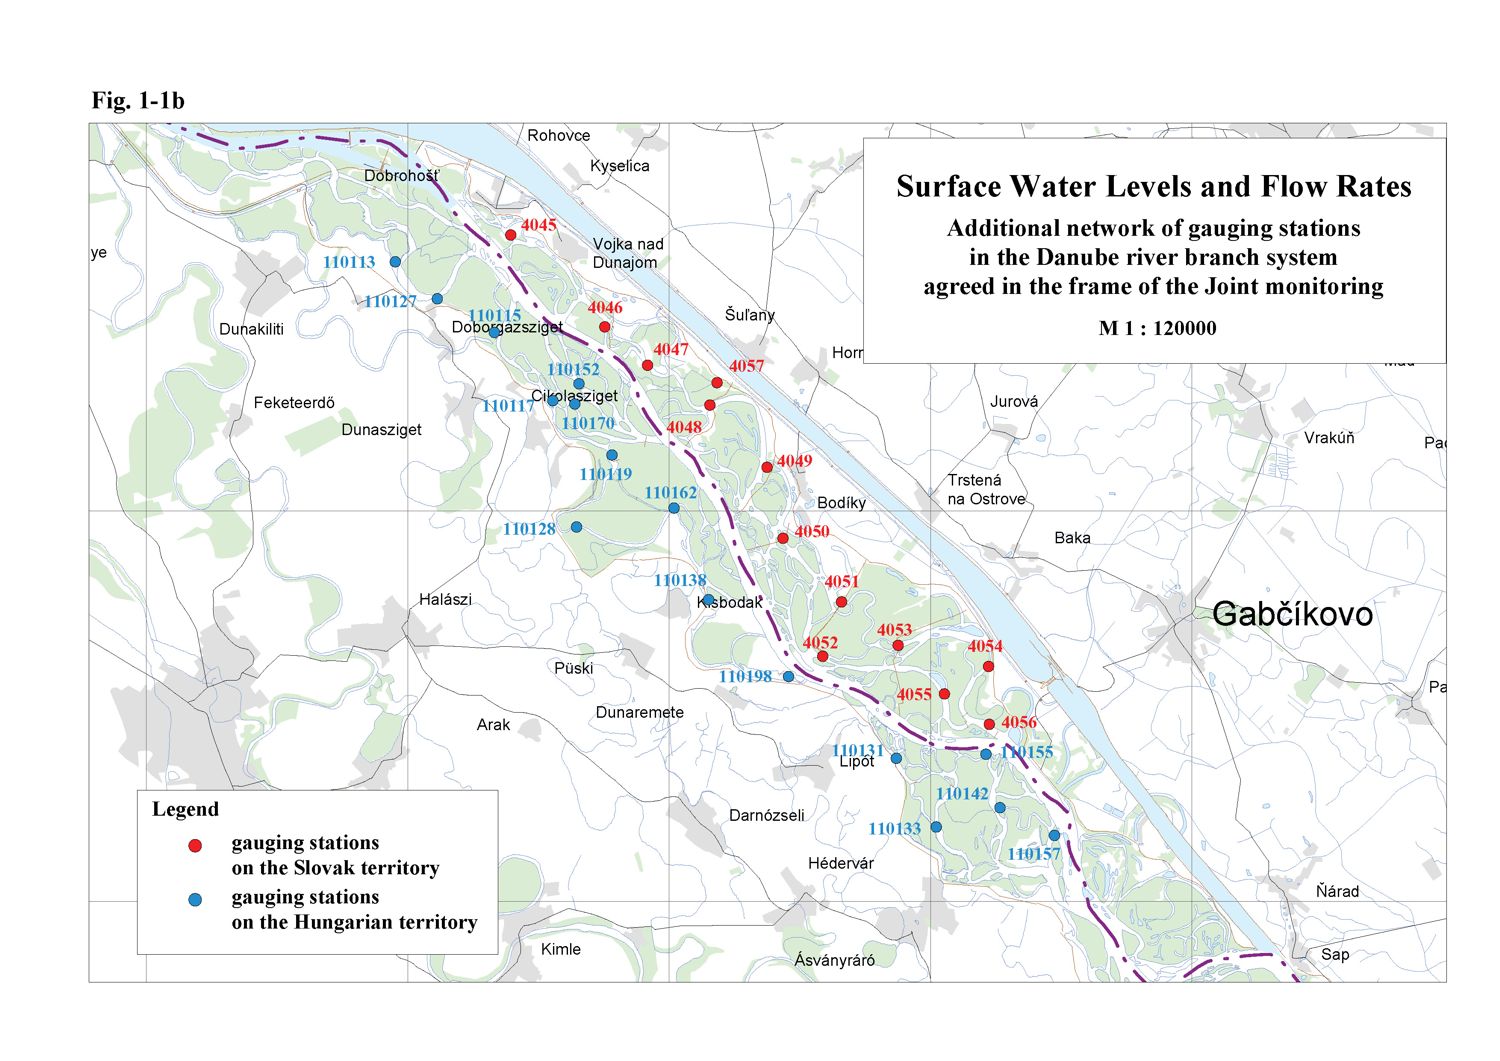
Surface water levels and flow ratesThere were no changes registered in the monitoring of surface water levels and discharges in the previous year. Surface water level recording in the hydrological year 2007 were carried out at 28 gauging stations on the Slovak side and 29 gauging stations on the Hungarian side (Tab. 1-1). On several gauging stations flow rate calculations were performed (10 gauging stations on each side). The observation network is shown in Fig. 1-1a, Fig. 1-1b. The Parties in the intergovernmental Agreement have agreed to mutually exchange data from these gauging stations. Joint flow rate measurements helped the joint evaluation of flow rates discharged into the Danube downstream of the Čunovo dam and into the Mosoni branch of the Danube. Based on a mutual evaluation of joint measurements, time series data were accepted. These data create the basis for joint evaluation of measures and water supply realised according to Articles 1-3 of the Agreement. Table 1-1: List of gauging stations
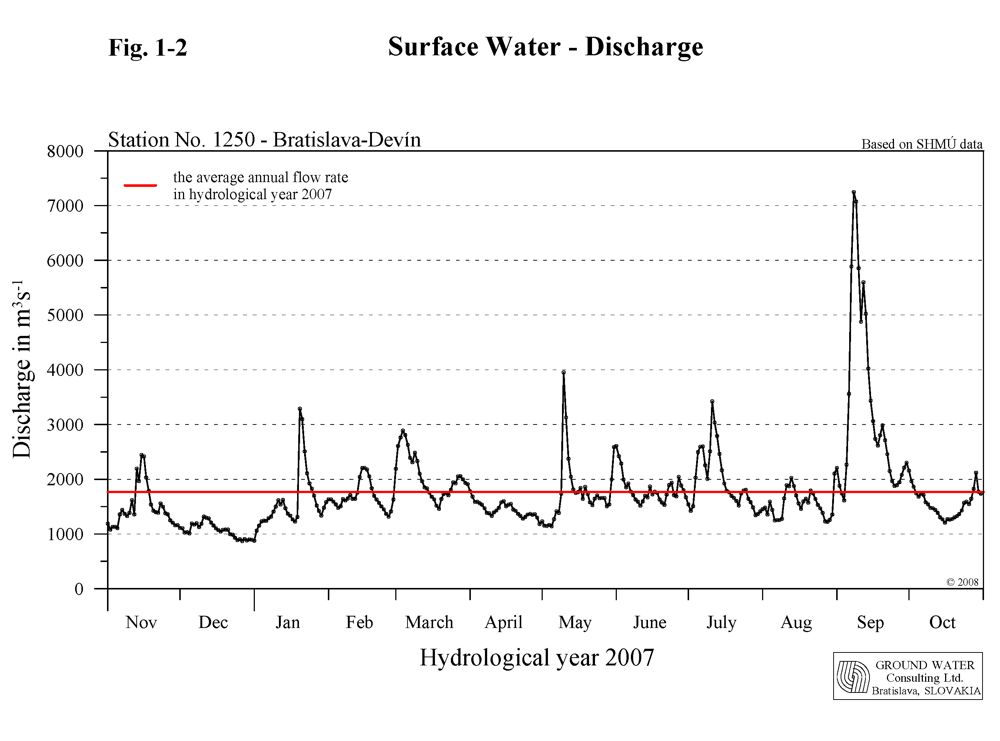
As a part of the intergovernmental Agreement, signed on April 19, 1995 a temporary water management regime was set up. It was agreed that in the case of average annual flow rate of 2025 m3s-1 in the Danube at the Bratislava-Devín gauging station an annual average of 400 m3s-1 should be discharged into the Danube old riverbed downstream of the Čunovo weir. The actual daily amount of water is governed by the flow rate reaching the Bratislava-Devín profile, taking into consideration the rules of operation described in Annex 2 of the Agreement. The flow rate in the vegetation period, depending on hydrological conditions, should fluctuate from 400 to 600 m3s-1; in non-vegetation period the flow rate should not be less than 250 m3s-1. In case of flow rates over 5400 m3s-1 the amount of water above 600 m3s-1 discharged through the Čunovo weir is not taken into consideration when the annual average is calculated. An additional 43 m3s-1 of water was agreed in the Agreement to be discharged into the Mosoni branch of the Danube and the right side seepage canal. The gauging station Bratislava-Devín plays a key role in determining the amount of water to be discharged into the old Danube riverbed downstream of the Čunovo weir. The annual minimum daily flow rate 845 m3s-1 occurred on January 1, 2007, when the average daily flow rate was 875,6 m3s-1. The annual maximum flow rate occurred on September 8, 2007, when it reached 7550 m3s-1, with a maximum average daily flow rate of 7246 m3s-1. The average annual flow rate at this station in the hydrological year 2007 reached 1768 m3s-1, which was the second lowest annual average flow rate observed since 1992 (Tab. 1-2). Considering the course of water levels and flow rates during the hydrological year 2007 it can be stated that no unusual values occurred, however the course was not typical. April, May and June 2007 were extremely dry months. December 2006, July and August 2007 belonged to dry months. March was moderately water rich, while November 2006, January, February and October 2007 belonged to water rich months. Due to the only flood wave in the year 2007 September was extremely water rich month. Table 1-2: Average annual flow rates
Low flow rates in the Danube during the hydrological year 2007 occurred mostly in December 2006; flow rates in the third decade fluctuated below 1000 m3s-1. The annual minimal flow rate of 845 m3s-1 occurred on January 1, 2007 (average daily flow rate corresponded to 875,6 m3s-1), however the minimal average daily flow rate of 872,7 m3s-1 was recorded on December 27, 2006. The first remarkable discharge wave occurred in the third decade of January, culminating at 3942 m3s-1, with an average daily flow rate of 3290 m3s-1. Flow rates after the culmination fluctuated around the long time average values, however at the end of February dropped. Another discharge wave occurred at the beginning of March, when the flow rates reached values around 3000 m3s-1 with a maximum of 3079 m3s-1. Lack of precipitation in March and April was reflected in significant decrease of flow rates. Flow rates fluctuated below the long-term average values and during the first decade of May reached the lowest average daily values observed in this period. Short but rich precipitation in the German and Austrian part of Danube catchment area evoked a sudden steep increase of flow rate, culminating at 4380 m3s-1. The average daily discharge reached 3952 m3s-1. The short discharge wave steeply decreased and flow rates fluctuated closely to the minimal long-term average values. This situation continued till the beginning of July except a slight discharge wave at the end of May. There were another two slight discharge wave registered in the first half of July, as a response to higher precipitation in the Danube catchment area. However, after the second culmination (3529 m3s-1) the flow rates dropped and fluctuated closely to the minimal long-term average values again. At the end of August significant temperature drop was recorded and in the first decade of September exceptionally rich precipitations occurred which evoked a significant flood wave at the end of the first decade. The maximal average daily flow rate reached 7246 m3s-1, with culmination at 7550 m3s-1. Flow rates after the culmination decreased gradually. The decrease was interrupted by a slight discharge wave at the end of September, however the decreased continued till the middle of October, when the flow rates fluctuated significantly below the long-term average values. Due to precipitation amount above average in the second half of the month the flow rate increased up to 2120 m3s-1 at the end of the hydrological year. The course of flow rates during the hydrological year 2007 at gauging station No. 1250 - Bratislava-Devín is shown in Fig. 1-2. 1.1. Discharge into Danube downstream of Čunovo weirThe determination of the average daily amount of water discharged into the Danube downstream of the Čunovo weir was based on average daily flow rates determined at stations Doborgaz and Helena (Fig. 1-3). At these stations joint flow rate measurements were performed to determine the flow rate supplied into the Danube old riverbed. The monthly characteristics of the daily average flow rates into the Danube in the hydrological year 2007 were as follows:
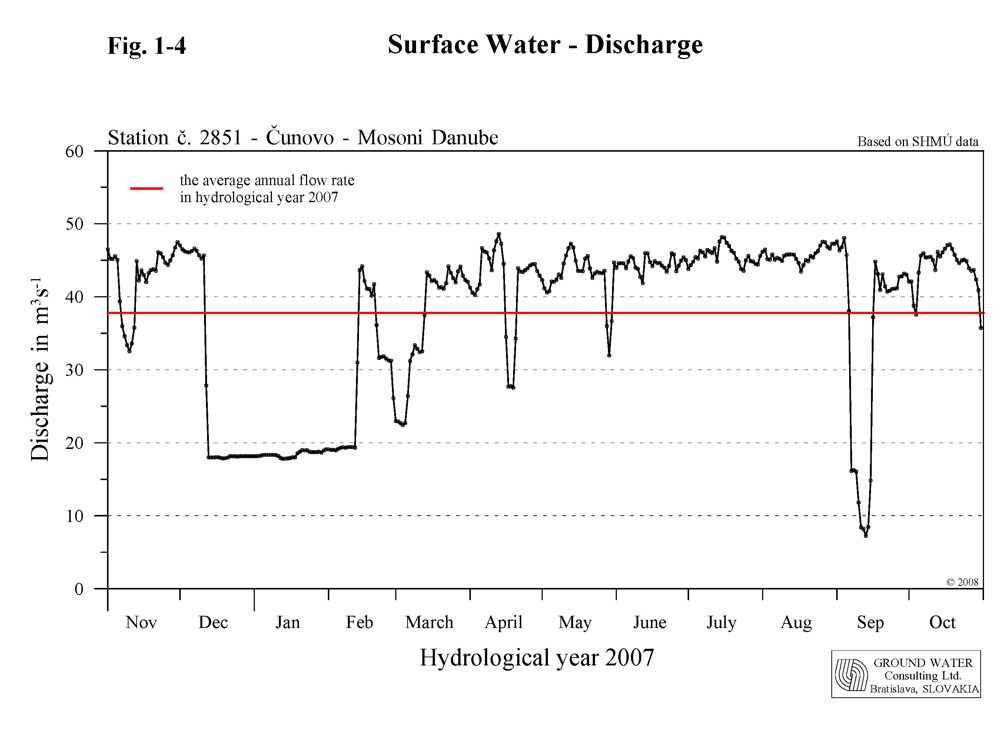
The average annual flow rate in the Danube at the Bratislava-Devín profile in hydrological year 2007 was 1768 m3s-1. Taking into consideration obligations envisaged in the intergovernmental Agreement, the Slovak Party was obliged to release an average annual discharge of 349.2 m3.s-1 into the Danube riverbed downstream of the Čunovo weir. The total average annual discharge released to the Danube downstream of Čunovo was 422.9 m3s-1. During hydrological year 2007 it was necessary to release an amount of water into the riverbed downstream of Čunovo exceeding 600 m3s-1 on one occasion, due to the flood wave on the Danube (September 2007). According to the modified method of average discharge calculation, accepted in the Joint Annual Report on the environment monitoring in 2004, discharges exceeding 600 m3s-1, while the flow rate in the Danube was higher than 5400 m3s-1, were reduced to 600 m3s-1. When subtracting the amount of water over 600 m3s-1 released during the flood events (5 values), the average annual flow rate of 393.7 m3s-1 is obtained, which represents 112.7 % of the amount requested by the Agreement. The yearly average minimum of 214.0 m3s-1 in the Danube old riverbed was measured on November 6, 2006; the yearly average maximum of 3665 m3s-1 was recorded on September 7, 2007. When evaluating the amount of water discharged to the Danube old riverbed, it can be stated that Slovak Party fulfilled the average annual discharge jointly agreed in the intergovernmental Agreement. Taking into consideration the minimal values prescribed in the Agreement (in the winter period not less than 250 m3s-1, in the vegetation period at least 400 m3s-1) it can be stated that considering the accuracy of the measurements (10 %) discharges below 250 m3s-1 in the winter period occurred several times (11 days in November 2006 and 2 days in December 2006), in the vegetation period the minimal discharges of 400 m3s-1 were fulfilled. 1.2. Discharge into Mosoni branch of the DanubeAccording to the intergovernmental Agreement, the discharge into the Mosoni branch of the Danube should be 43 m3s-1, which is composed of both the discharge released to the Mosoni branch of the Danube through the intake structure at Čunovo, and the discharge through the seepage canal. Discharge measurements are carried out downstream of the intake structure on the Slovak territory at 0.160 rkm and also upstream of lock No. I on the Hungarian territory. The average daily discharges were agreed after the joint evaluation of joint discharge measurements performed at both profiles. In this evaluation, data measured just downstream of the intake structure was considered (Fig. 1-4). The monthly characteristics of the amount of water released into the Mosoni Danube through intake at Čunovo in the hydrological year 2007 were as follows:
The average annual discharge was 37.79 m3s-1. The minimal daily average discharge was 7.232 m3s-1; the maximal daily average discharge was 48.62 m3s-1. The flow rate in the right side seepage canal was measured at two sites as well. The first is on Slovak territory at Čunovo; the second is on Hungarian territory at lock No. II. In the evaluation the data observed at lock No. II was considered. The monthly characteristics of the flow rates recorded at lock No. II in the hydrological year 2007 were as follows:
The average annual flow rate was 2.24 m3s-1. The minimal daily average discharge was 1.29 m3s-1; the maximal daily average discharge was 4.82 m3s-1. The monthly characteristics of the total flow rate released into the Mosoni Danube in the hydrological year 2007, consisting of the water amount discharged through the intake structure at Čunovo and water amount flowing in the right side seepage canal, were as follows:
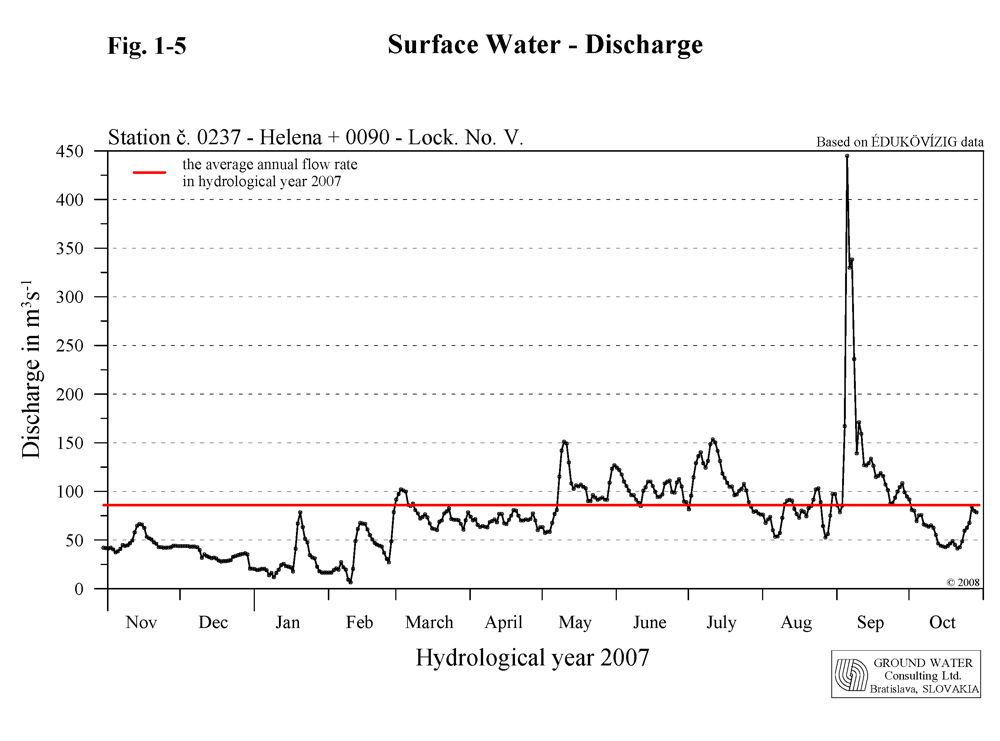
The total average annual flow rate was 40.03 m3s-1, which represents 93.1 % of the agreed amount. The minimal daily average discharge was 10.87 m3s-1; the maximal daily average discharge was 50.87 m3s-1. According to the request of the Hungarian Party the flow rate in hydrological year 2007 was significantly decreased in two occasions. From mid of December 2006 to mid of February 2007 (64 days) due to reconstruction works in the right-side river branch system, and in September 2007 (9 days) due to high inland water levels during the flood wave on the Danube (Fig. 1-4). The flow rate was decreased also for technical maintenance of turbines at the end of February and first half of March 2007 (20 days). If the periods with decreased flow rate according to the requests of the Hungarian Party are not taken into the evaluation we get an annual average flow rate of 44,98 m3s-1. Considering the technical and hydrological conditions it can be stated that the total water amount of 43 m3s-1 envisaged in the Agreement discharged through the Mosoni Danube and through the seepage canal, was fulfilled. 1.3. Water distribution on Hungarian territoryThe goal of distributing water on the Hungarian side is to provide a continuous water supply into the inundation area, into the river branches on the flood-protected area and into the Mosoni Danube. 1.3.1. Water supply into the inundation areaRiver branches in the inundation area on Hungarian side can be supplied by water from two sources. These two flows are summed to get the total amount. a) Through three openings in the Danube riverbank, by manipulating the water level increased by the submerged weir and the Dunakiliti dam. The total inflowing discharge is measured at Helena. b) From the seepage canal through lock No. V. The criteria for regulation of water distribution were set up to satisfy the needs determined at right-side river branch system revitalization planning. The reference status was determined at the end of nineties with the involvement of the stakeholders. Taking various needs into consideration it reflect the hydrological regime of fifties. Creation of water levels characteristic for this period was targeted in the arms of inundation area. The flow rate was determined as a function of the flow rate entering the Bratislava - Devín profile. The environmental status of the Szigetköz in the reference period was determined as the most similar to a state, which can be sustained on a long run, and serves adequate riverbed morphology and hydro-geological information for determining the reference status. This is in full harmony with the recommendations of the Water Framework Directive and the goals of the River Basin Management. Joint discharge measurements by both Parties were performed at the Helena profile. The measurements were jointly evaluated and the average daily flow rate data were accepted. The monthly flow rates characteristics at Helena profile in the hydrological year 2007 were as follows:
The average annual flow rate was 61.95 m3s-1. The minimal daily average discharge was 0.00 m3s-1; the maximal daily average discharge was 445.0 m3s-1. The monthly flow rates characteristics at lock No. V in the hydrological year 2007 were as follows:
The average annual flow rate was 12.42 m3s-1. The minimal daily average discharge was 0.00 m3s-1; the maximal daily average discharge was 36.70 m3s-1. The monthly flow rates characteristics of the total amount of water released into inundation area in the hydrological year 2007 (Fig. 1-5), consisting of the water amount flowing through the Helena profile and water amount flowing through the Lock. No. V in the right side seepage canal, were as follows:
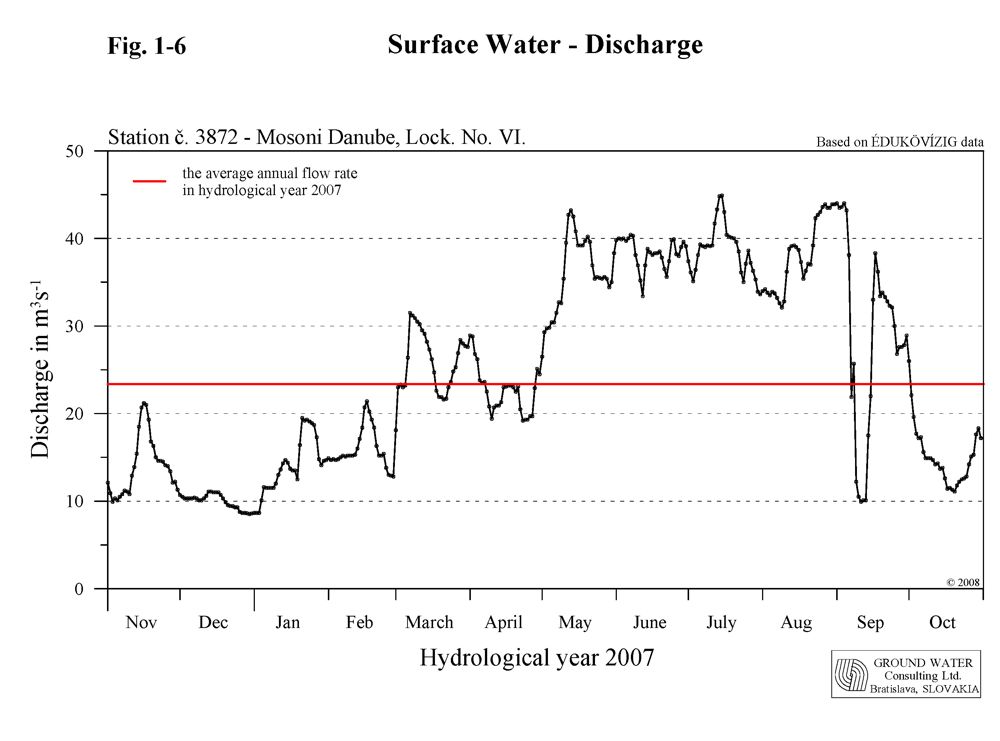
The total average annual flow rate supplied into river branches in the inundation area was 74.37 m3s-1. The minimal daily average discharge was 6.35 m3s-1; the maximal daily average discharge was 445.0 m3s-1. Taking into account the unfavourable meteorological and hydrological conditions (low discharges in the Danube) no artificial flooding of the inundation area was realized in 2007. The water amount discharged and distributed in the Hungarian river branch system created water levels characteristics for the reference status in the upper part of the inundation area – in the Tejfaluszigeti and Cikolai river branch systems, and along the canal near Lipót. Water levels monitored in the Bodaki and Ásványi river branch systems were slightly higher then the values belonging to the reference status. The lack of revitalization works in the downstream areas plays a role at not achieving the desired status. Based on the above mentioned it can be stated that for the low and medium flow rate periods the target values of the reference status were fairly achieved. However, regarding the every concerned water body, the hydro-morphological risk continues to exist. 1.3.2. Water supply into the Mosoni DanubeThe water supply into the Mosoni Danube is secured from the seepage canal through the lock No. VI (Fig. 1-6). The flow rate is measured at the profile downstream of the lock. The monthly characteristics of flow rates through the lock No. VI in the hydrological year 2007 were as follows:
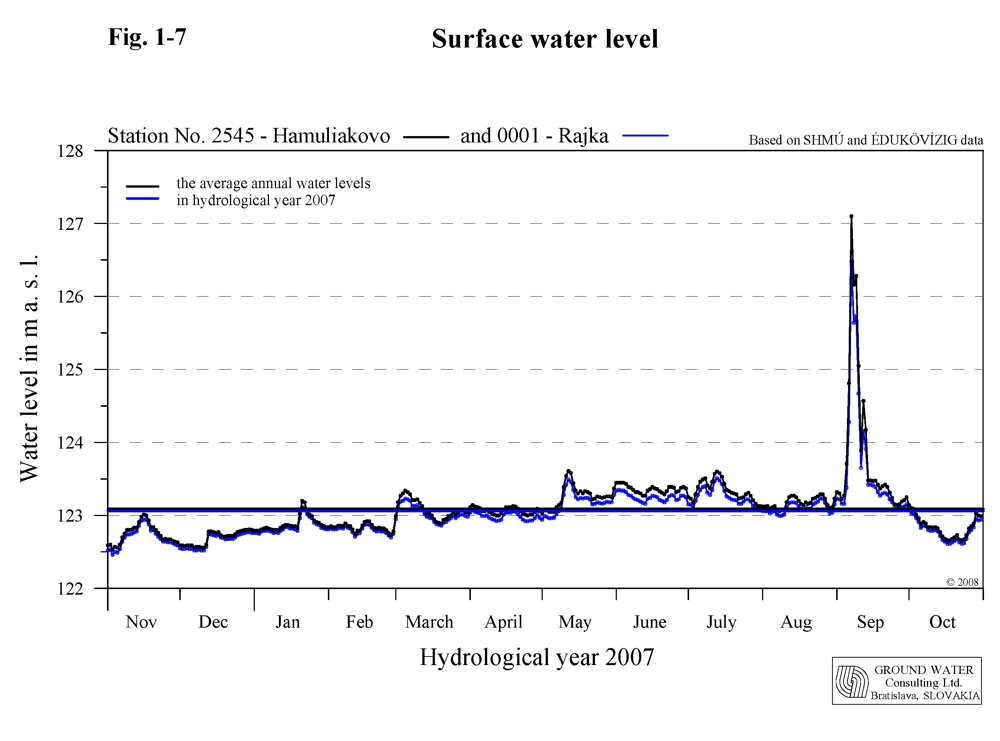
The average annual flow rate in the Mosoni Danube at lock No. VI. was 24.84 m3s-1. The minimal daily average discharge was 8.53 m3s-1; the maximal daily average discharge was 44.90 m3s-1. The water supply regime is regulated by rules of operation and follows the Danube’s water regime. During the reconstruction works in the inundation area in non-vegetation period (December 2006 – February 2007) a low water period was simulated in the Mosoni Danube. This was done by reducing the water amount discharged through the intake structure at Čunovo. Besides its water supply function lock No. I also has a flood protection function. It prevents floods entering the flood-protected area. 1.4. The Danube water level characteristics on Čunovo-Vámosszabadi stretchThe Danube stretch between Čunovo and Vámosszabadi can be divided into four different sections according to the prevailing influence. These sections can be characterised by data obtained from the following gauging stations: Rajka and Hamuliakovo, Dunakiliti, Doborgaz and Dobrohošť, Dunaremete and Gabčíkovo. Vámosszabadi and Medveďov. The characteristics of four sections on the Čunovo-Vámosszabadi stretch in hydrological year 2007 are the following: a) Čunovo - Dunakiliti section. The water
level in this section has been impounded since construction of the submerged
weir. This impounded section supplies water into the right side river branch
system. The amount of water released to the river branch system is determined
by water level regulation at the Dunakiliti dam. The water level is kept in the
mid-water riverbed. Average flow velocities fluctuated in the range between
0.39 - 0.75 m.s-1. In hydrological year 2007 discharges
exceeding 600 m3s-1 were released into the Danube old
riverbed on one occasion (September 2007), the maximal average daily flow rate
3665 m3s-1. Flow velocity of 2.53 m.s-1 was
recorded during the flood wave. In the hydrological year 2007 increased amount
of water (above the agreed maximum of 600 m3s-1) for
artificial flooding of the right side inundation area was not requested by the
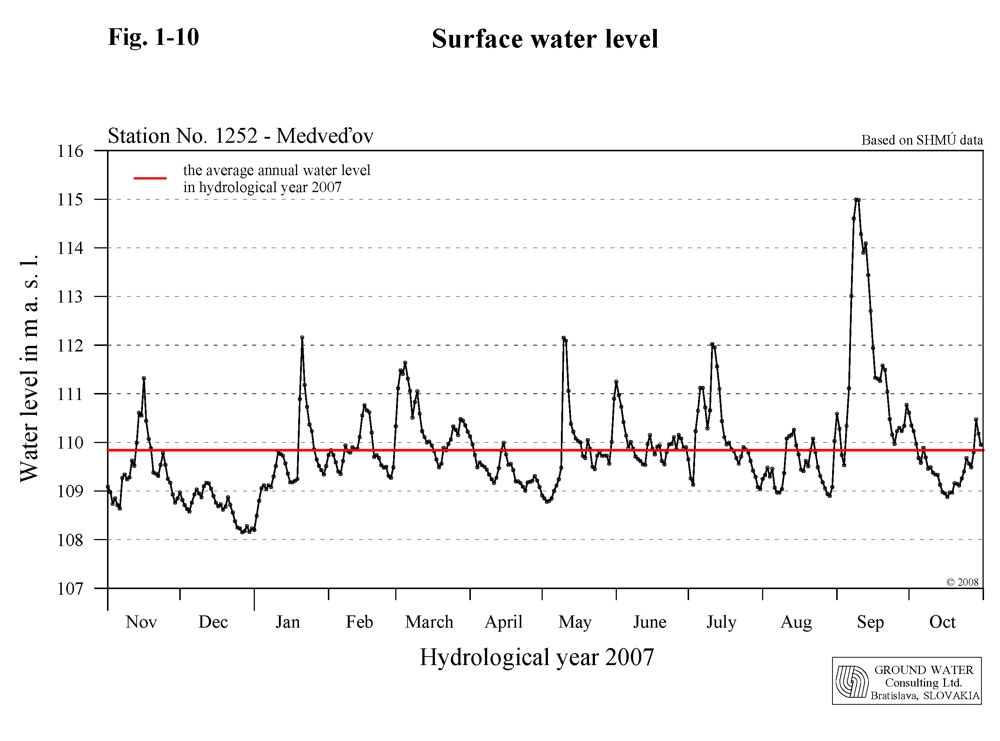
Hungarian side. b) Section between Dunakiliti and Dunaremete. This section of Danube is not influenced by any measures and the water level is determined only by the flow rate in this riverbed section. In the upper part of this section the water level in river branches is about 3 m higher than the water level in main riverbed. The average daily water level at the Dobrohošť gauging station (rkm 1838.6) fluctuated in the range from 117.20 to 123.42 m a. s. l. and the average annual water level was 117.78 m a. s. l. The average daily water level at the Dunaremete profile (1825.5) fluctuated from 113.43 to 118.88 m a. s. l. and the average annual water level was 113.96 m a. s. l (Fig. 1-8). Average flow velocities fluctuated in the range between 0.91 - 1.47 m.s-1. Flow velocity of 2.16 m.s-1 was recorded during the flood wave. c) Section between Dunaremete and Sap. The water level in this section is influenced by the backwater effect from the confluence of the tailrace canal and the Danube old riverbed (rkm 1811). The water level changes, especially in the lower part of this section, are influenced by the flow rates in the tailrace canal. The length of the upstream section influenced by the backwater effect depends on the actual flow rate distribution between the hydropower station and the Danube old riverbed. At regular operation it can be stated that the backwater effect reaches the Dunaremete profile (rkm1825.5) at flow rates over 2500 m3s-1 at Medveďov. The average daily water level at the Gabčíkovo gauging station (rkm 1819) fluctuated in the range from 111.66 to 116.91 m a. s. l. and the average annual water level was 112.24 m a. s. l (Fig. 1-9). The daily water level fluctuation at the Gabčíkovo gauging station in the Danube old riverbed can reach app. 0.20 m as a consequence of hydropower station operation. d) Sap – Vámosszabadi section. The flow rate in this section approximately equals to the flow rate at Bratislava and is additionally influenced by the Gabčíkovo hydropower station operation. The daily water level fluctuation at this stretch (up to 0.30 m) depends on the hydropower station operation. Higher changes occur at low flow rates in the Danube due to the ratio of the total flow rate and the capacity of one turbine, which may be put into operation or stopped. The average annual flow rate at the Vámosszabadi-Medveďov profile in 2007 was 1713 m3s-1. The average daily water level at Medveďov profile (rkm 1806.3) fluctuated in the range from 108.15 to 114.99 m a. s. l. and the average annual water level was 109.83 m a. s. l (Fig. 1-10). Average flow velocities fluctuated in the range between 1.16 - 1.69 m.s-1. Flow velocity of 1.89 m.s-1 was recorded during the flood wave.
|
|||||||||||||||||||||||||||||||||||||||||||||||||||||||||||||||||||||||||||||||||||||||||||||||||||||||||||||||||||||||||||||||||||||||||||||||||||||||||||||||||||||||||||||||||||||||||||||||||||||||||||||||||||||||||||||||||||||||||||||||||||||||||||||||||||||||||||||||||||||||||||||||||||||||||||||||||||||||||||||||||||||||||||||||||||||||||||||||||||||||||||||||||||||||||||||||||||||||||||||||||||||||||||||||||||||||||||||||||||||||||||||||||||||||||||||||||||||||||||||||||||||||||||||||||||||||||||||||||||||||||||||||||||||||||||||||||||||||||||||||||||||||||||||||||||||||||||||||||||||||||||||||||||||||||||||||||||||||||||||||||||||||||||||||||||||||||||||||||||||||||||||||||||||||||||||||||||||||||||||||||||||||||||||||||||||||||||||||||||||||||||||||||||||||||||||||||||||||||||||||||||||||||||||||||||||||||||||||||||||||||||||||||||||||||||||||||||||||||||||||||||||||||||||||||||||||||||||||||||||||||||||||||||||||||||||||