PART 5
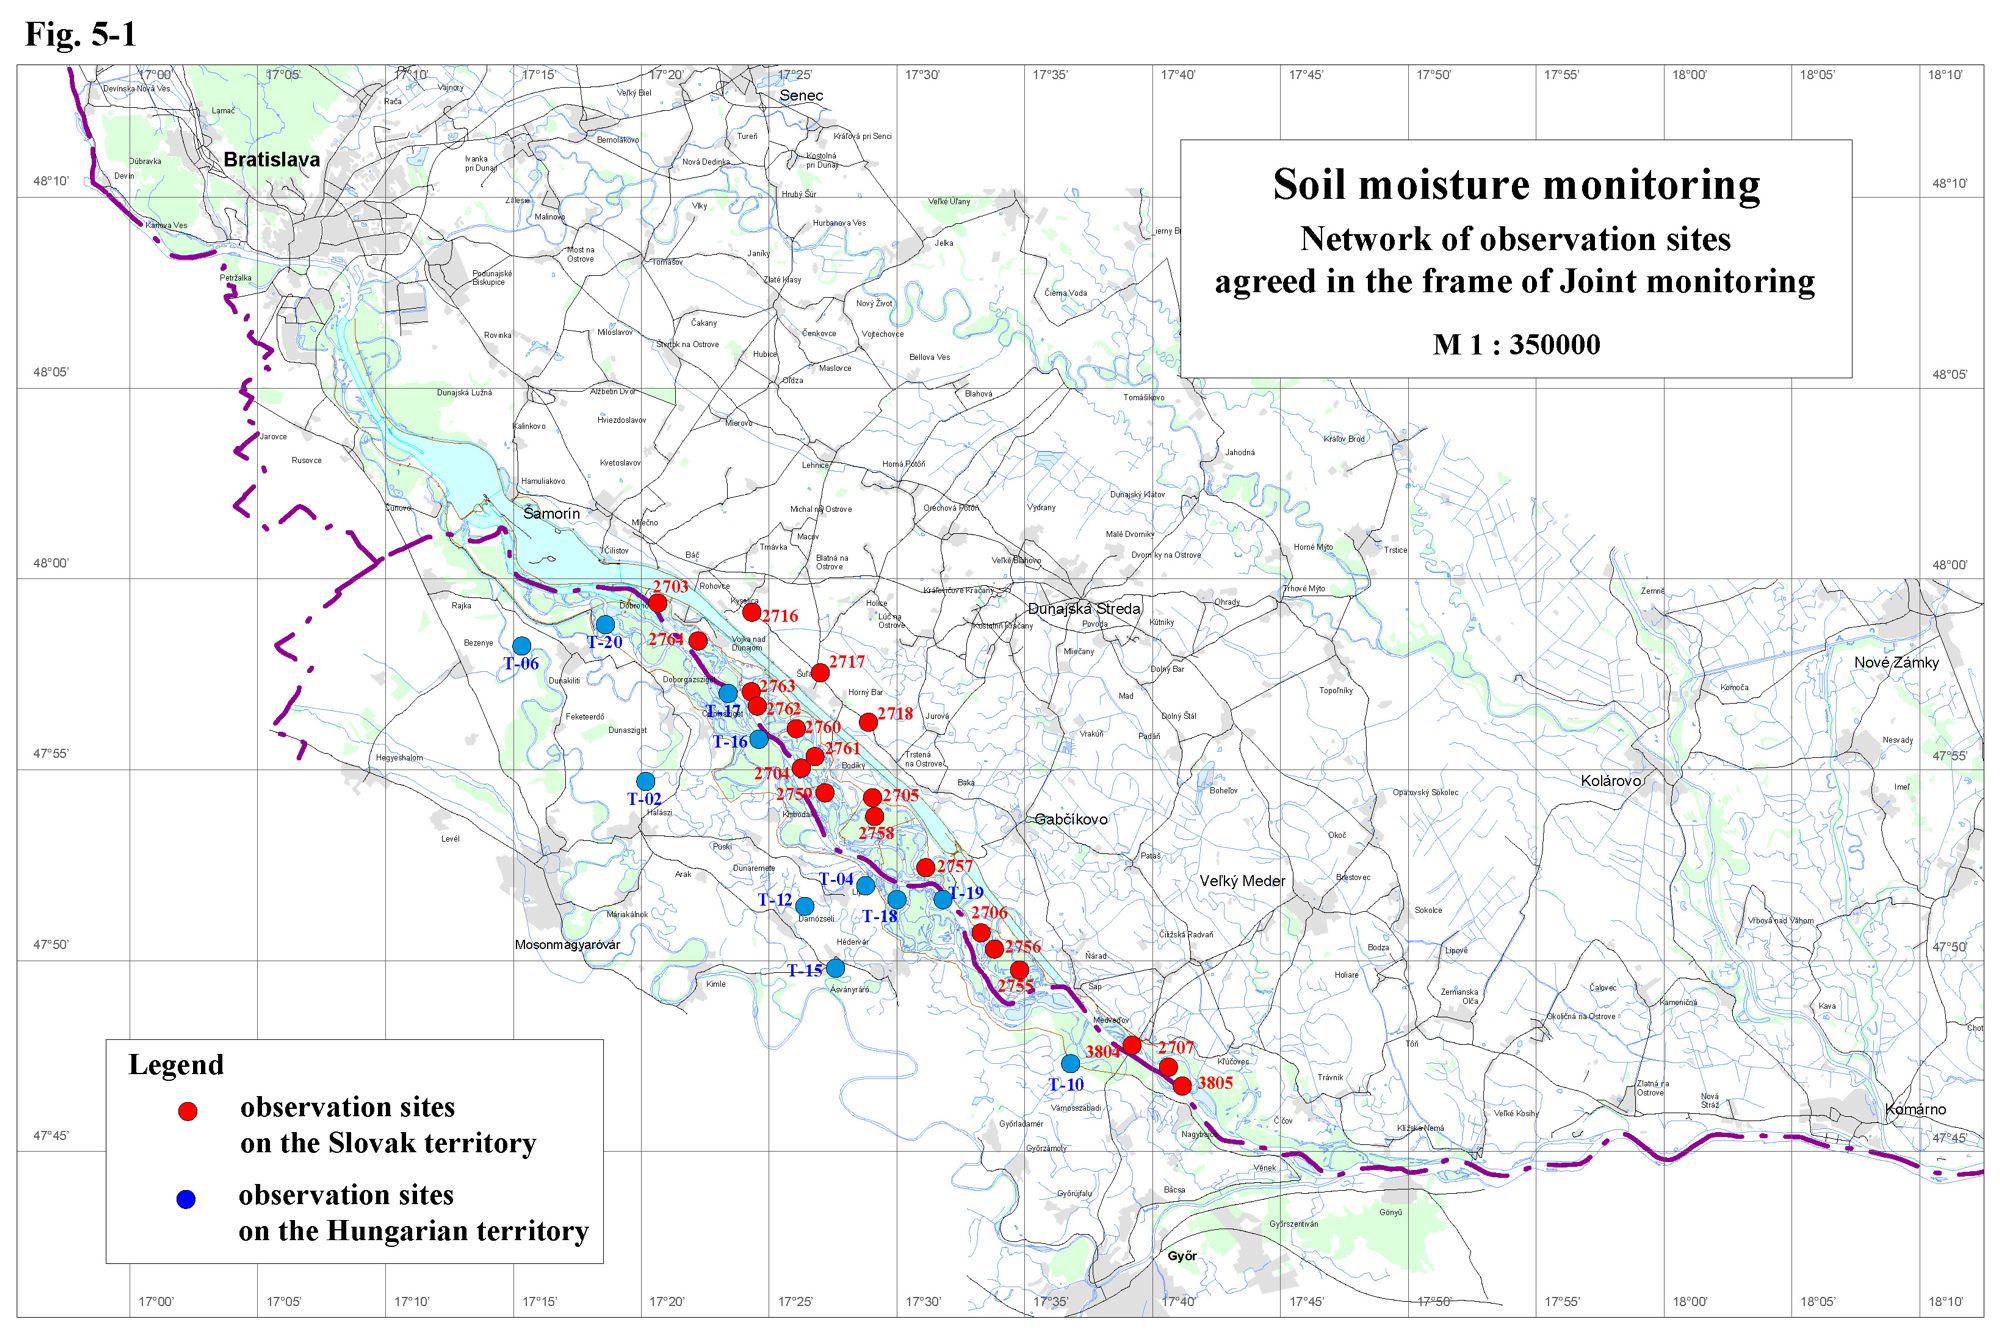
Soil Moisture Monitoring5.1. Data collection methodsThe soil moisture monitoring continued in the year 2006 according to the intergovernmental Agreement. Measurements on both sides were carried out without changes. The Slovak side measured the soil moisture by a neutron probe down to a prescribed depth or to the depth of the ground water level. The Hungarian side measured the soil moisture with a capacity probe to the depth of 2 m. The soil moisture on both sides is expressed by the total soil moisture content in volume percentage recorded in 10 cm depth intervals for each measurement during the year. Measurements on the Slovak side were performed on 12 forest monitoring areas, on 5 biological monitoring areas and on 3 agricultural areas – Tab. 5-1. Measurements on the Hungarian side were performed on 6 forest monitoring areas and 5 agricultural areas - Tab. 5-2. Monitoring on three areas were abandoned. The situation of observation objects is shown on Fig. 5-1. Table 5-1: List of monitoring stations on the Slovak side
Table 5-2: List of monitoring stations on the Hungarian side
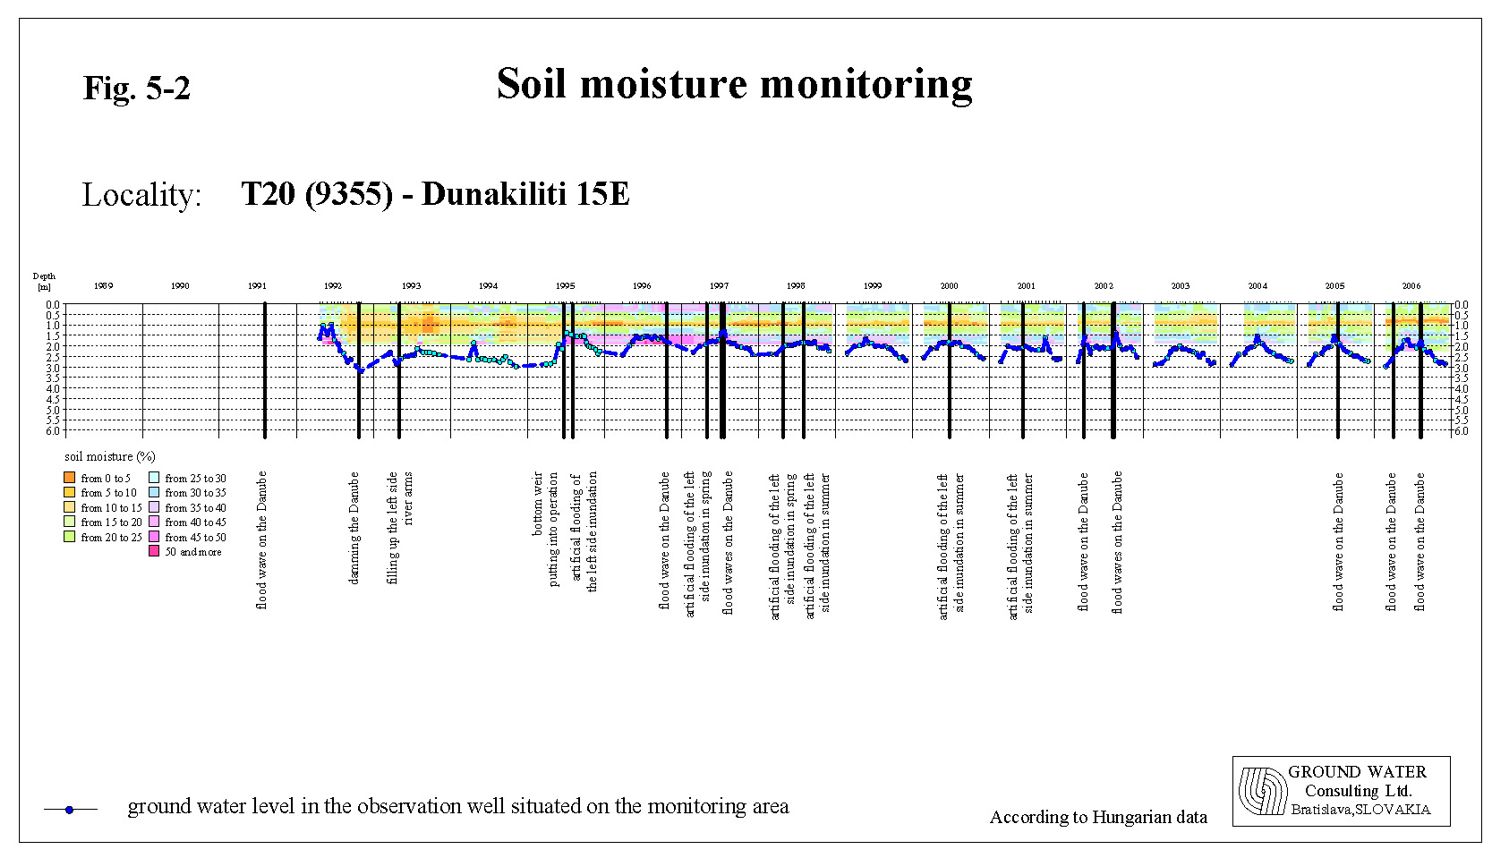
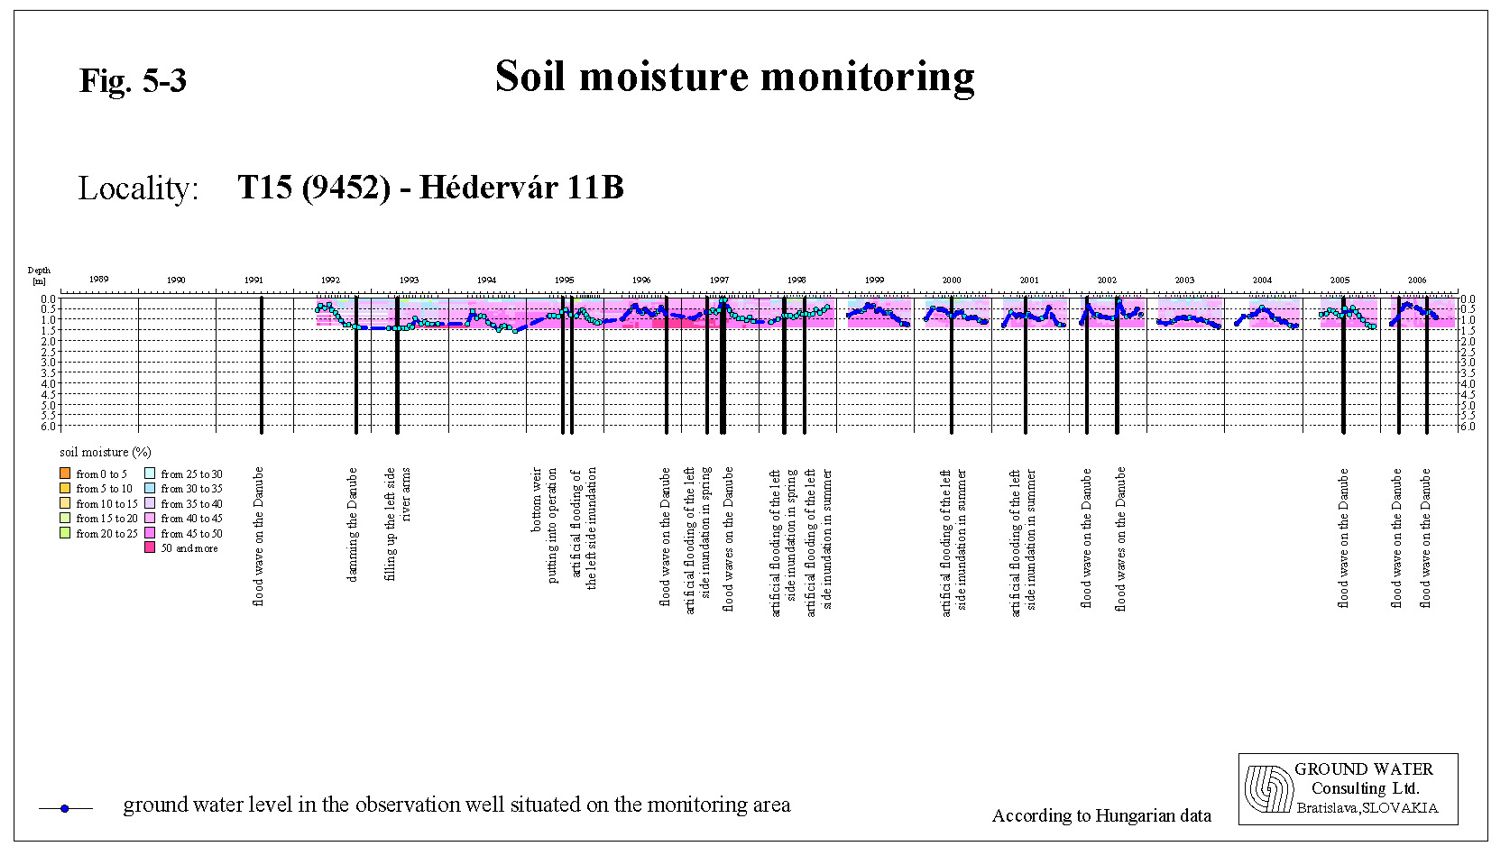
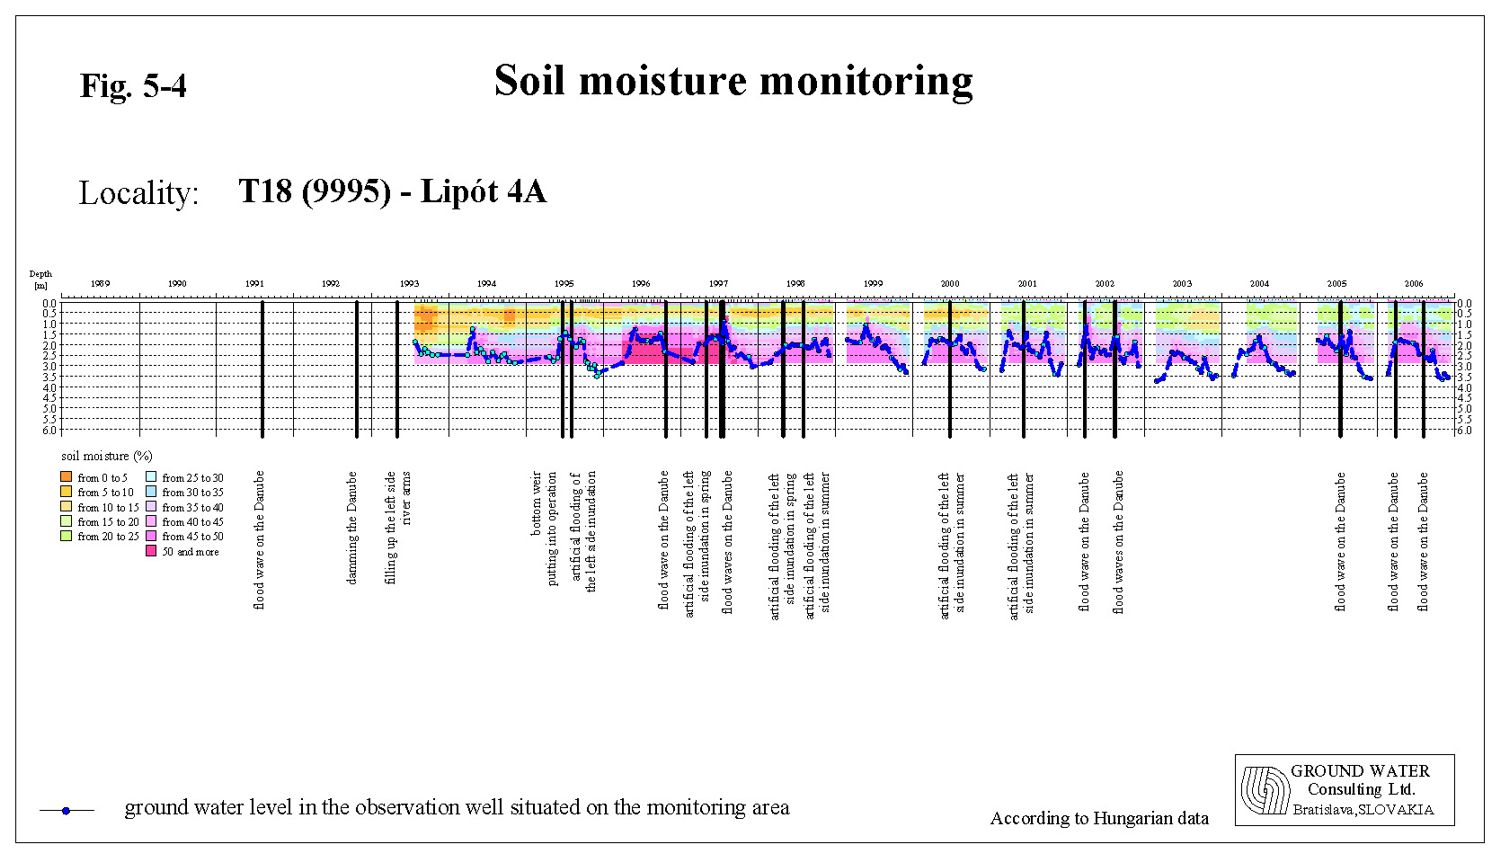
5.2. Data presentation methodsBoth Parties present soil moisture in figures showing the average soil moisture content in volume percentage for the depth interval from 0 to 100 cm and from 110 to 200 cm. A small difference can occur in the Hungarian data, where the value for a depth interval under 110 cm can represent the average value from less than 10 measured values. On colour figures the soil moisture time distribution for the whole measured depth is presented at selected sampling sites. The graphical presentation of the whole set of measured data is given in the Slovak and Hungarian National Annual Reports. 5.3. Evaluation of results on the Hungarian sideThe soil moisture measurements on the Hungarian side in 2006 continued at forestry monitoring sites in the floodplain area as well as at agricultural monitoring sites in the flood-protected area (Fig. 5-1). The moisture conditions of soils are essentially influenced by the rainfall conditions, by the soil layer thickness and its composition, as well as by the ground water level position. The volume of rainfall in the first three months of the year was slightly over the average, but the amount of precipitation in April significantly exceeded the long term average values (at Mosonmagyaróvár 219 %, at Győr 174 %). The temperature at the beginning of the vegetation period was slightly cooler than usually. In June and July the precipitation amount did not reached the average values, even in July it was by 50 % lower. Together with high air temperatures it unfavourable influenced the soil moisture content. August was slightly cooler than the average and the rainfall reached 163 % of the long-term average at Mosonmagyaróvár and 146 % at Győr. The end of the vegetation period was characterised by precipitation amount below the long term average and by temperatures exceeding the average values. The soil moisture in the Szigetköz region was positively influenced by the flood at the end of March and beginning of April and by long-lasting higher discharges during the whole April. No artificial flooding was necessary, because another natural flood occurred at the end of May and beginning of June. High air temperatures and extremely low discharges in the Danube in July negatively influenced the soil moisture content. This negative tendency was partially reduced by a flood at the first half of August. The ground water level raised after floods in the first half of the year and reached higher levels by 20-30 cm in comparison with the previous year. Since July it started to decrease and slowly decreased till end of the hydrological year. The average ground water level during the vegetation period 2006 was higher compared to the average ground water level in last two years. The soil moisture on forestry monitoring sites In general, the soil moisture content at all forestry monitoring areas was higher in comparison with the previous year. At the beginning of the vegetation period the soil moisture content reached 90-95 % of the saturation level. It was characteristic that in the soil layers up to 1 m depth the minimum, average and maximum values of the soil moisture content were higher at all monitoring sites. In the depth between 1 and 2 m the maximum and average values were higher at all measuring sites except the measuring sites T18 and T19. The minimum values were slightly lower. The ground water level in various depths moisturised the soil on monitoring sites T15, T16, T18 and T20 (Fig. 5-2, Fig. 5-4). Slight or no impact of ground water was detected at monitoring site T17. Drainage effect of the Danube old riverbed prevails at monitoring site T19. Monitoring site T15 is situated near a water supply rive branch in the middle part of Szigetköz. Soil layers are continuously recharged from the ground water level (Fig. 5-3). Table 5-3: The minimal and maximal average soil moisture contents at forestry monitoring sites
The soil moisture on agricultural monitoring sites on the flood protected side The soil moisture contents at monitoring sites T02, T04 and T06 were mostly dependent on precipitation and weather condition. However, the ground water level influenced deeper parts of the soil profile as well, particularly during floods and higher flow rates in the Danube. The ground water in the hydrological year 2006 reached lower parts of the soil profiles from end of March to end of June and in August. Maximum soil moisture values in the layer down to 1 m depth were recorded during March, May and June, when higher amount of precipitation occurred. The soil moisture values below 1 m depth reached the maximum values in June and August, when flood waves on the Danube occurred. Minimal soil moisture values in the depth down to 1 m were registered at the end of the vegetation period. In the soil layers below 1 m depth they occurred at the beginning and the end of the year. The minimal, average and maximal values were in mostly higher in comparison with the previous year. Monitoring sites T10 and T12 represent agricultural areas in the Middle and Lower Szigetköz. Both monitoring sites have a thick covering layer and throughout the vegetation period the ground water level moisturised the bottom part of soil layers. At monitoring site T10 the ground water reached upper layers as well. Maximum soil moisture values in both layers, down to 1 m depth and below it, were recorded in June. Minimal soil moisture values in the depth down to 1 m were registered in July at T10 and at the end of vegetation period. In the soil layers below 1 m depth they occurred at the beginning and end of the year. The minimal, average and maximal values were similar as in the previous year. Table 5-4: The minimal and maximal average soil moisture contents at agricultural monitoring sites
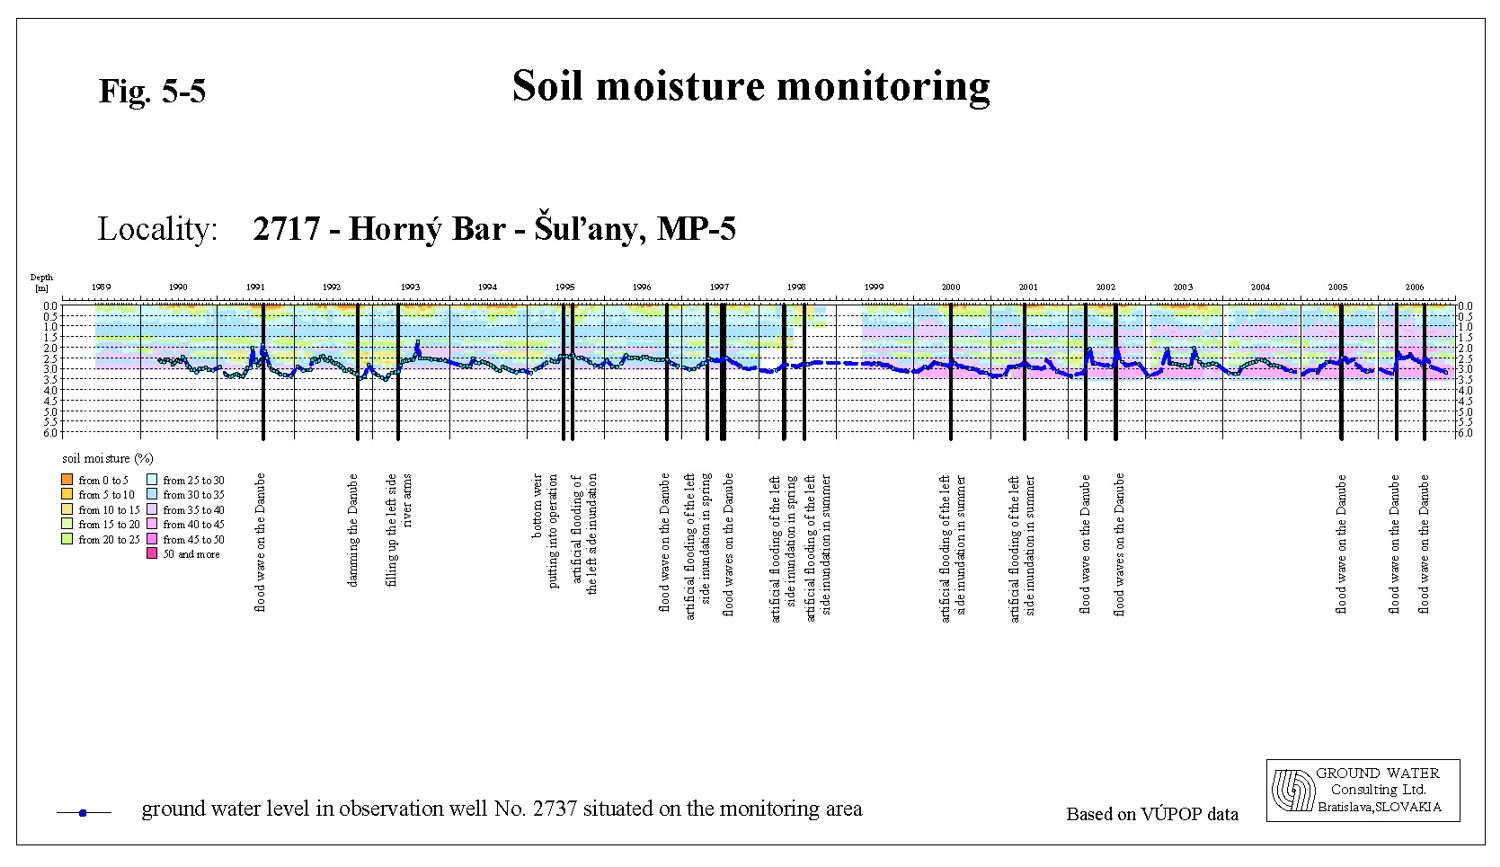
5.4. Evaluation of results on the Slovak sideMonitoring sites on the Slovak side are situated in the inundation area and flood-protected agricultural area (Fig. 5-1). According to the soil moisture observations at monitoring sites situated in the agricultural area (sites No. 2716, 2717, 2718), the soil moisture content and the position and fluctuation of ground water levels during the whole observed period remained unchanged (Fig. 5-5). In the year 2006 the ground water level at monitoring site No. 2716 fluctuated in depths of 2.5-4 m, at site No. 2717 in depths of 2.3-3.3 m and at site No. 2718 in depths of 1.8-2.8 m. The fluctuation of soil moisture content in the depth interval from 0 to 1 m entirely depends on climatic conditions and irrigation. In the depth from 1 to 2 m, the soil moisture fluctuation is partly influenced by the ground water level, at monitoring area No. 2716 rarely. The average soil moisture content in the depth down to 1 m in the year 2006 mostly fluctuated in the range from 9 to 26 % at monitoring site No. 2716, in the range from 25 to 35 % at monitoring site No. 2717 and in the range from 28 to 38 % at monitoring site No. 2718. Thanks to rich precipitation in March the highest average soil moisture contents in the whole observation period were measured at every monitoring site. In the depth between 1 and 2 m, the soil moisture content mainly varied from 16 to 21 % at monitoring site No. 2716, in the range from 32 to 38 % at monitoring site No. 2717 and in the range from 19 to 31 % at monitoring site No. 2718. In this case the highest average soil moisture contents were measured as well. Table 5-5: The minimal and maximal average soil moisture contents at agricultural monitoring sites
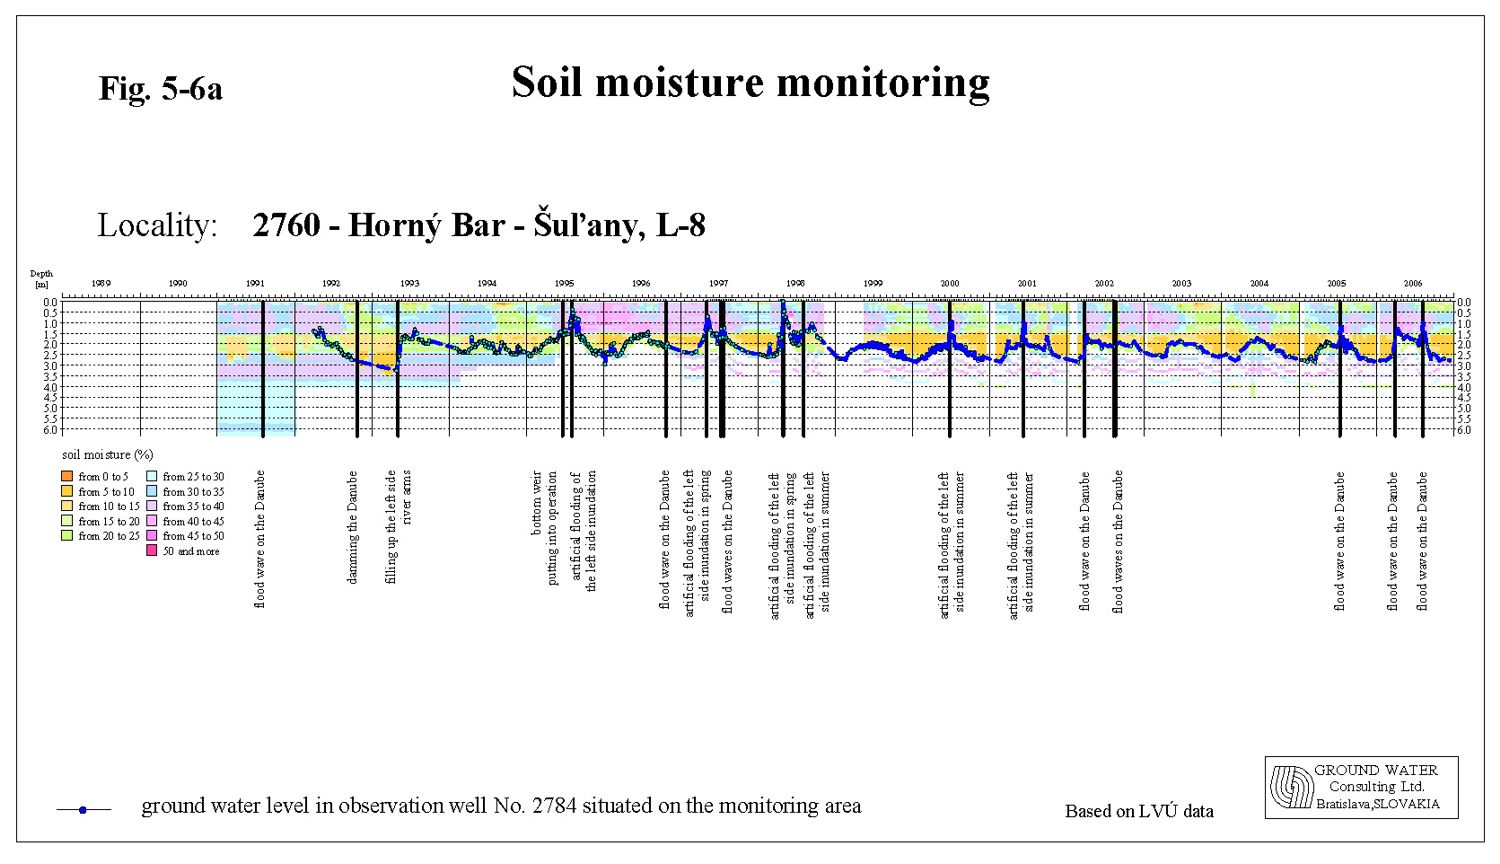
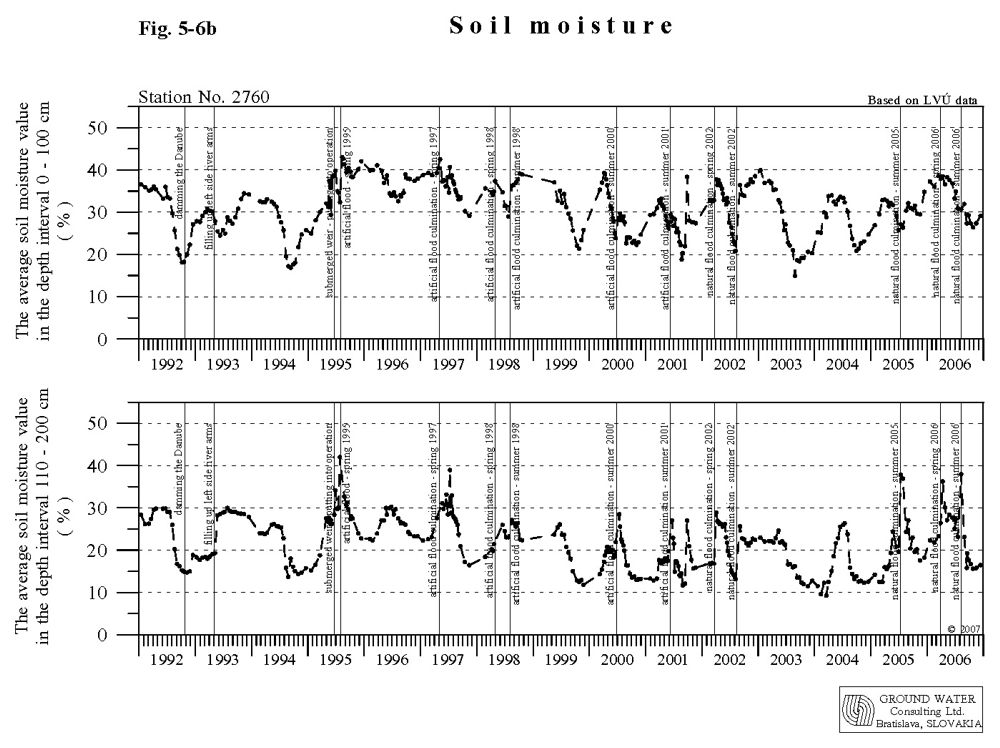
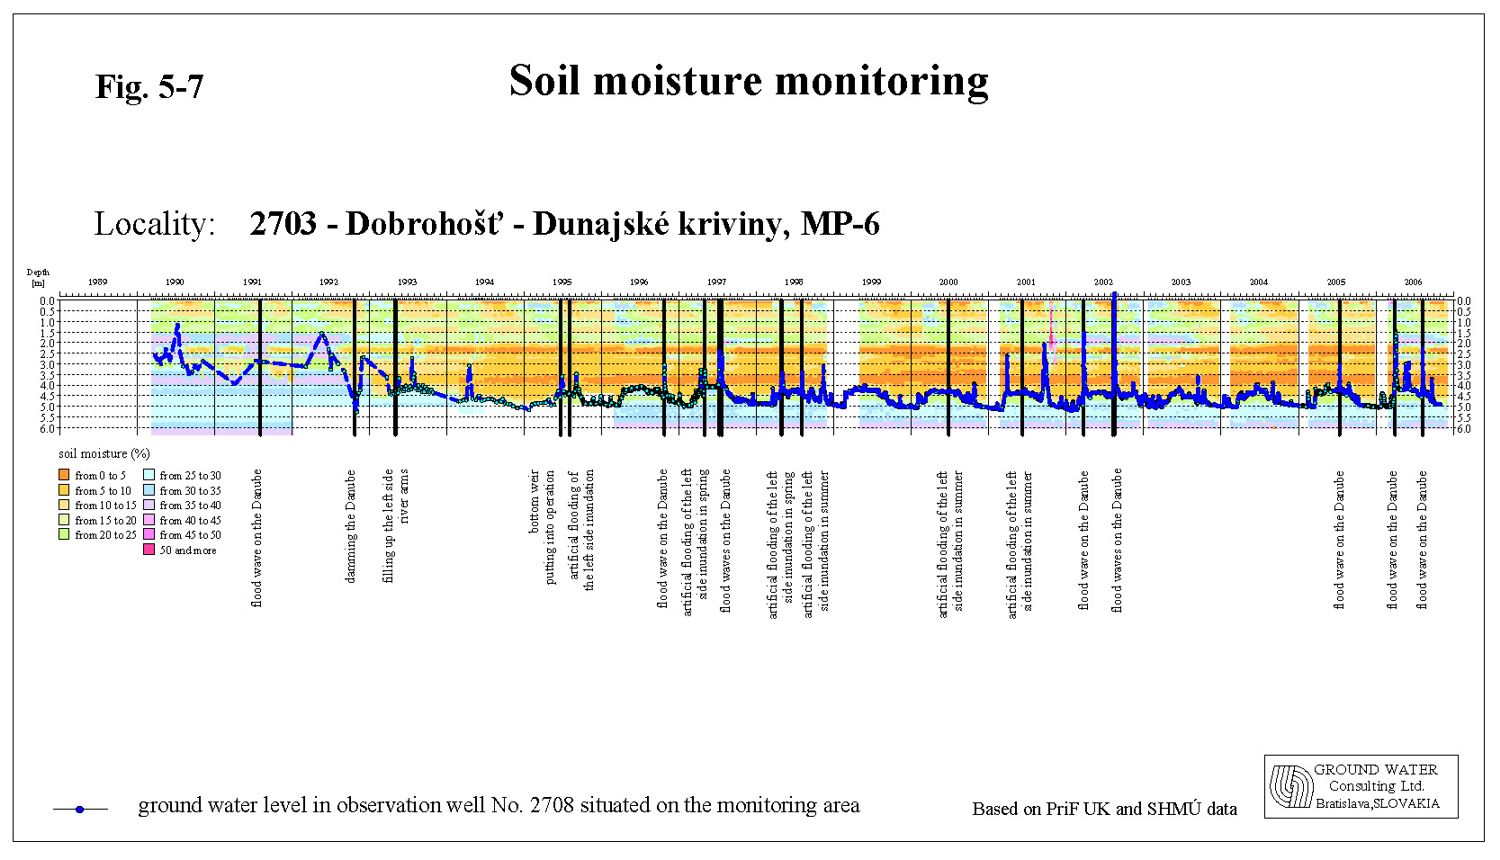
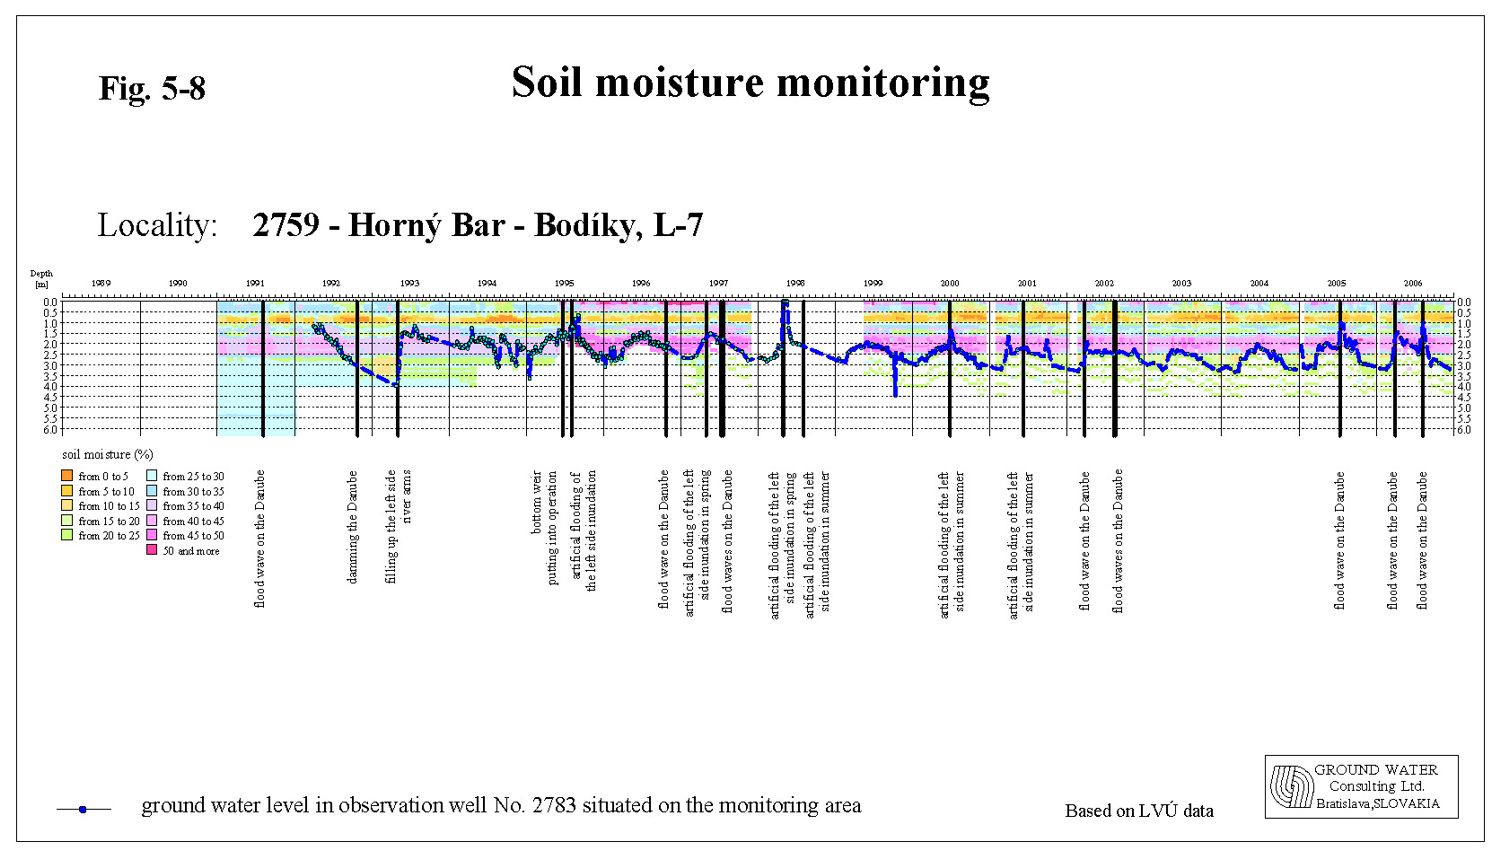
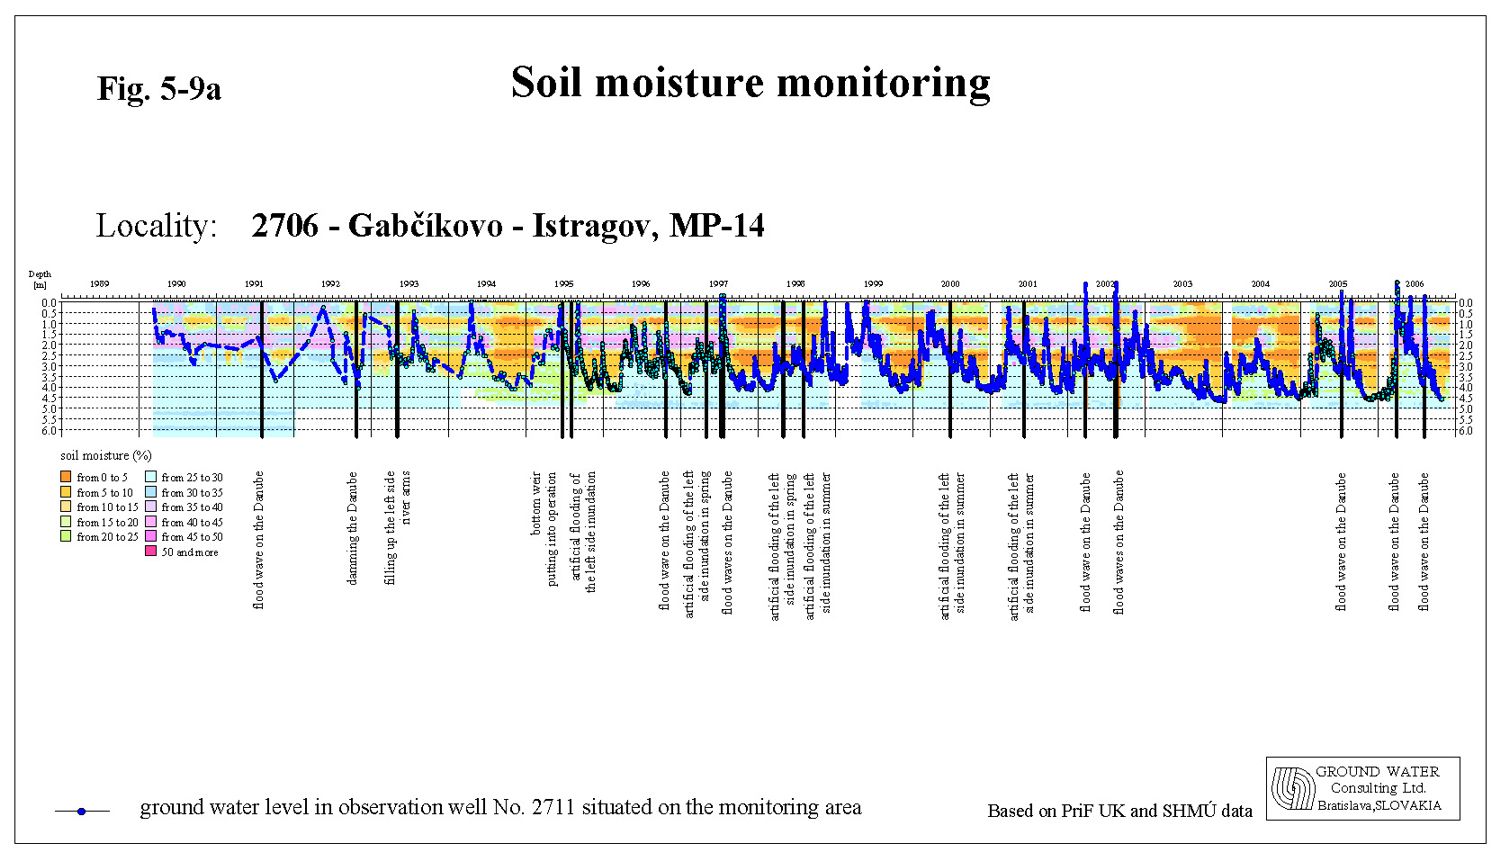
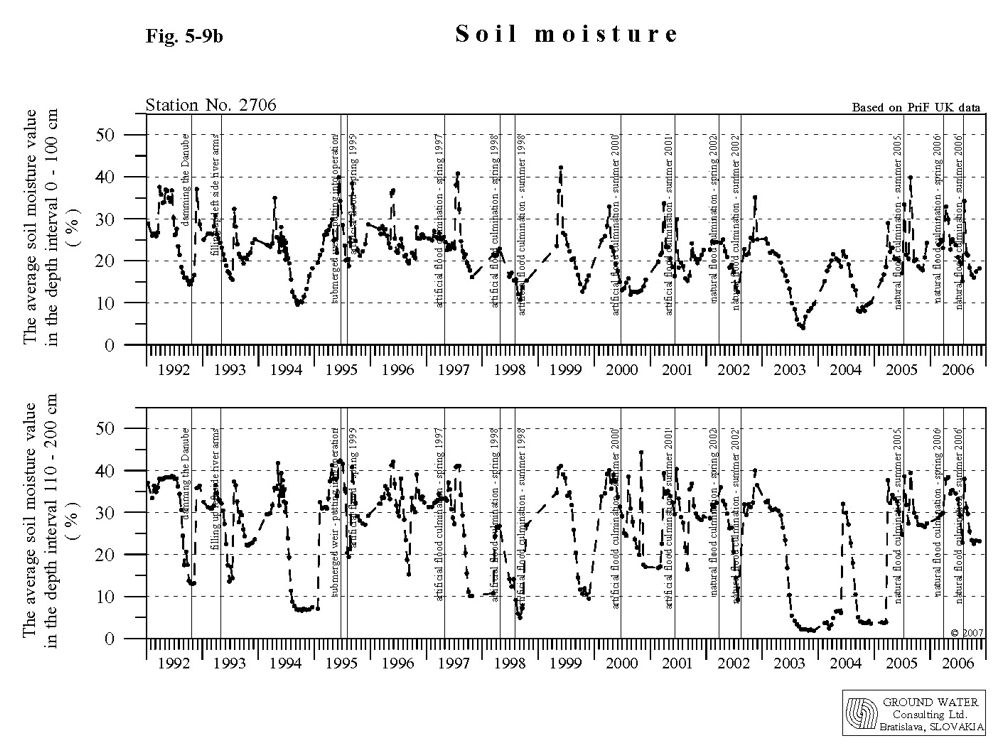
The situation in the inundation area is more complex. Changes of the soil moisture content depend mainly on the location of the monitoring site in respect to the Danube, in respect to the river branch water supply, and on the soil profile thickness. The soil moisture is, along with the ground water level and precipitation, highly dependent on natural or artificial floods. In hydrological year 2006 natural floods over 6000 m3s-1 occurred in three occasions. During the flood in March-April the water flooded a large part of the inundation area. The soil moisture content at the beginning of vegetation period was favourable influenced by rich precipitation at the beginning of the year and particularly by the high amount of rainfall in April and May. At the beginning of the vegetation period the soil moisture content in the whole soil profile reached 90-95 % of saturation. Moreover the hydrological conditions at the end of March and in April were very favourable. The maximal values of the average soil moisture in the layer down do 1 m depth were recorded in March-April and also in August. In the layer below 1 m depth the maximum values occurred from the end of March to June and in August, when flood waves occurred in the Danube. From August till end of the year the soil moisture content continuously decreased. Significant decrease in soil moisture content was registered in July as well, when very low amount of precipitation and low flow rates in the Danube occurred. In the upper part of the inundation area, around Dobrohošť and Vojka villages, the thickness of the soil profile at monitoring sites No. 2703, 2764, 2763, 2762 and 2761 is low, similarly to the Hungarian side. The ground water level at these places fluctuates in the gravel layer only. In 2006 the ground water level on the area No. 2703 fluctuated from 1.5 to 5 m, on the areas No. 2764, 2763, 2762 and 2761 changed from 0.7-4.5 m. The average values of the soil moisture content in both depth intervals significantly fluctuated. Layers to 1 m depth were highly dependent on the climatic conditions (Fig. 5-7), while layers below 1 m depth were strongly influenced by the ground water at the time of flood discharges in the Danube. Maximal average soil moisture contents occurred in April 2006. Minimal values occurred in July and at the end of the vegetation period. The maximal values of soil moisture in the depth below 1 m occurred during flood wave August; the minimal values occurred at the end of the year. The thickness of the soil profile in the middle part of the inundation area is higher. In general the ground water regime in this region is influenced by the water supply of the river branch system, introduced in May 1993. Moreover, the natural or artificial floods have a high influence on the ground water level. The ground water level in 2006 fluctuated above the boundary between the soil profile and gravel layers - monitoring sites No. 2704, 2705, 2758, 2759, 2760 (Fig. 5-6a, Fig. 5-6b, Fig. 5-8) and supplied the soils with water for a greater part of the year. The maximal values of average soil moisture content in the layer to 1 m depth were reached in April 2006, minimal values occurred in July and October 2006. In the layer below 1 m depth the maximal values occurred in April and August, when flood waves occurred in the Danube; the minimal values at the end of the year 2006. In the lower part of the inundation area, downstream of the confluence of the river branch system and the Danube (monitoring sites No. 2706, 2756, 2755), the ground water level usually fluctuates around the boundary between the soil profile and the gravel layer. During floods and higher discharges in 2006 the groundwater level moisturised the soil profile in both depth interval, or even the monitoring sites were flooded. However, due to riverbed erosion downstream of the confluence of the tail race canal and the Danube old riverbed decrease of groundwater level was registered, especially at low flow rates in the Danube. This fact causes decrease in soil moisture content during low, or even average flow rates in the Danube. The average values of the soil moisture significantly fluctuated, and were strongly dependent on the ground water level fluctuation. The minimum and maximum values were related to the minimum and maximum ground water levels respectively. Minimal average values of soil moisture in layers up to 1 m depth occurred in July and at the end of the vegetation period (October); in the layer below 1 m depth at the end of the year only. The maximal average values of soil moisture were reached during flood waves in April and August 2006 (Fig. 5-9a, Fig. 5-9b). The soil moisture contents at monitoring sites No. 2707, 3804, 3805, located in the inundation below the confluence of the tail race canal and the Danube old riverbed, are highly influenced by the flow rate regime in the Danube. The maximum values in 2006, in the depths down to 1 m and between 1 and 2 m, occurred in April and August, while the minimum values occurred in July and at the end of the year. The ground water level at monitoring sites No. 2707, 3804 and 3805 fluctuated in the depth 0-4 m. The riverbed erosion negatively influences these monitoring areas. During low flow rates in the Danube the ground water level does not supply the soil profiles sufficiently. Table 5-6: The minimal and maximal average soil moisture contents at forestry monitoring sites
|
||||||||||||||||||||||||||||||||||||||||||||||||||||||||||||||||||||||||||||||||||||||||||||||||||||||||||||||||||||||||||||||||||||||||||||||||||||||||||||||||||||||||||||||||||||||||||||||||||||||||||||||||||||||||||||||||||||||||||||||||||||||||||||||||||||||||||||||||||||||||||||||||||||||||||||||||||||||||||||||||||||||||||||||||||||||||||||||||||||||||||||||||||||||||||||||||||||||||||||||||||||||||||||||||||||||