PART 3
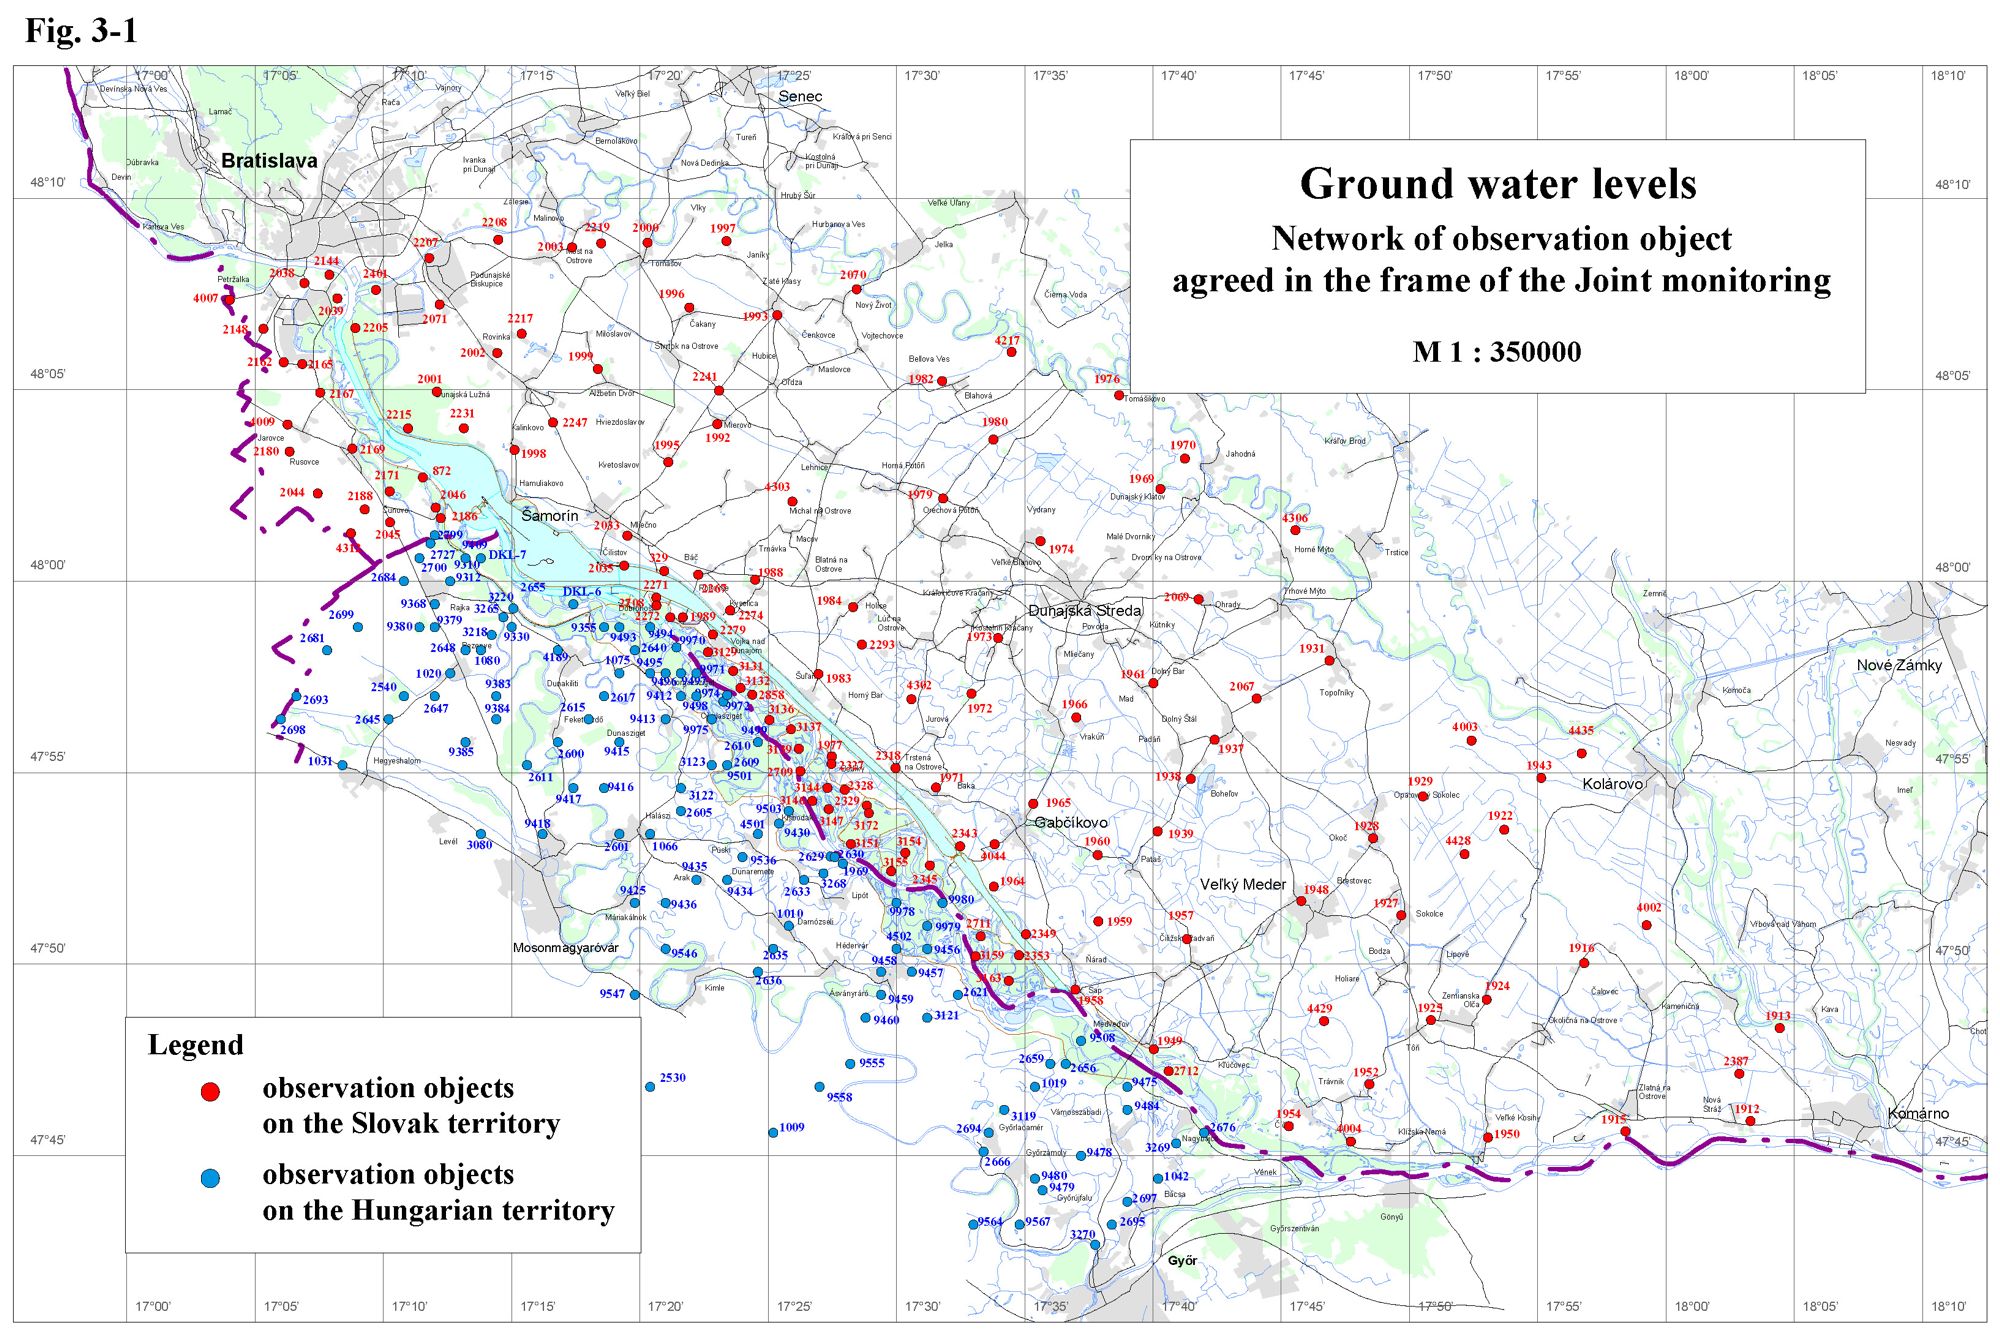
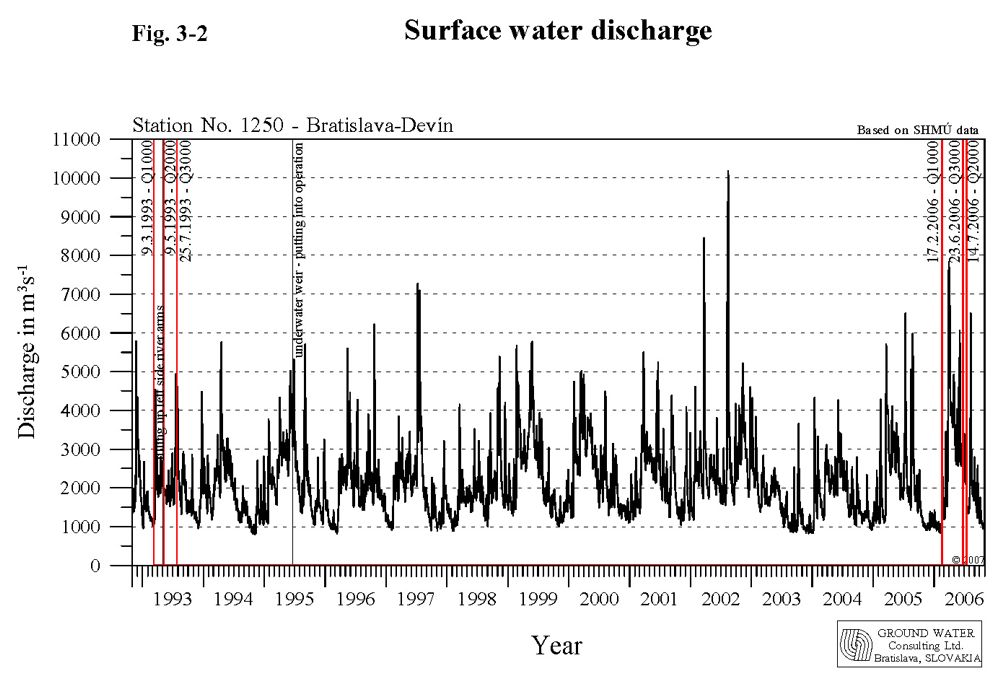
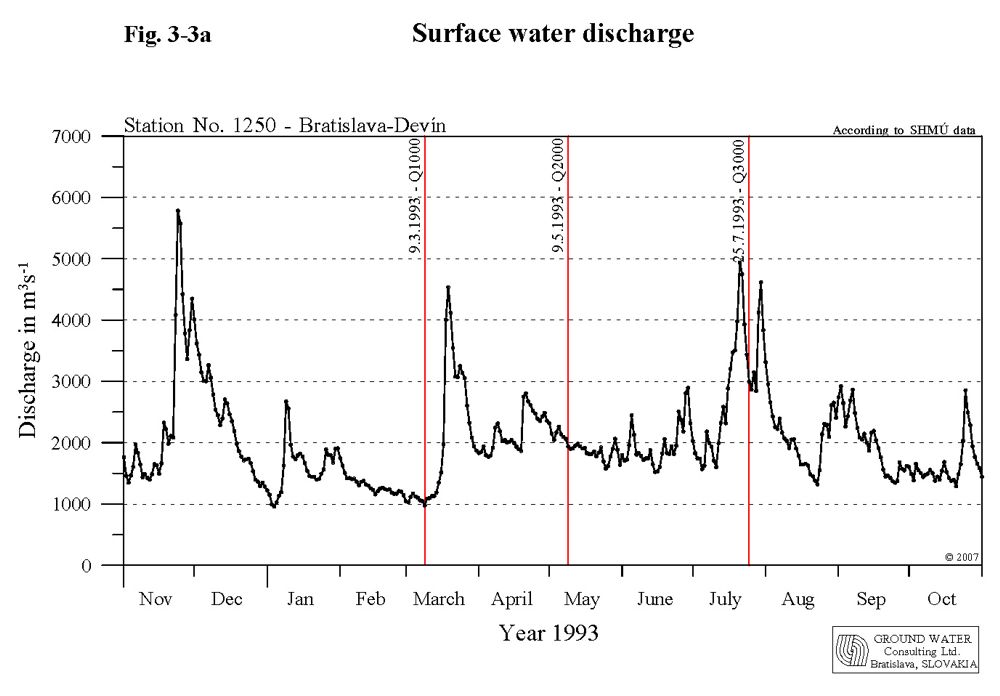
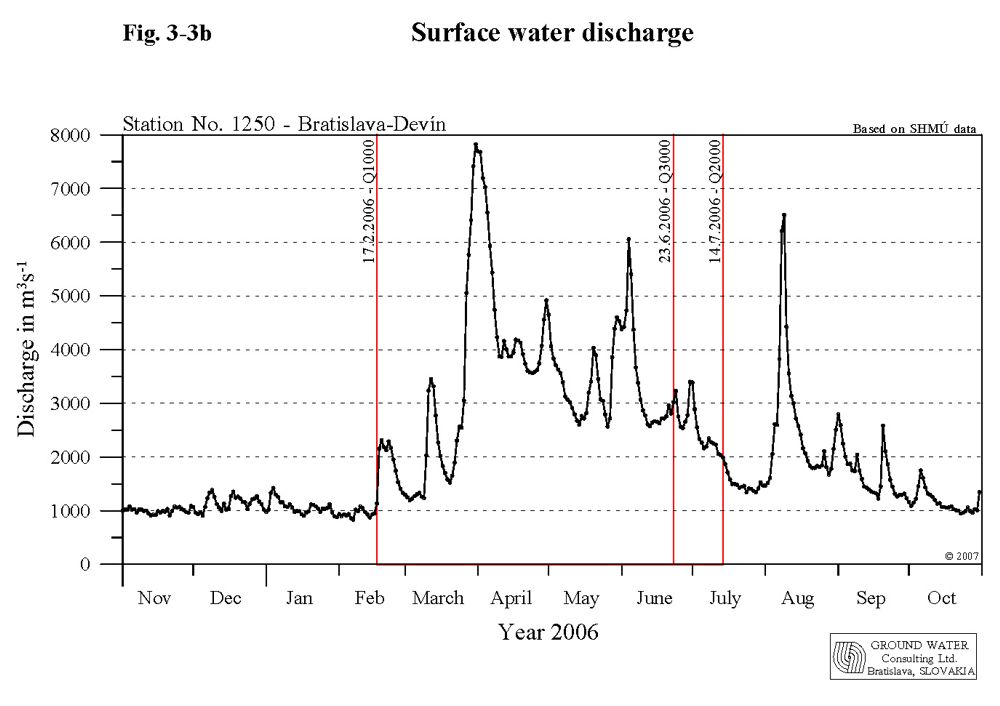
Ground Water RegimeThe impact of temporary technical measures and discharges into the Danube and the Mosoni branch of the Danube, realised according to the Agreement, and the impact of the water supply on the ground water regime and ground water levels in the hydrological year 2006 was monitored by 255 observation wells on the Slovak and the Hungarian territories. These monitoring objects are situated in the area of Žitný ostrov and in the Szigetköz region. List of observation wells is given in National Annual Reports on environmental monitoring respectively. The situation of the observation networks on both sides is shown in Fig. 3-1. The evaluation of ground water level data in 2006 in a local scale was done by the Parties themselves and is given in National Annual Reports. The jointly elaborated regional evaluation given in this report was prepared according to the jointly constructed ground water level equipotential lines. The equipotential lines were constructed for comparison of the ground water levels in the influenced area in the current year and the ground water levels before construction of the bottom weir and introducing the water supply into the river branches on Hungarian side. 3.1. Joint evaluation of the ground water regimeGroundwater levels in the observed area are primarily influenced by the surface water levels in the Danube and reservoir. The low water period on the Danube prevailed from the beginning of hydrological year 2006 and lasted till the end of the second decade of February 2006. This was reflected in ground water levels as well, where the minimal water levels in the majority of the observation wells were recorded in February (primarily in observation wells close to the Danube in the upper and middle part of Žitný ostrov area). After the flood wave in March the ground water level started to raise and in April in the area around the Danube it reached maximal levels. In the inland area the maximal levels occurred mainly in June, while in the lower part of the Žitný ostrov area the maximal levels occurred at the beginning of January due to high water level in the channel system. Low water levels were registered in July as well, when low flow rates in the Danube and almost no precipitation occurred. At the end of hydrological year the position of ground water levels returned approximately to the state registered at the beginning of the hydrological year. The ground water level fluctuation changed depending on the position of the observation well. In the upper part of the observed territory and in the inland area the ground water level fluctuation did not exceeded 1 m, while in the area near the Danube and in the lower part of inundation area it exceeded 3-4 m. The regional evaluation is focused on the area influenced by the water supply. For computing the ground water level differences three hydrological situations were chosen in the period before and after introducing the water supply. The selected hydrological situations characterise the low, average and high flow rate conditions in the Danube, corresponding to flow rates approximately 1000, 2000 and 3000 m3s-1. The selected dates and the corresponding flow rates in the Danube at Bratislava-Devín gauging station are the following (Tab. 3-1, Fig. 3-2, Fig. 3-3a, Fig. 3-3b): Table 3-1
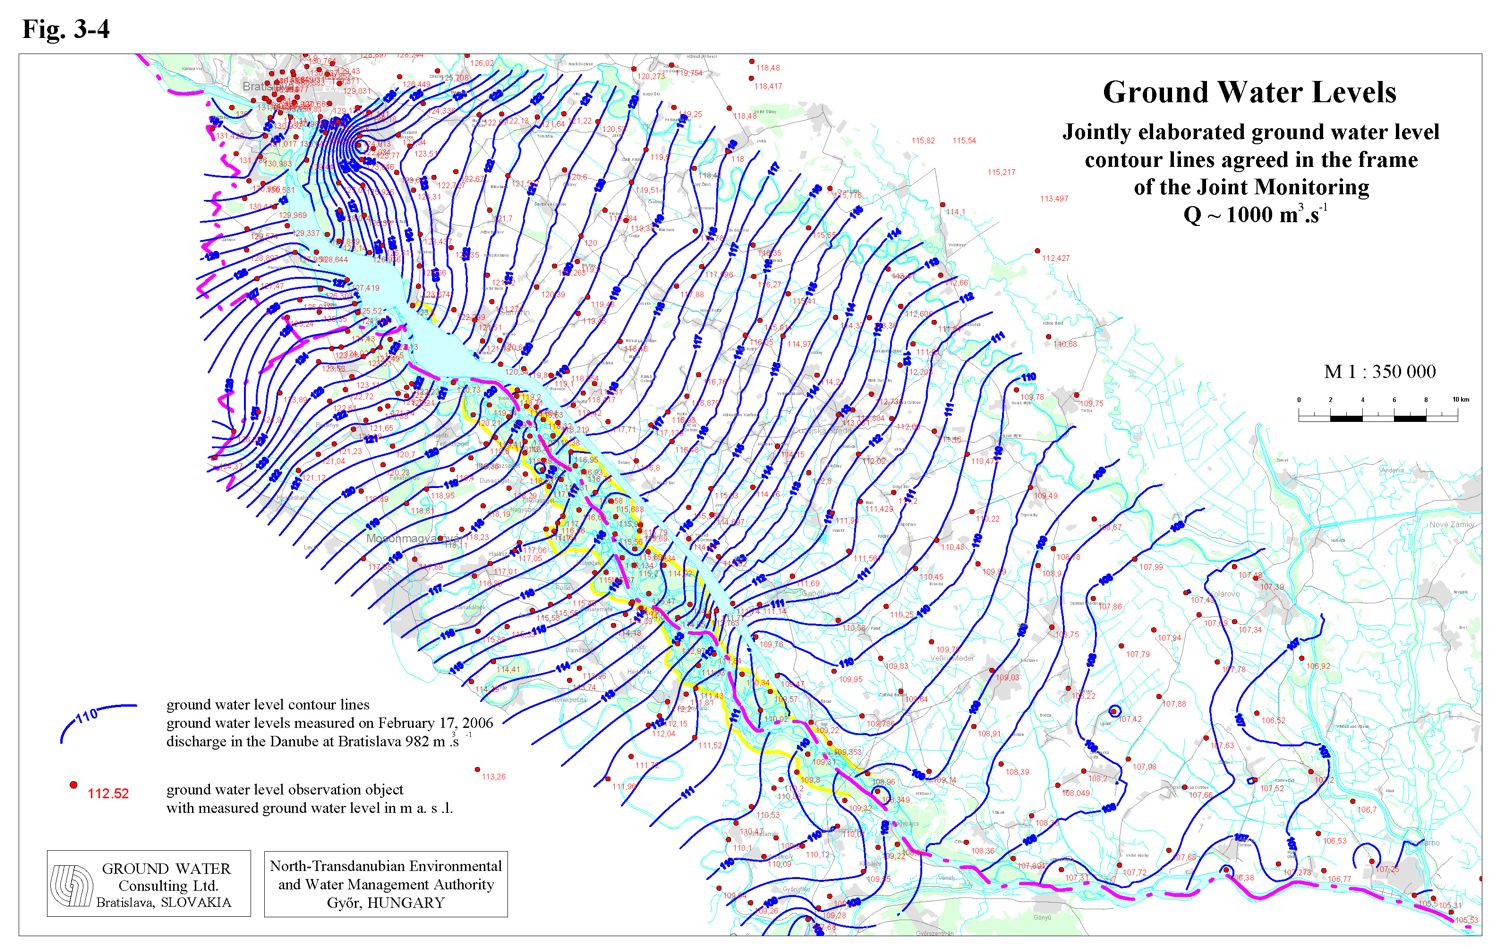
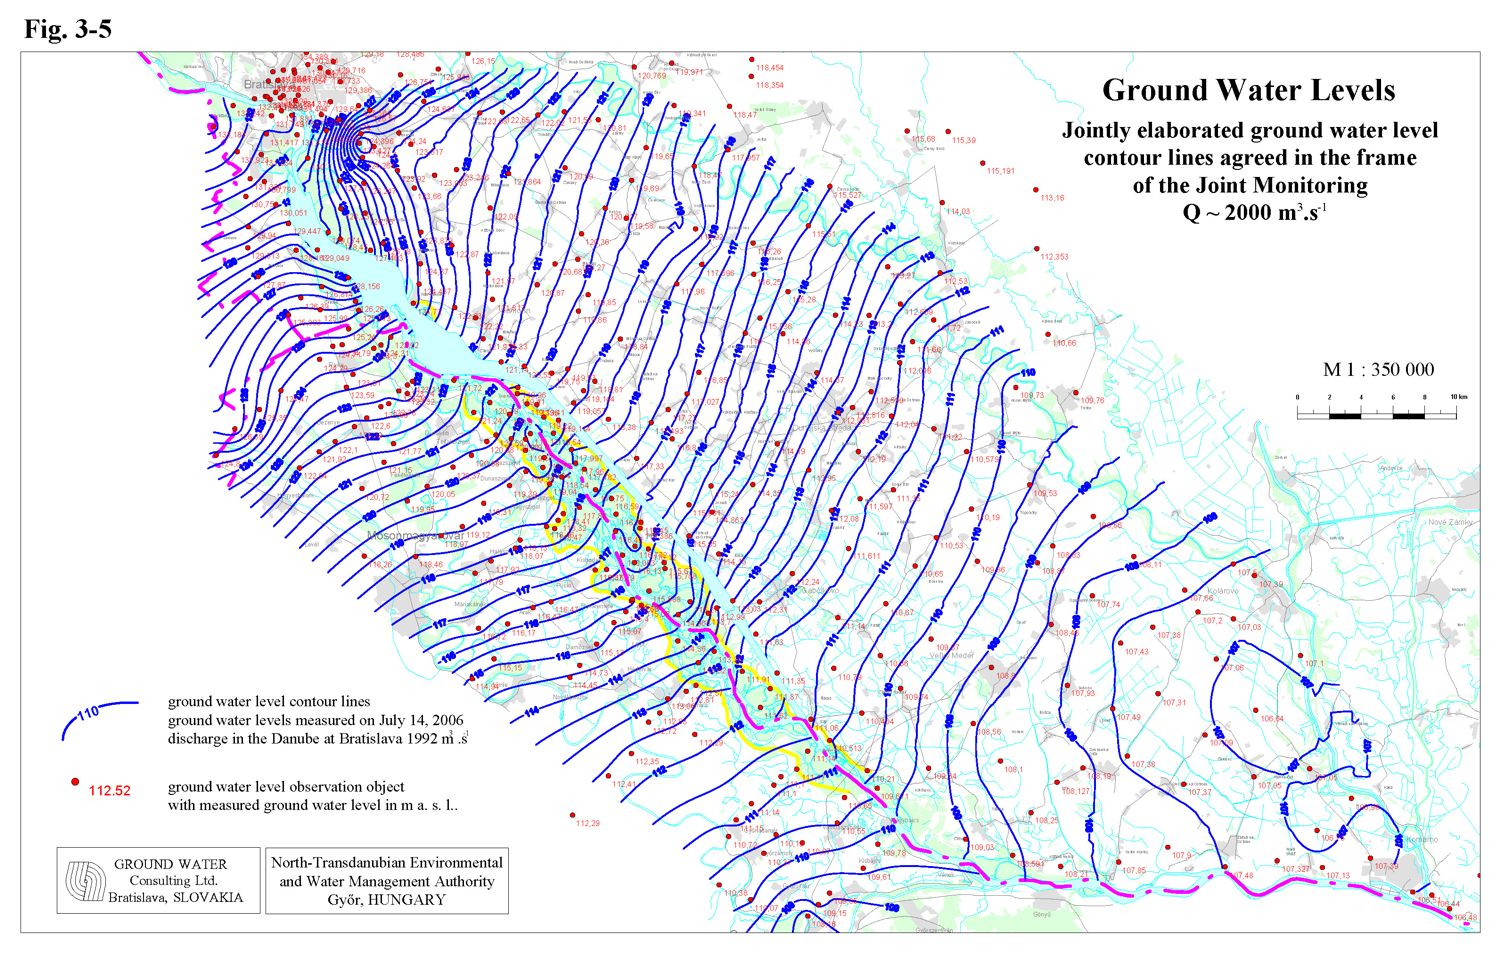
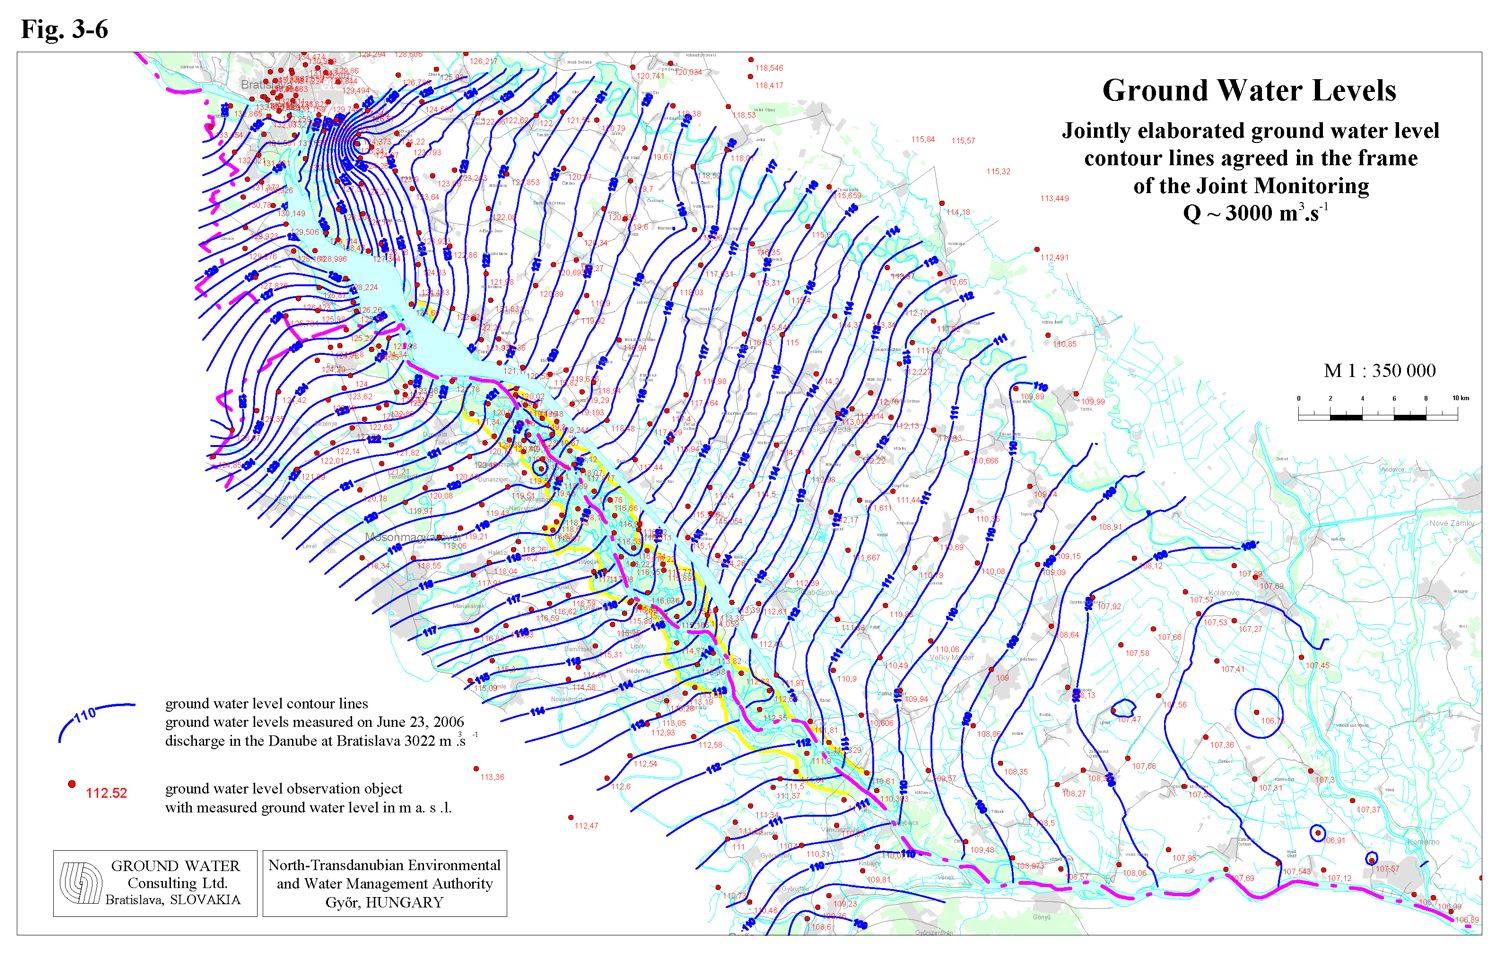
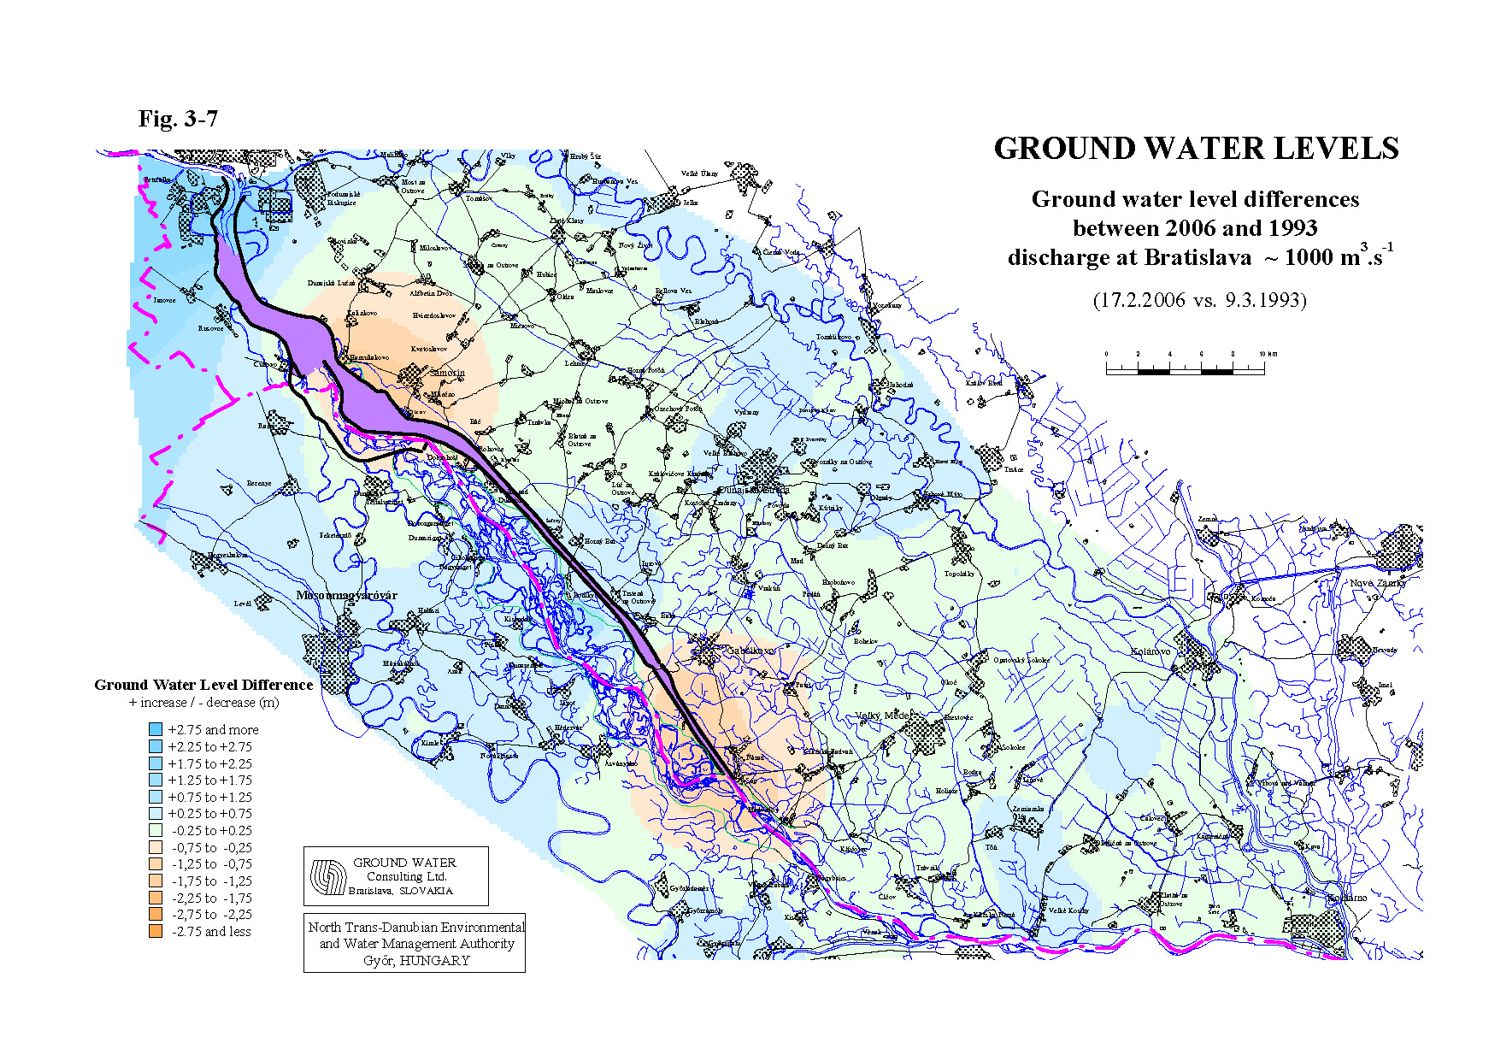
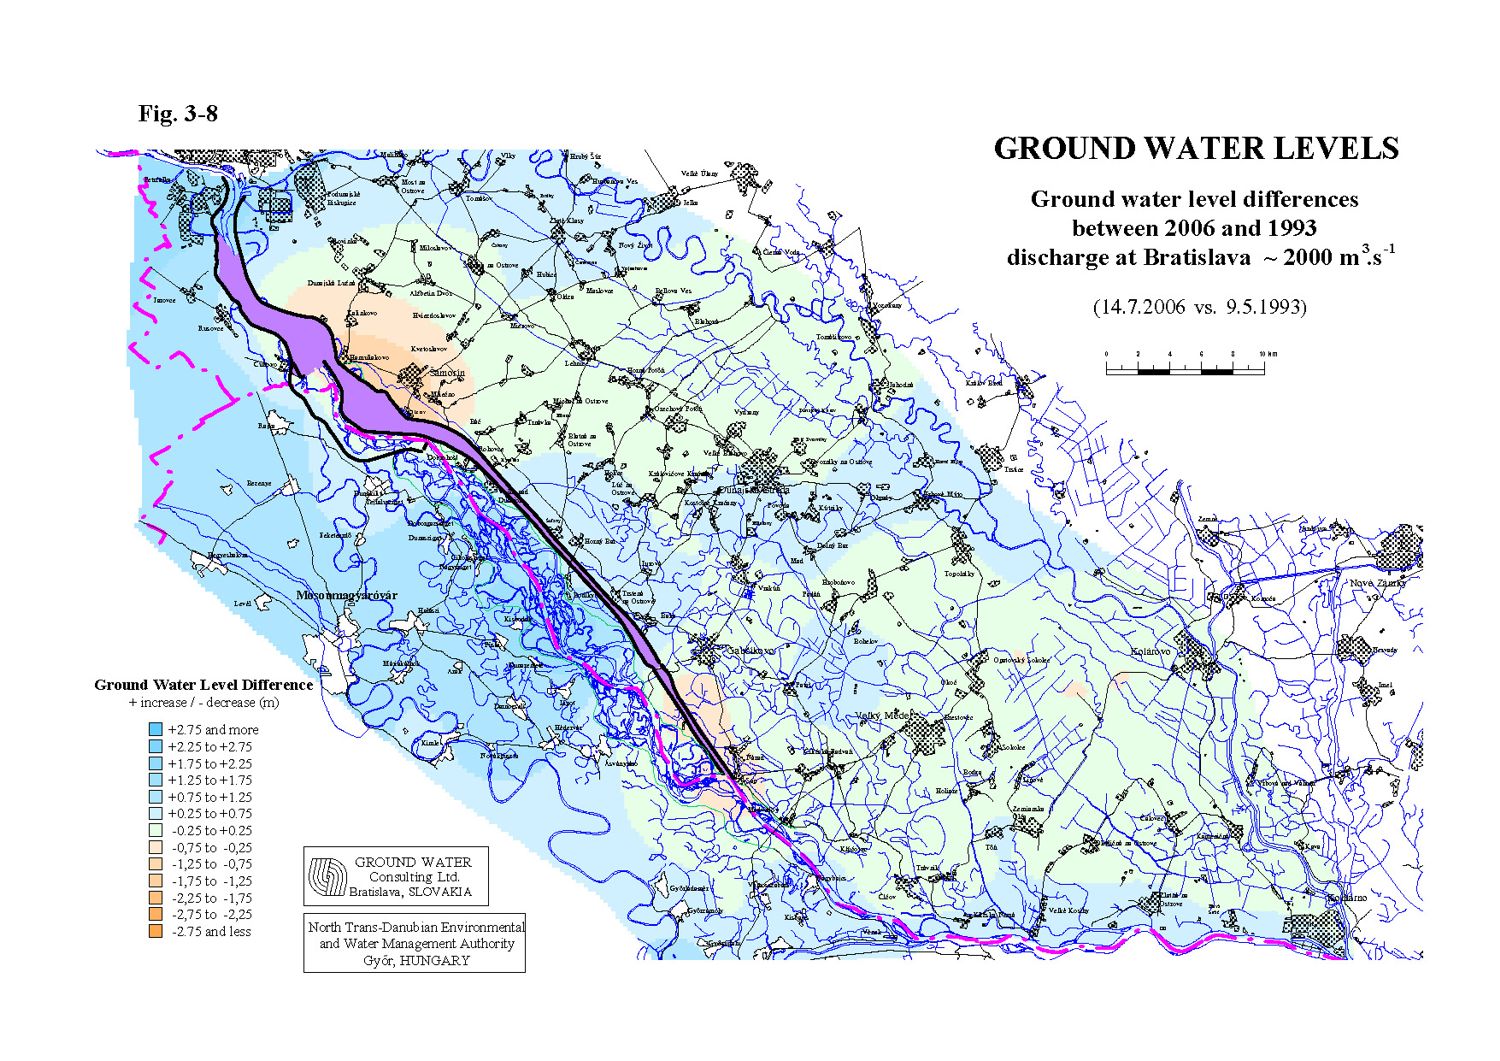
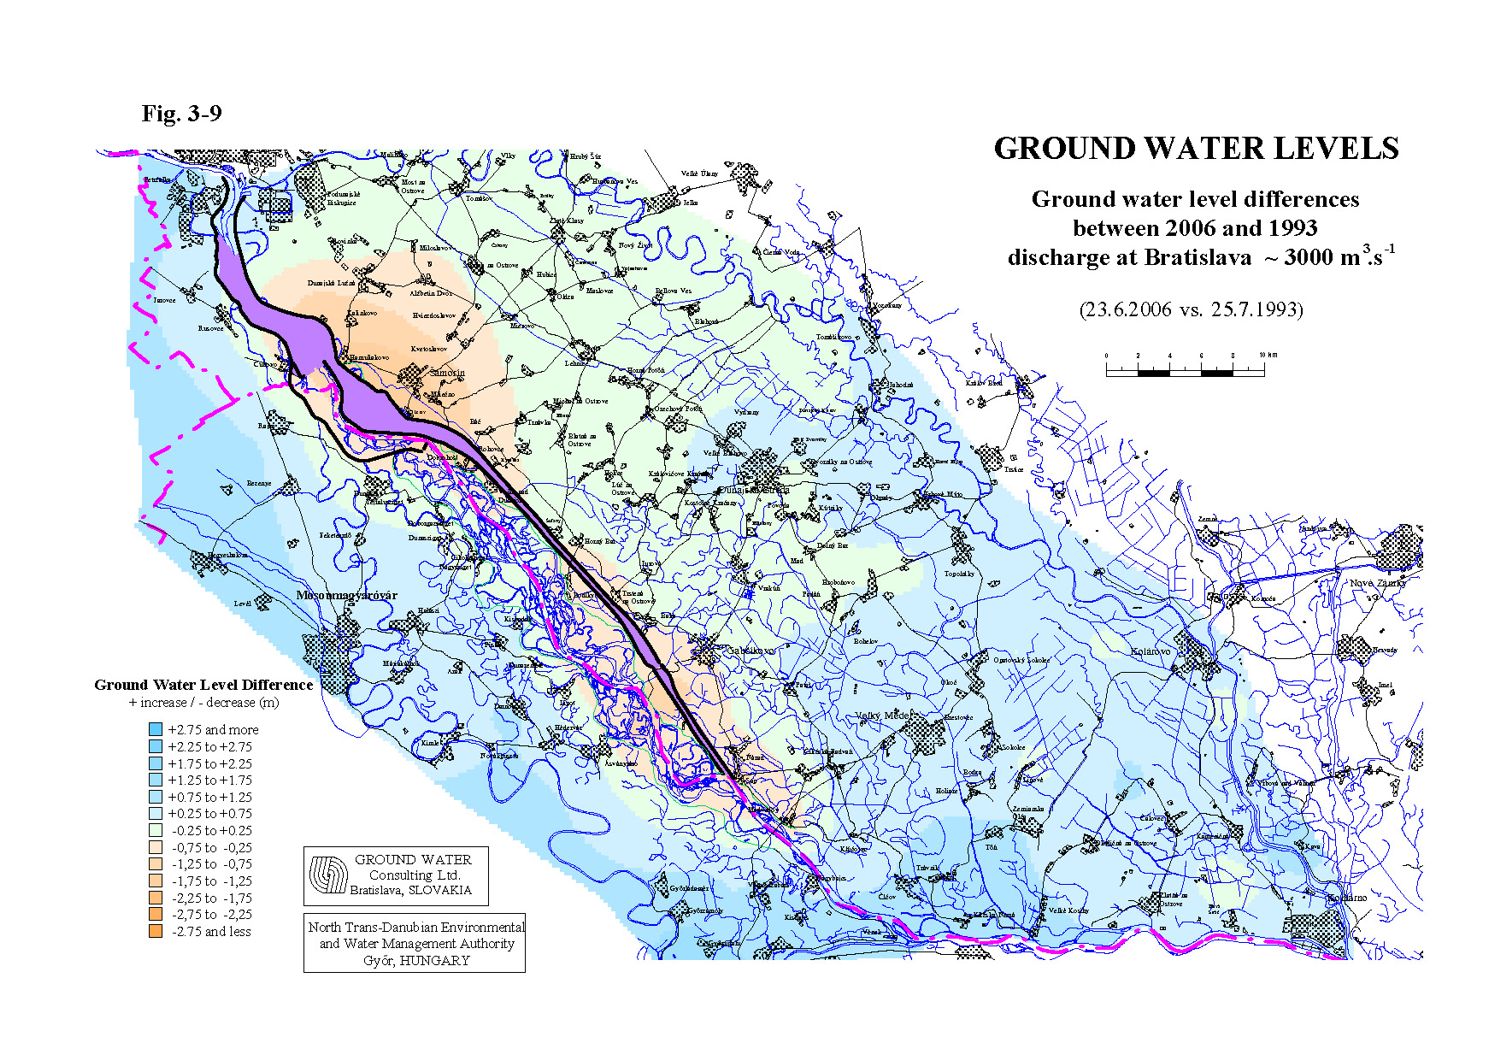
Low flow was chosen at the end of the low flow rate period in the second decade of February 2006. The average flow rate period was chosen in July, in a comparable hydrological situation as the period chosen in 1993. The high flow rate period was chosen in the third decade of June 2006, when the average discharge fluctuated around 3000 m3s-1. Maps of equipotential lines were jointly constructed for the selected dates using the measured ground water levels (Fig. 3-4, Fig. 3-5 and Fig. 3-6). In wells where the water level is measured once a week, the ground water level for the selected dates was computed by linear interpolation. In all other wells the daily average values were used. The altitudes of the ground water levels are given on maps for each observation object used for the equipotential line construction. For constructing equipotential lines computed surface water level data in the Danube was used as well. This level was computed by a calibrated model, using river morphology data and measured water levels data on a given stretch. The other surface water levels were not used for constructing the equipotential lines. The constructed equipotential lines represent general ground water levels and flow direction, and do not show the local influences of the channels or river branch systems. Differences between ground water levels for selected comparable hydrological situations are expressed in Fig. 3-7, Fig. 3-8 and Fig. 3-9. The evaluation is mainly focused on the area influenced by the technical measures and discharges according to the intergovernmental Agreement and by the water supply realised on the Hungarian side. In this sense the inundation and the flood-protected area on the Hungarian side, and partly the inundation area on the Slovak side, represent the influenced area. Low flow rate conditions Comparing the low water hydrological situations (approximately 1000 m3s-1) in periods before and after realising the technical measures and releasing discharges according to the Agreement (2006 versus 1993), it can be stated that, in consequence of an increased water level in the Danube old riverbed and water supply into the right side river branch system and into the Mosoni Danube, on large part of the influenced area significant increase of ground water levels occurred, both on the flood-protected area and the inundation area as well (Fig. 3-7). The ground water level increase in the upper part of the Szigetköz area between Rajka and Dunakiliti is reduced by ground water level decrease in the area around the reservoir caused by decrease of permeability of the reservoir bottom in between the compared periods. In the middle part of the Szigetköz area between Dunakiliti and Ásványráró, significantly higher ground water levels were created at low flow rate conditions as a response to the water supply of the river branch system and inland channels. A significant increase in the ground water level also occurred along the Mosoni Danube. In the lower part of the Szigetköz, downstream from Ásványráró and around the Bagoméri river branch system the ground water levels were slightly lower than in 1993. Lower ground water levels were recorded on the left side of the reservoir, in the upper part of the Žitný ostrov as well, due to the big difference in the permeability of the reservoir bottom. However, the ground water levels at present are much higher than before constructing the dam. For an overall evaluation of impacts in the influenced area similar comparison for periods before constructing the dam and the present time would be required. Significant decrease in ground water levels occurred along the tail race channel and downstream the confluence of the tail race channel and the Danube old riverbed. The riverbed erosion influences this region. On a large part of the Slovak side there were no changes in ground water levels observed. In general the increase of ground water levels is about 0.2-0.75 m in comparison to ground water levels in 1993. This occurs mainly in the area affected by water supply realised on the Hungarian side. There is an increase of ground water levels in the inundation area on the Slovak side as well, which is evoked by the water supply on the Slovak side, however this is independent on measures according to the Agreement. The ground water level fluctuation during the year in the upper and middle part of the Szigetköz region was around 0.5-1.5 m. In the lower part of the Szigetköz it changed between 1.5-3 m, near the Danube it exceeded 3-4 m. The ground water flow direction in the upper part of the river down to Dunakiliti shows infiltration from the river and the reservoir into the surrounding area. Along the Danube from Dunakiliti down to the confluence with the Mosoni Danube the ground water flows into the river bed and the river is draining the adjacent area, but the ground water in the inland area is flowing parallelly with the Danube. In the lower part of Žitný ostrov area Danube, together with the Váh river draining the area. Average flow rate conditions Comparing the ground water levels in the period before realising the technical measures, after increasing the discharges into the Danube according to the Agreement, and after introducing the water supply on the Hungarian side, at average flow rate conditions in the Danube (approximately 2000 m3s-1), the result is similar to that at low water conditions. A significant increase in the ground water levels occurred in both the upper and middle part of the Szigetköz area and along the Mosoni Danube. The ground water level increased about 0.3-1.7 m (Fig. 3-8). The most significant ground water level increase occurred in the upper and middle part of the Hungarian inundation area, where it reaches 0.5-1.75 m. Compared to 1993, the ground water levels along the Danube in the lower part of the Szigetköz (at the mouth of Bagoméri river branch system) were slightly lower. The decrease of ground water levels is caused by riverbed erosion in this Danube stretch. On the Slovak territory no impact from the technical measures according to the Agreement appears. Higher ground water levels in the left side inundation area reflect the different water supply regime in the river branch system in 1993 and 2006. A decrease in the ground water levels can be observed around the left side of the reservoir. This results from a lower water level in the reservoir than in 1993 and a decrease in the permeability of the reservoir bottom as well, but in general the ground water levels are higher than before damming the Danube. On a large part of the Slovak side there were no changes in ground water levels observed. The ground water flow direction in the upper part of the river down to Dunakiliti shows infiltration from the river and the reservoir into the surrounding area. Along the Danube from Dunakiliti down to the Gabčíkovo the ground water flows into the river bed and the river is draining the adjacent area, but the ground water outside the inundation is flowing into the inland area. In the lower part of Žitný ostrov area the Danube supplies the adjacent area and the ground water is drained by the Váh. High flow rate conditions When comparing the high flow rate conditions in the Danube (approximately 3000 m3s-1) for the period before (1993) and after (2006) realising the measures according to the Agreement, a decrease in the ground water levels can be seen along the Danube. In the evaluated year and in the compared period the ground water level in the section between Dunakiliti and Dunaremete show negligible changes against the period in 1993 (Fig. 3-9). The decrease in the upper and lower part of the inundation area mainly reaches 0.1-0.8 m. This difference is partially caused by the difference in the discharges released to the Danube old riverbed in 1993 (1020 m3s-1) and in 2006 (444 m3s-1). On a great part of the Szigetköz area there is an increase of the ground water levels, which is caused by the water supply in the Mosoni Danube and by higher ground water levels on the examined area boundaries. The decrease in the ground water levels on the left side of the reservoir are related to lower water level in the reservoir comparing to the 1993 and decrease in the permeability of the reservoir bottom. In the middle part of the Žitný ostrov area no change is documented. The increase in the lower part of Žitný ostrov area is connected with the surface water regime in the channel system. The ground water flow directions along the Danube, except the upper and middle part of the inundation, show water supply from the Danube into the adjacent area. 3.2. ConclusionsBased on the evaluation of the ground water regime it can be stated that the water supply into the right side river branch system plays an important role in influencing ground water levels over the Szigetköz region. As a result of the measures realised according to the intergovernmental Agreement, a significant increase in the ground water levels occurred for low and average flow rate conditions in the Danube. No changes in the upper and middle part of the Szigetköz region, and a decrease in the ground water levels along the Danube riverbed can be registered for the high flow rate conditions. The monitoring results highlights the necessity of increasing the ground water level in the lower part of the inundation area on both sides. The ground water level increase in the lower part of the Ásványi river branch system and in the Bagoméri river branch systems and on the Istragov island on the Slovak side could be solved by extension the water supply system and by measures applied in the Danube old riverbed upstream of the confluence with the tail race channel. Such measures can improve the general situation in this region. An increase of ground water levels in the strip along the Danube old riverbed on both sides could be ensured only by increase of water level in the Danube by measures realised in the riverbed. The most simple, quickly realisable measure seems to be the solution applied at Dunakiliti at rkm 1843, realised according to the “Agreement”. An overall evaluation of impacts in the influenced area based on the comparison of periods before constructing the dam and the present time would be required. For these purposes extension of the period for mutual data exchange is necessary.
|
|||||||||||||||||||||||||