PART 2
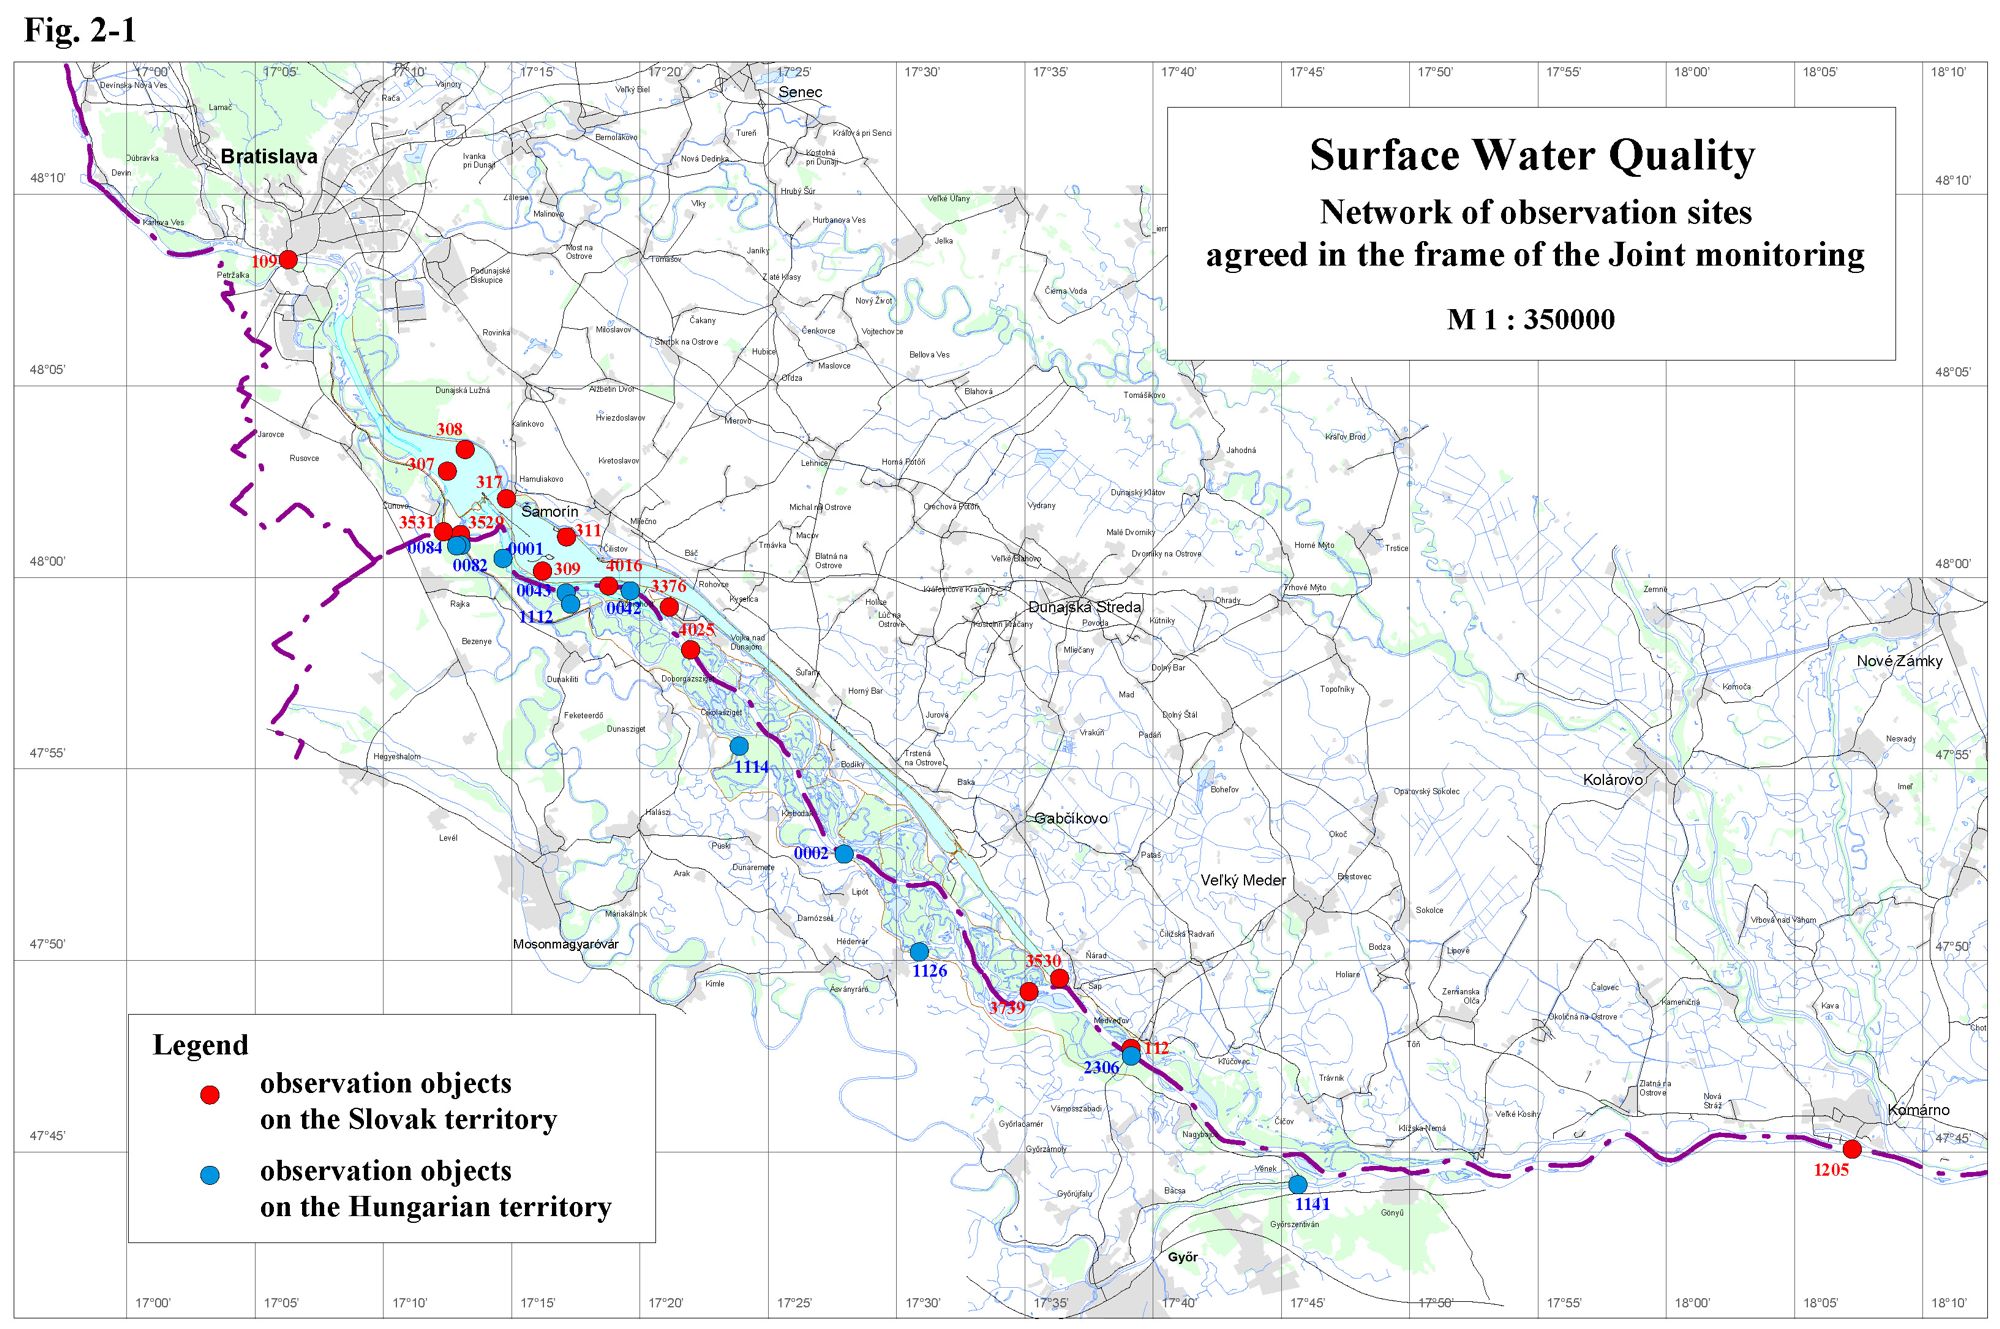
Surface Water QualityIn accordance with the Agreement surface water quality measurements in hydrological year 2006 were carried out at 15 monitoring sites on Slovak territory and at 11 monitoring sites on Hungarian territory - Table 2-1, Fig. 2-1. At all monitoring sites the influence of measures, described in the Agreement, on surface water quality was observed. Main factors, which could influence the water quality, are: the backwater effect upstream of the bottom weir, the increased discharges into the Danube downstream of Čunovo dam and into the Mosoni branch of the Danube, the water supply into the right side river arm system, and morphological changes in the riverbed. Sampling and analysing were mainly performed according to the methods agreed by the Sub-commission for Water Quality Protection of the Slovak-Hungarian Trans-boundary Water Commission. The evaluation was realized according to the “Surface water quality observation directive for Slovak-Hungarian boundary waters and for extended water quality monitoring on the Danube” accepted by the Slovak-Hungarian Trans-boundary Water Commission in 2004. Table 2-1: List of monitoring sites
Surface water quality and sediment quality data for the agreed monitoring sites, and time series diagrams for the respective parameters of the surface water quality, are given in the Annexes to the Slovak and Hungarian National Reports on the Environment Monitoring in 2006. Figures in the Joint Report represent the data of selected parameters. At selected monitoring sites values agreed by the Trans-boundary Water Commission were used. These monitoring sites on the Danube are Bratislava, Rajka, Medveďov, Komárno, on the Mosoni Danube the Lock No. I at Rajka and Vének, and on the right side seepage canal at Lock No. II at Rajka. Limit values for surface water quality classification used in this evaluation were accepted by the Slovak-Hungarian Trans-boundary Water Commission in 2004 - Table. 2-2 (“Surface water quality observation directive for Slovak-Hungarian boundary waters and for extended water quality monitoring on the Danube”). Table 2-2: Agreed limits for surface water quality classification
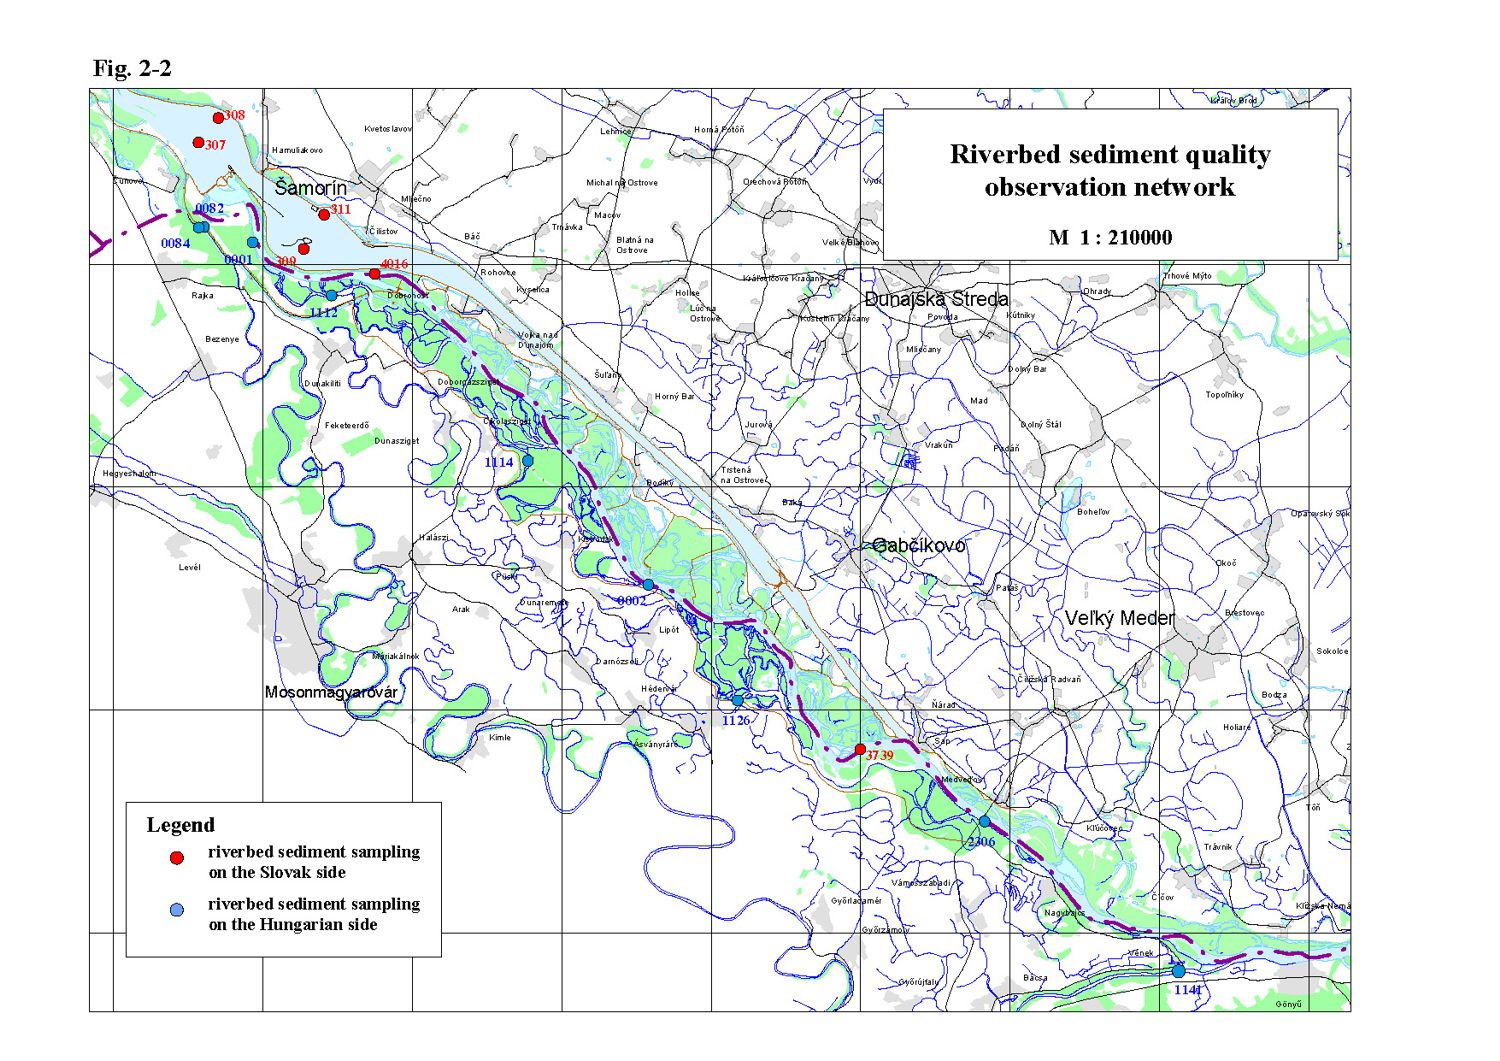
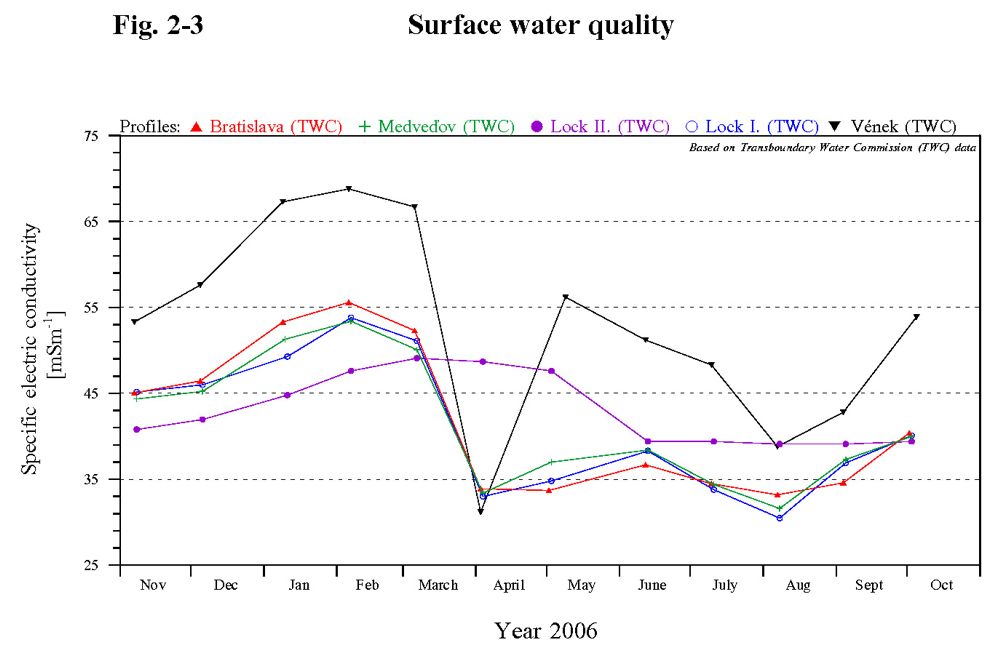
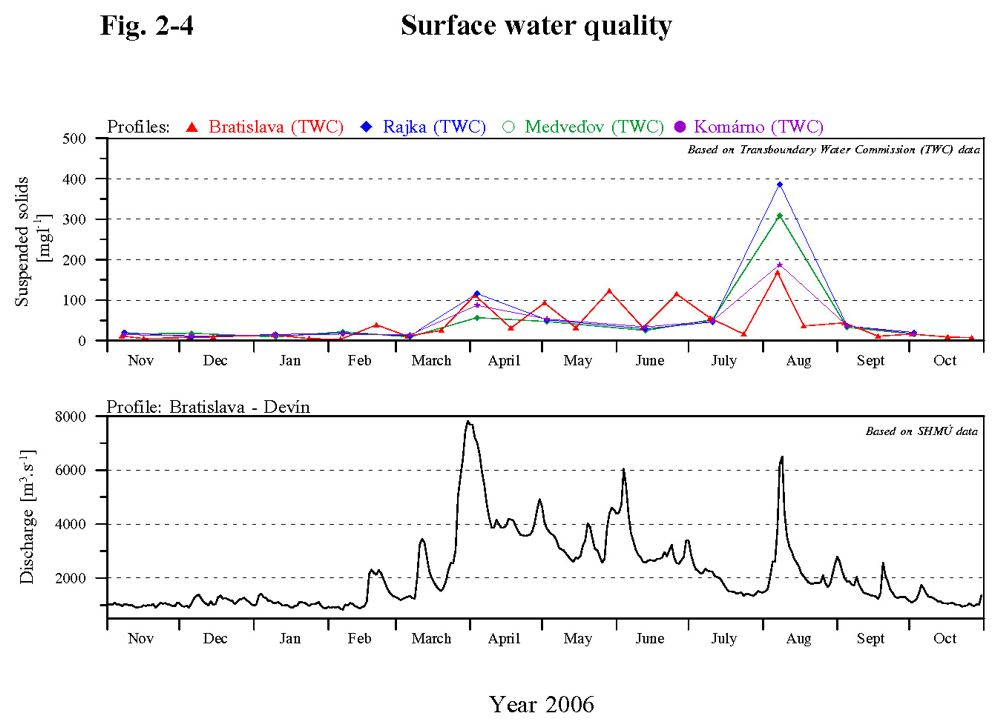
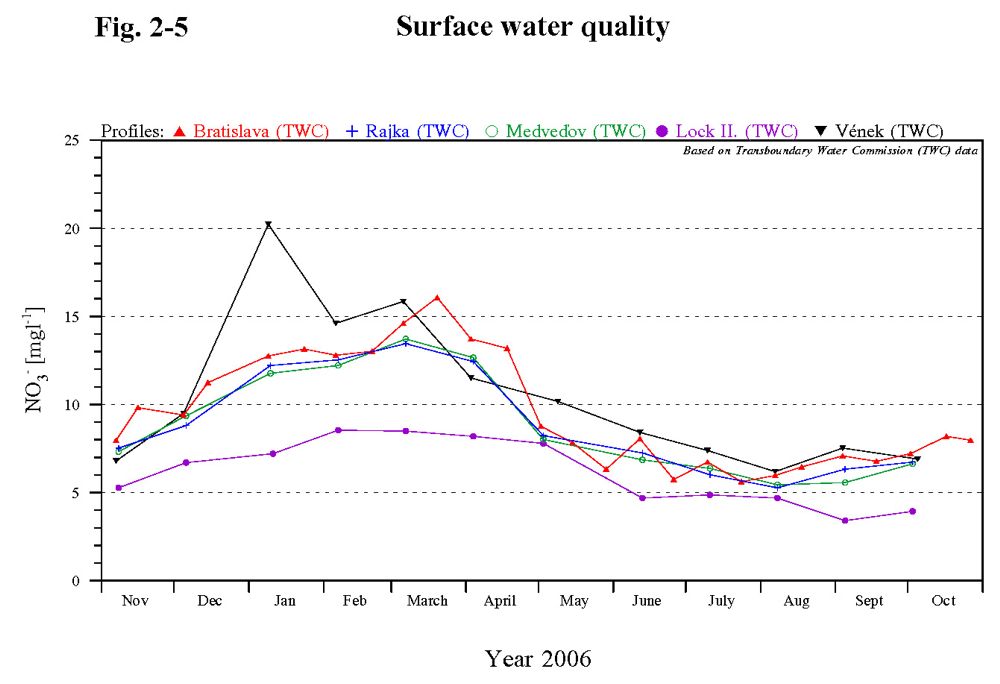
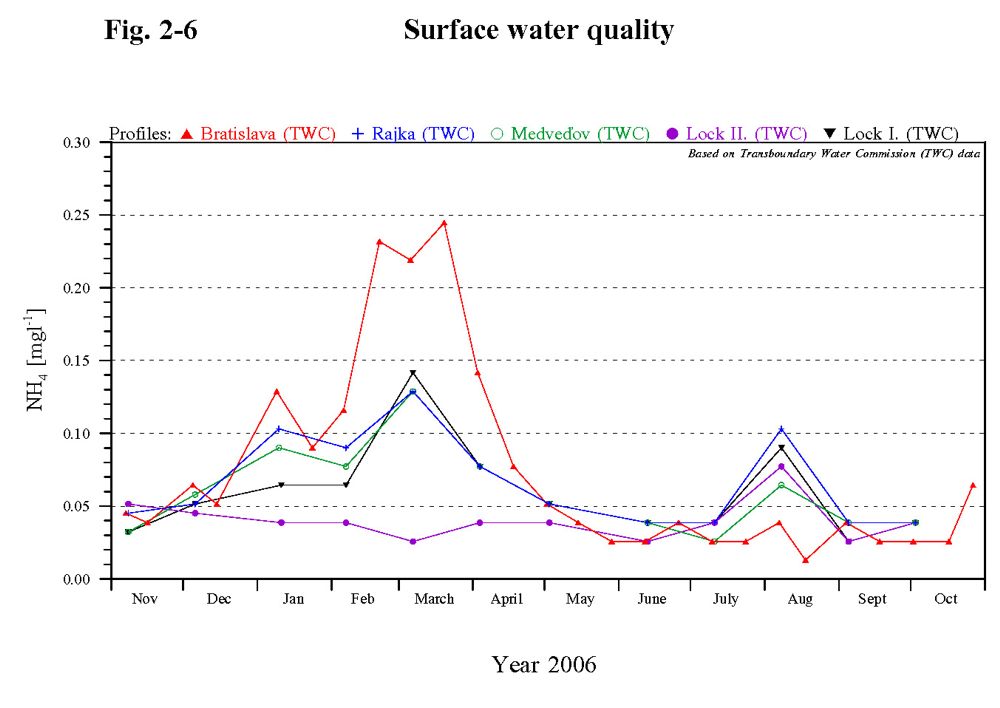
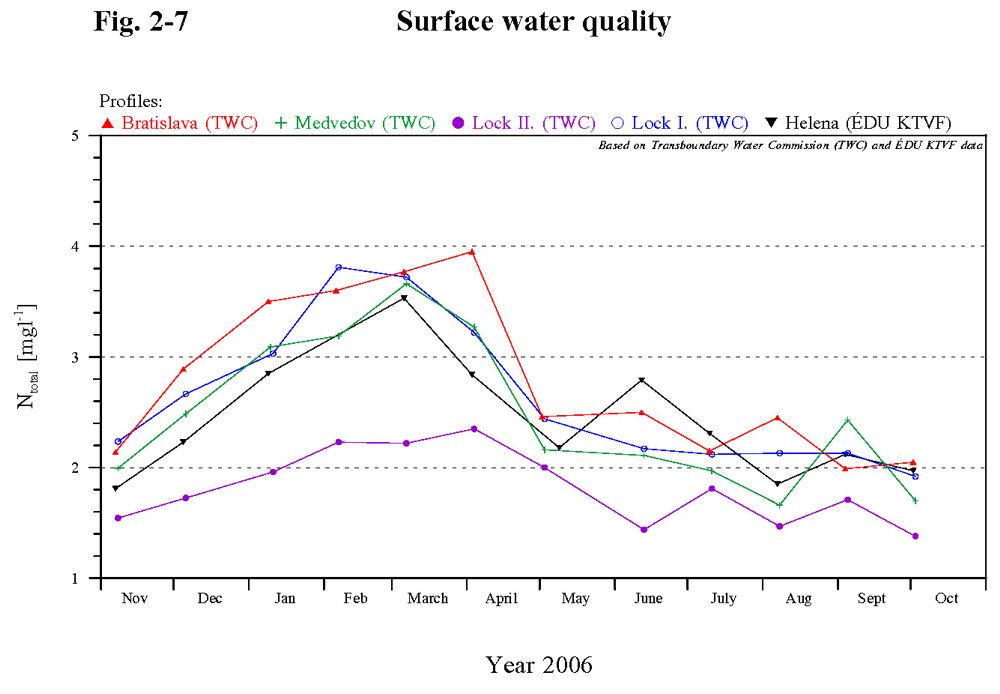
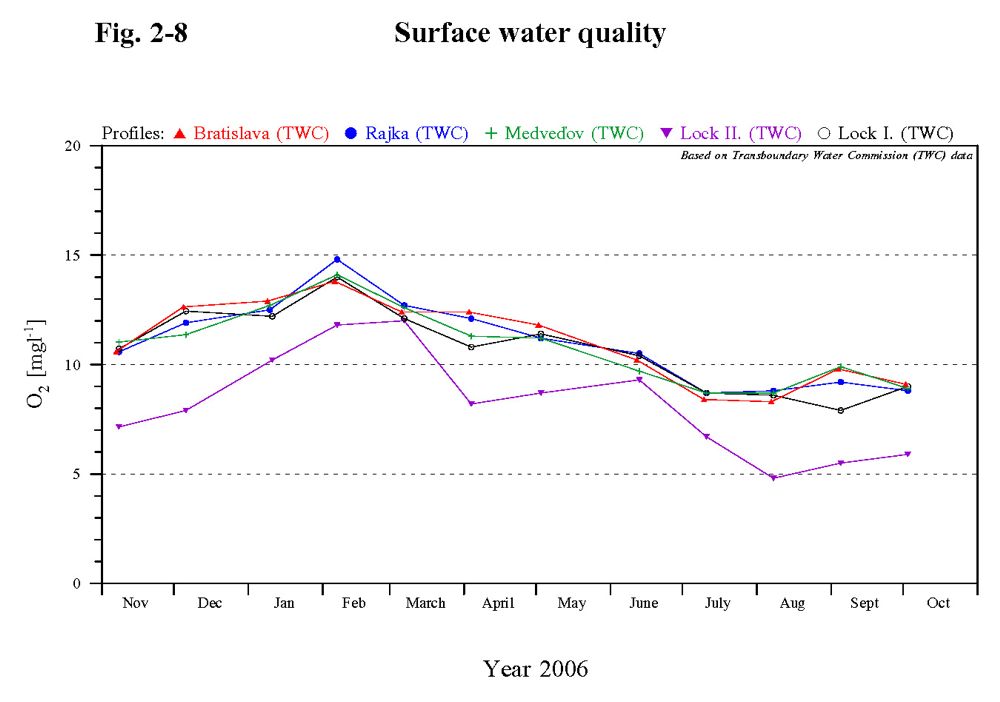
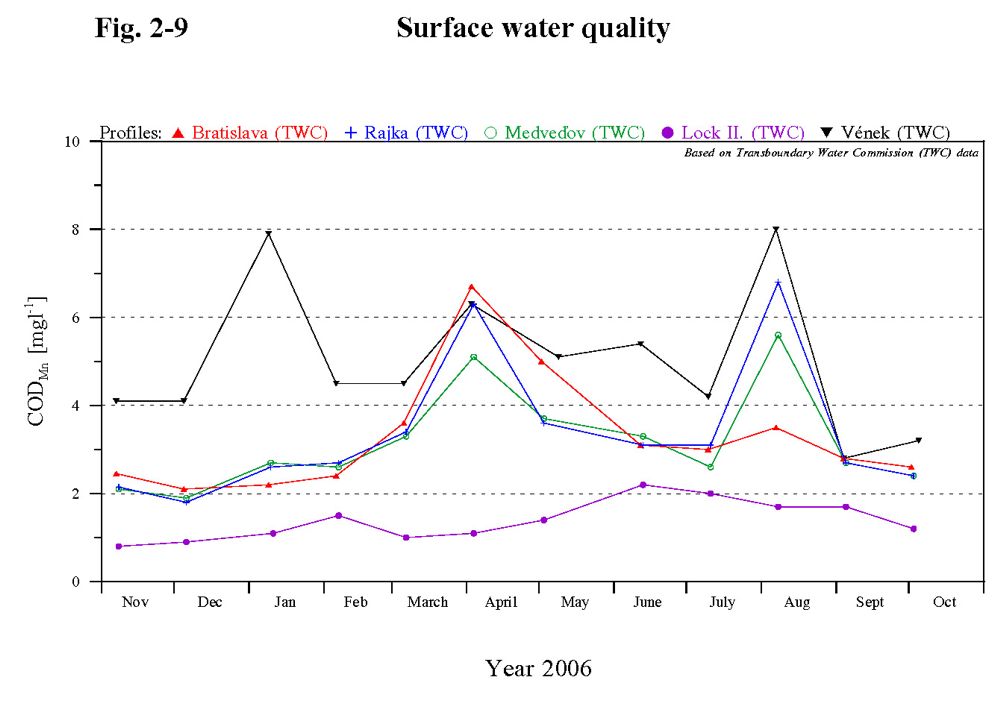
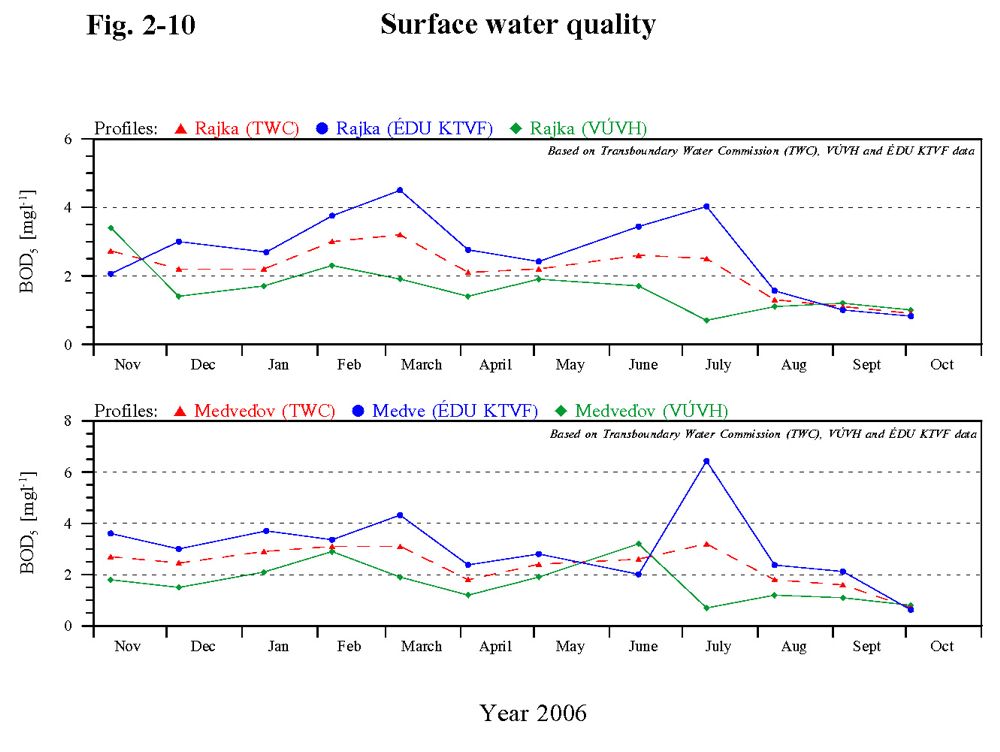
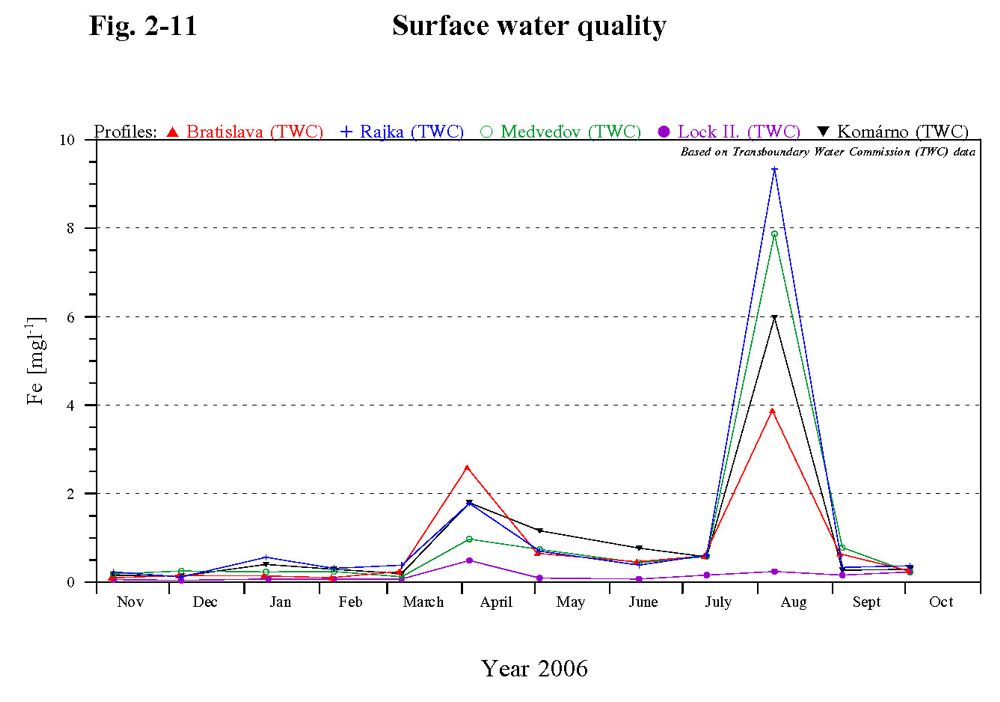
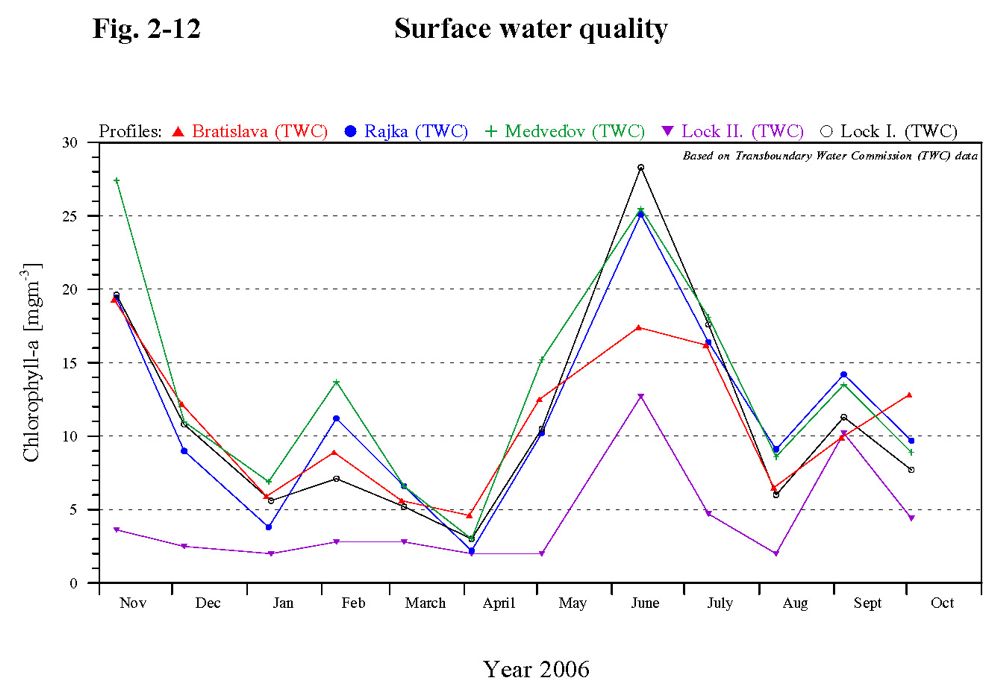
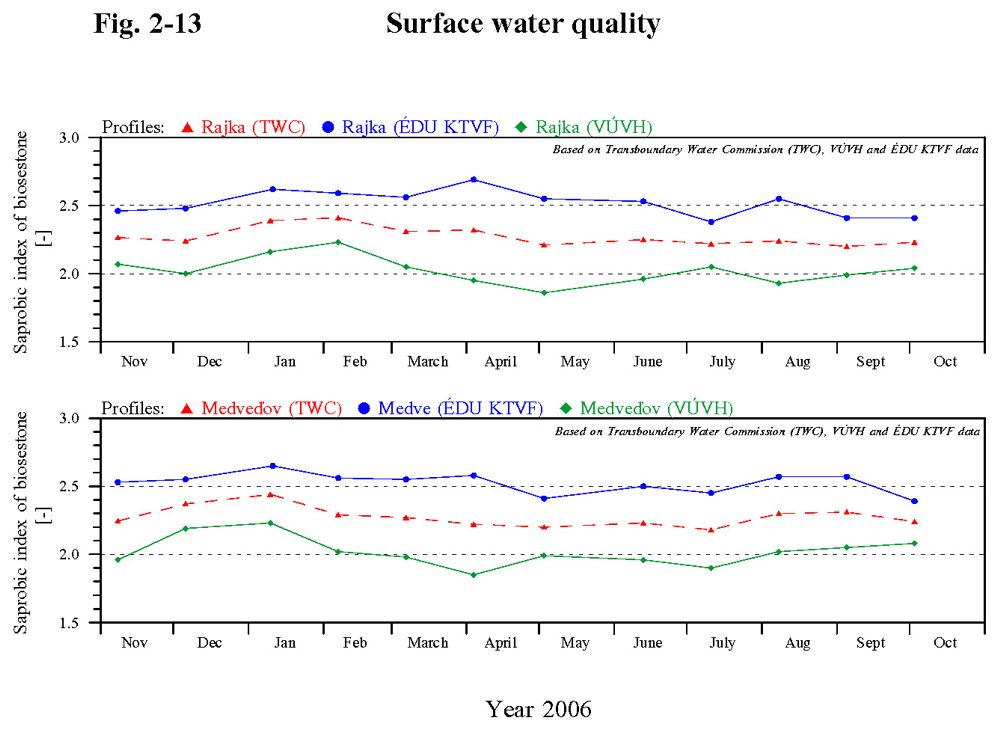
2.1. General evaluation of the actual hydrological yearThe hydrological year 2006 can be characterised as an ordinary year, and regarding the average annual discharge it can be classified as an water rich year. Average monthly discharges prevailingly exceeded the average values. The most water rich moth was April, September was the most dry. Flood waves occurred several times: the biggest one at the end of March (around 8000 m3s-1), at the end of April (more than 5000 m3s-1), at the beginning of June (exceeding 6000 m3s-1), and at the beginning of August (more than 7000 m3s-1). After the recession of the August flood the discharges fluctuated below the long-term average values till the end of the hydrological year. 2.2. Basic physical and chemical parametersWater temperature The water temperature fluctuation in the whole Danube stretch downstream of Čunovo follows the water temperature course observed in the Danube at Bratislava (sampling site No. 109). In the actual hydrological year the water temperature in the Danube fluctuated in the range from 0 to 25.4 °C. Maximal values occurred in July. Minimal values were measured in February and at the beginning of March. The water temperature in the reservoir fluctuated from 0.6 to 24.1 °C, and the maximal values were recorded in July as well. The water temperature in the seepage canal was different, just as in previous years. In the winter period (till March) it was warmer (by 2-6 °C), and in the summer period (from June to September) it was cooler (by 2-3 °C), except the only value of 26.5 °C recorded in July in the right side seepage canal. The water temperature in the Mosoni Danube at Čunovo sampling site was similar to the water temperature in the Danube, at Vének sampling site it was warmer and it fluctuated from 1.4 to 25.1 °C. The temperatures recorded in the river branch system followed the temperatures in the Danube main riverbed and throughout the year they fluctuated from 0 to 23.3 °C. pH Higher values of pH occur in seasons corresponding to periods of increased assimilation activity of phytoplankton. The Danube water pH values in the hydrological year 2006 fluctuated in the range from 7.32 to 8.27. Higher values occurred particularly during the algae growth (November 2005, June-July 2006 and September-October 2006). The pH values in the reservoir fluctuated between 7.67-8.49. The situation at sampling sites in the reservoir (sites No. 307, 308, 309, 311) differs from that in the Danube water, particularly in the summer period, when the pH values changed in leaps. These leaps are probably connected to rapid water temperature changes, changes in phytoplankton abundance and chlorophyll content, and variation in flow velocity. The pH values in the river branch system fluctuated from 7.2 to 8.42. In the seepage canal they varied from 7.45 to 8.02. The pH values in the Mosoni Danube downstream of the intake structure at Čunovo fluctuated between 7.8 and 8.2, and upstream of the confluence with the Danube at Vének fluctuated between 7.3-8.1. Specific electric conductivity The specific electric conductivity of the surface water refers to the dissolved salts content of mineral origin. The course of specific conductivity in the Danube in the hydrological year 2006 followed the conductivity values at the Bratislava profile (No. 109). The conductivity values fluctuated between 30.7 and 60.9 mS.m-1. The conductivity in the reservoir was similar, but in the winter period no higher values was recorded because the reservoir was frozen over and no samples were taken in January and February. Salinity increased from November to March, subsequently gradually decreased and the minimal values occurred from June to August. At sites on the Danube observed by the Hungarian side the minimum values were already registered in April. Towards the end of the hydrological year it started to increase again. The course of specific conductivity and conductivity values in the Mosoni Danube at Čunovo sampling site were similar to that in the Danube water. The situation at Vének profile differed. In comparison with the other sampling sites the dissolved solids content was slightly higher, due to the loads coming from the waste water. The conductivity values fluctuated in the range from 31.2 to 68.8 mS.m-1. The dissolved solids content in seepage canals was stable. The electric conductivity values, similarly to the previous years, fluctuated in an narrower range from 39.1 to 52.0 mS.m-1. The specific electric conductivity at selected sampling sites is documented in Fig. 2-3. Suspended solids The suspended solids content is closely related to the flow rate. It increases at flood waves. In the hydrological year 2006 the suspended solids content in the Danube water varied from 3 to 386 mg.l-1. Higher values in March, April, June and August were connected with higher flow rates in these months (Fig. 2-4). The highest values occurred at the beginning of August at Rajka - 386 mg.l-1, and Medveďov - 309 mg.l-1. When analysing the changes in the suspended solids content and taking into account the average values at individual sampling sites in the Danube main riverbed it can be stated, that the suspended solids content downstream of reservoir (at Medveďov) is lower than in the Danube at Bratislava, which shows the sedimentation effect of the reservoir. The suspended solids content in the reservoir reached mainly values up to 70 mg.l-1, except two higher values at sampling site No. 307 in May (117 mg.l-1) and at sampling site No. 308 in December 2005 (89 mg.l-1). The suspended solids content in seepage canals, regarding the origin of water, was low and it fluctuated from 4 to 23 mg.l-1. The suspended solids in the river branch system varied between 9,5 and 90 mg.l-1, except one value of 162 mg.l-1 at Helena sampling site in April 2006. In the Mosoni Danube, both at Čunovo and Vének sampling sites the content of suspended solids fluctuated from 7 to 58 mg.l-1, except one higher value at Čunovo during the flood wave in August, when it reached 220 mg.l-1. Basic physical and chemical parameters - summary The basic physical and chemical parameters in the Danube and in the river branch system connected to the Danube main riverbed show seasonal variations and some of them predominantly depend on the flow rate. The fluctuation of basic physical and chemical parameters in the Mosoni Danube and in the seepage canal reflects the different characteristics of these water bodies. The water quality in the Mosoni Danube is influenced by the Danube water and at Vének sampling site by its affluents and waste water from Győr. The water in the seepage canal is influenced mainly by the leaking ground water. No significant changes in the water quality were recorded in the hydrological year 2006 in comparison with the previous year. The suspended solids content in comparison with the previous year reached slightly higher values, which was connected with higher flow rates in the hydrological year 2006 in comparison with 2005. 2.3. Cations and AnionsThe quantitative ratio of the surface water ionic composition throughout the hydrological year 2006 showed high stability, just as in previous years. The seasonal fluctuation of individual ions content followed the changes in salinity. Changes of the dissolved solids content are related to the flow rate fluctuation in the Danube. Compared to the long-term measurements the values of basic cations and anions have not changed. In case of sodium and chlorides, at some of sampling sites in case of potassium and sulphates as well, long-term maximal values were recorded. In case of calcium at most of Hungarian monitoring sites maximal values since 1992 were registered as well. The most stable ionic content was characteristic for the seepage water. Higher concentration of cations (sodium, potassium, calcium and magnesium) , anions (chlorides and sulphates) and dissolved solids content was registered in the Mosoni Danube at Vének, due to its affluents and cleaned waste water from Győr. 2.4. NutrientsNitrates Nitrate concentrations in the hydrological year 2006 at all monitoring sites in the Danube and in the right-side river branch system showed seasonal fluctuation. During colder period higher concentrations were registered, after warming up lower values occurred. In comparison to the year 2005 a slight increase of maximal values was observed. In the reservoir in case of annual maximal values a slight decrease was registered. Nitrate values mainly fluctuated in the range from 2.0 to 16.4 mg.l-1. The lowest nitrate concentrations were characteristic for the seepage water, where nitrate content varied from 3.2 to 9.1 mg.l-1. In the Mosoni Danube the nitrate concentration at Vének reached high values, and in comparison with previous year significantly increased (in 2005 they were lower than in the Danube). The nitrates content fluctuated from 6.2 to 20.2 mg.l-1 (Fig. 2-5). Ammonium ion The ammonium ion contents in 2006 were lower in comparison with the previous year and they varied in a narrower range. Higher concentration occurred in period with colder water (Fig. 2-6). Significant decrease in comparison with the previous year was registered in the Danube (particularly at Bratislava – sampling site No. 109), moderate decrease was recorded in the river branch system, in seepage canals and in the Mosoni Danube. The concentrations varied from 0.013 to 0.25 mg.l-1. In the reservoir the ammonium ion content slightly increased and fluctuated in a range from 0.013 to 0.37 mg.l-1. The lowest ammonium ion concentrations were recorded in the seepage canals, where it fluctuated from 0.02 to 0.14 mg.l-1. The highest contents were recorded in the Mosoni Danube at Vének (sampling site No. 1141), where they varied from 0.03 to 0.54 mg.l-1, similarly as in the previous year. Seasonal variation at this sampling site was not proved. Compared to previous years and from the long-term point of view the ammonium pollution at Vének significantly decreased. Nitrites The nitrite ion concentrations are considered as a temporary product of nitrification and denitrification processes. Their concentrations in the Danube, in the Mosoni Danube at Čunovo and in the river branch system showed a seasonal variation and their course was similar. The concentrations varied in the range from 0.01 to 0.15 mg.l-1. One higher value was recorded in the Mosoni Danube at Čunovo sampling site in March 2006 – 0.28 mg.l-1. Higher values during the hydrological year 2006 occurred in the Mosoni Danube at Vének sampling site, where they varied from 0.06 to 0.15 mg.l-1 and they course had not a seasonal character. The lowest nitrite concentrations were recorded in the seepage canals and they mainly varied between 0.01 and 0.06 mg.l-1, except one value 0.15 mg.l-1 in the left side seepage canal recorded in October 2006. Total nitrogen The total nitrogen content is predominantly affected by the fluctuation of the nitrate-nitrogen and organic-nitrogen concentrations, which results from the quantitative ratio of nitrogen forms. The tendency of fluctuations of the total nitrogen in 2006 in the Danube, in the Mosoni Danube and in the right side river branch system was similar at all sampling sites – Fig. 2-7. In comparison to the Danube water was the total nitrogen content in the Mosoni Danube at Vének profile slightly higher and fluctuated in the range from 2.12 to 5.31 mg.l-1, with one higher value of 9.8 mg.l-1 in August 2006. The maximal concentrations were registered in March. The total nitrogen concentrations in the Danube fluctuated from 1.21 to 4.37 mg.l-1. In the right side river branch system and in the Mosoni Danube at Čunovo the total nitrogen content varied from 1.81 to 3.81 mg.l-1. The lowest amount of total nitrogen was found in the seepage water, where the concentrations varied from 0.98 to 2.48 mg.l-1. Phosphates In the hydrological year 2006 slightly higher values of phosphates content in comparison with the previous year were recorded almost at all sampling sites. No changes were registered in the left side seepage canal (sampling site No. 317) and at Vének on the Mosoni Danube (sampling site No. 1141). Higher phosphates content was characteristic for colder months and during flood waves on the Danube, the lowest values were recorded during summer months. The phosphate concentrations in the Danube fluctuated from 0.03 to 0.28 mg.l-1. One July value at sampling site No. 109 reached 1.72 mg.l-1. The phosphate concentrations in the right side river branch system varied from 0.02 to 0.32 mg.l-1, with one value of 0.47 mg.l-1 measured in March at Helena sampling site. The situation in the reservoir was different in comparison with the previous year. In February, March and August higher values were recorded, which was connected with flood waves, and the concentrations fluctuated from 0.03 to 0.37 mg.l-1. The phosphate content in the Mosoni Danube at Čunovo sampling site fluctuated in the range from 0.08 to 0.25 mg.l-1. At the Vének profile the phosphates content was higher in comparison to the Danube water and varied from 0.25 to 0.52 mg.l-1. The lowest phosphate concentrations occurred in the seepage canals (from 0.03 to 0.12 mg.l-1). In general higher values of orthophosphates concentrations occur in the winter period, lower values are characteristic for the vegetation period. Total phosphorus Concentration changes of the total phosphorus followed the seasonal changes of phosphates concentration. The maximal values in hydrological year 2006 were higher than in 2005. They occurred mainly during flood waves (in April and August, somewhere also in February), because the phosphorus fixed to the suspended solids increased its concentration in the water. The total phosphorus content in the Danube and in the Mosoni Danube at Čunovo sampling site mainly varied in the range from 0.04 to 0.46 mg.l-1. The total phosphorus concentration values in the reservoir varied from 0.03 to 0.20 mg.l-1, and were lower than in the year 2005. In the right side river branch system (Hungarian side) they varied from 0.05 to 0.38 mg.l-1, contrary to the values recorded in the left side river branch system (Slovak side), where they reached maximally 0.13 mg.l-1. In the seepage canals the total phosphorus content was balanced and low: 0.02 to 0.07 mg.l-1. The concentrations of the total phosphorus in the Mosoni Danube at Vének sampling site, which always reach higher values in comparison to the other sampling sites, in the year 2006 decreased and varied from 0.16 to 0.29. Nutrients - summary The individual nitrate forms show a seasonal fluctuation. In the hydrological year 2006 it is not valid for ammonium ion, which fluctuated a lot throughout the year at most of the sampled profiles. Seasonal fluctuation of individual parameters results from biochemical processes in the water, which are temperature dependent. Generally, decreasing tendency of pollution continues, particularly at the most polluted sampling site at Vének on the Mosoni Danube. The lowest and the most balanced nutrient values can be found in the seepage water, which results from its groundwater origin. Compared to the hydrological year 2005 it can be stated that in 2006 in case of nitrates, phosphates and total phosphorus higher maximum values were recorded. In case of the ammonium ion the maximal values decreased. The nutrient content in the Danube water is potentially sufficient for development of eutrophic processes under other suitable conditions. 2.5. Oxygen regime parametersDissolved oxygen The dissolved oxygen content proportionally decreases with increasing water temperature. The highest values mainly occur in February and March. Besides this the dissolved oxygen content depends on the assimilation activity of phytoplankton. In the hydrological year 2006 the dissolved oxygen content at most of the monitored sites showed a seasonal character. In the river branch system and in the reservoir its content throughout the year varied. The dissolved oxygen concentration at most of the sampled sites fluctuated from 7.7 to 14.1 mg.l-1, in the seepage canal it varied from 4.8 to 12.5 mg.l-1, and in the Mosoni Danube at Vének it varied from 6.6 to 13.4 mg.l-1. Lower values were recorded during summer months. The dissolved oxygen fluctuation at selected sampling sites is documented on Fig. 2-8. CODMn and BOD5 CODMn and BOD5 parameters are used for expressing the organic contamination of the water, they indicate the chemically and biologically degradable organic matter content. Higher values of CODMn and BOD5 usually occur at periods with higher flow rates in the Danube, when the water contains higher amount of natural organic matter. In the hydrological year 2006 the CODMn values at all measured profiles on the Danube, in the Mosoni Danube at Čunovo and in the river branch system fluctuated in the range from 1.5 to 6.7 mg.l-1. In April three higher values were registered: 10.1 mg.l-1 at sampling site No. 0042 downstream of the bottom weir, 7.5 mg.l-1 upstream of the bottom weir (sampling site No. 0043) and 7.9 mg.l-1 at Helena sampling site in the river branch system (No. 1112). The CODMn values in the reservoir varied from 1.3 to 4.8 mg.l-1. At the Vének profile were the CODMn values higher in comparison to the other observed sites and varied in the range from 2.8 to 8.0 mg.l-1. Compared to the hydrological year 2005 the pollution at this sampling site slightly increased. The organic matter content in the seepage canal is low in long term and in 2006 the CODMn values fluctuated from 0.8 to 2.2 mg.l-1 – Fig. 2-9. The BOD5 values at the Danube sampling sites varied in the range from 0.1 to 4.2 mg.l-1. Comparing the values measured by the Slovak and Hungarian Parties it have to be stated that there still persist significant differences (Fig. 2-9). In the right side river branch system the BOD5 values varied in the range from 0.2 to 5.5 mg.l-1, while at sampling site in the left side river branch system the BOD5 fluctuated in a narrower range from 0.85 to 2.5 mg.l-1. The BOD5 values in the reservoir fluctuated in the range from 0.9 to 2.8 mg.l-1, with two higher values recorded in May at sampling site No. 308 (3.8 mg.l-1) and sampling site No. 311 (4.1 mg.l-1). In the seepage canals they ranged from 0.6 to 3.1 mg.l-1 (in the left side seepage canal observed by the Slovak arty only up to 1.1 mg.l-1). In the Mosoni Danube at Čunovo sampling site the BOD5 values varied from 1.0 mg.l-1 to 3.4 mg.l-1. The highest organic pollution throughout the year is characteristic for the Mosoni Danube at Vének, where the BOD5 values fluctuated from 0.7 to 5.1 mg.l-1. Oxygen regime and organic carbon parameters - summary The dissolved oxygen content remained preserved on the level of previous years. A slight increase was connected with the winter floods. After a temporary slight increase in 2001-2002 the CODMn values decreased, in the years 2003-2005 fluctuated below the long-term average and in 2006 a slight increase was recorded at most of the sampled sites. The BOD5 values in 2006 remained at the same level as in 2005, at some sampling sites slightly increased, at others slightly decreased. Considering this parameter significant differences between Slovak and Hungarian values continues, at jointly observed sampling sites as well. The oxygen regime parameters in the Danube reflect the seasonal assimilation activity of the phytoplankton and organic carbon oxidation processes. The measured data (1992-2006) indicate decreasing tendency of organic load at the Bratislava section of the Danube, which is related to the substantial waste water treatment improvement in the upstream Danubian countries. From the organic pollution point of view the less polluted water is the seepage water. The most polluted is the sampling site at the mouth of the Mosoni Danube at Vének, due to the waste water load originating from the city of Győr together with hydrological conditions at confluence with the Danube. 2.6. MetalsIron The amount of suspended solids influences the iron content in the surface water. The suspended solids content follows the flow rates therefore higher iron content occurred in samples taken during flood waves. The iron concentrations in hydrological year 2006 in the Danube fluctuated in the range from 0.08 to 9.34 mg.l-1. Values exceeding 1 mg.l-1 were recorded during flood waves in April and August, so two values at seven sampling sites (Fig. 2-11). The rest of values varied up to 0.77 mg.l-1. In the right side river branch system the iron concentrations fluctuated in the range from 0.07 to 3.3 mg.l-1. In the reservoir the iron content varied from 0.09 to 0.8 mg.l-1. In the Mosoni Danube at Čunovo one high value occurred in August, other values fluctuated from 0.13 to 0.65 mg.l-1. At the Vének sampling site the iron concentrations varied in the range from 0.35 to 2.0 mg.l-1. The lowest iron concentrations were characteristic for the seepage water, where they fluctuated from 0.04 to 0.49 mg.l-1. Manganese Manganese in surface water occurs mainly in a solid phase. The manganese content, similarly to iron, increased during flood waves, corresponding with higher amount of suspended solids. The manganese concentrations in the Danube mostly fluctuated in the range from 0.02 to 0.63 mg.l-1. The manganese concentrations in the Mosoni Danube at Čunovo sampling site reached values up to 0.26 mg.l-1, at Vének sampling site up to 0.44 mg.l-1. In the right side river branch system the manganese content in 2006 varied from 0.02 to 0.83 mg.l-1; in the left side river branch system it fluctuated up to 0.06 mg.l-1. The lowest manganese content occurred in the seepage water and it varied in the range from 0.01 to 0.24 mg.l-1. Heavy metals The joint monitoring from among heavy metals includes observation of zinc, mercury, arsenic, copper, chromium, cadmium and nickel contents. The courses of heavy metal concentrations in the hydrological year 2006 were similar as in previous year, in some cases they were lower, which is obviously connected with the fact, that heavy metal content started to be determined from filtered samples. Throughout the year several high values occurred, which were connected with flood waves, The highest values were recorded in August samples. Concentrations of mercury mostly varied below the detection limit of the analytical method used. An exception was the Danube old river bed, where the mercury content fluctuated up to 0.39 µg.l-1, and one higher value (0.26 µg.l-1) was recorded in the Ásvány river branch. Cadmium concentrations were mostly below the detection limit, except the sampling sites in the right side river branch system and in the Mosoni Danube at Vének, where they fluctuated up to 0.9 µg.l-1. The chromium content was low at all observed sampling sites. Lot of values were below the detection limit. Higher values occurred in the reservoir – up to 0.98 µg.l-1 and in the Danube at Dunaremete – up to 2.0 µg.l-1, with one extremely high value of 10.4 µg.l-1 recorded in August 2006. Arsenic concentrations determined by the Hungarian Party were below the detection limit. At sampling sites observed by the Slovak Party the arsenic content in the reservoir in February and in the Danube old river bed in August varied up to 5.41 µg.l-1. Nickel content in 2006 reached values up to 3.6 µg.l-1, with three higher values measured in the reservoir in August (4.65 and 6.35 µg.l-1) and in the Danube old river bed upstream of the bottom weir at Dunakiliti in October (6.3 µg.l-1). The highest concentrations from among the heavy metals were recorded for copper and zinc. The copper concentrations mostly fluctuated up to 12.8 µg.l-1. Extremely high values were recorded in the Szigeti (21.5 µg.l-1) and Ásványi river arms (21.1 and 44.5 µg.l-1). Similarly high values in the right side river branch system were registered for zinc: in the Szigeti river arm 50.4 µg.l-1, in the Ásványi river arm – 41.5 µg.l-1. In summary it can be stated that heavy metal concentrations were low during the hydrological year 2006 and lot of values were lower than the detection limits of the analytical methods used. The zinc was present in the highest concentrations, followed by copper, nickel, chromium, arsenic, cadmium and mercury. The detection limits of the individual heavy metals often correspond to the II. or III. classes of surface water quality, in case of zinc to the IV. quality class. 2.7. Biological and microbiological parametersColiform bacteria The number of Coliform bacteria can determine the surface water bacteriological pollution. In the hydrological year 2006 a slight decrease of number of Coliform bacteria at sampling sites observed by the Slovak Party, registered since 2004, continued. At sampling sites monitored by the Hungarian Party the situation differs. The number of Coliform bacteria remains at the same level or slightly increases. The number of Coliform bacteria in the Danube mainly varied up to 62 NrC.ml-1. In August high values were recorded at each sampling sites. The highest number of Coliform bacteria – 343 NrC.ml-1 was recorded at Rajka, at Dunakiliti upstream of the bottom weir – 300 NrC.ml-1 and downstream of the bottom weir – 280 NrC.ml-1. The values at Bratislava, Dunaremete, Medveďov and Komárno were lower. In the reservoir the number of Coliform bacteria varied from 1 to 46 NrC.ml-1. The situation in the Mosoni Danube at the Čunovo sampling site is similar to that in the Danube. The bacteriological pollution of the river branch system in 2006 reached the highest values in August at Helena sampling site (290 NrC.ml-1) and in the Szigeti river arm (200 NrC.ml-1). Remaining values fluctuated up to 57 NrC.ml-1. Similarly to the previous year improvement in microbiological pollution was observed along the flow path in the right side river branch system downstream of influent section. The seepage canals can be considered as the cleanest from the bacteriological point of view, the number of bacteria ranged up to 8 NrC.ml-1. Since introducing the reconstructed and extended waste-water treatment plant into operation significant decrease of number of Coliform bacteria was registered at the most polluted sampling site in the Mosoni Danube at Vének. The number of Coliform bacteria in 2006 varied from 9 to 400 NrC.ml-1 and compared to the previous year it was significantly lower. Chlorophyll-a The chlorophyll-a concentrations refer to the quantity of phytoplankton and provide information about the eutrophic state of water. The growth of algae on the respective section of the river is represented by relative increase of chlorophyll-a concentration between two compared profiles. In the hydrological year 2006 contents of chlorophyll-a decreased in the Danube water. Higher values in the Danube and in the Mosoni Danube were registered at the beginning of the hydrological year, so in November 2005. In December the chlorophyll-a content decreased and during the winter month was low. Considering the longer winter period the steep increase of chlorophyll-a content was registered at the end of April and the culmination was recorded in June at the most of sampling sites (Fig. 2-12). In the Danube old river bed in May. The spring algae growth occurred from April to July and the maximal values reached 42.6 mg.m-3 (sampling site No. 4016). The situation in the reservoir differs from the sampling sites on the Danube. The variability of mass development of phytoplankton and the culmination of chlorophyll-a content at individual sampling points in the reservoir is related to the local hydrological and climatic conditions. The chlorophyll-a content in the reservoir was higher compared to the Danube water and varied up to 75,2 mg.m-3. The highest values were registered during sampling in May. Another waves of culmination occurred in June, July and September. In the right side river branch system three waves of culmination occurred (February, April-May and October). However at Helena sampling point they were not so noticeable. The chlorophyll-a concentrations varied in the range from 2 to 46.2 mg.m-3. The maximum values were significantly lower than in 2005. The highest chlorophyll-a values were registered in June, at Helena sampling site in May. The amount of chlorophyll-a in the Mosoni Danube at the Vének profile was much more lower than in the previous year. This can be connected to the reconstruction and extension of the waste-water treatment plant at Győr. Values varied from 2.4 to 19.5 mg.m-3 (in 2005 they varied up to 97.1 mg.m-3). The chlorophyll-a concentration in the seepage water remained low and varied from 2 to 12.7 mg.m-3. Saprobic index of biosestone The saprobic index represents the self-purification ability of water, the ability to degrade organic pollution. The saprobic index in relation to the respective stretch of river also represents the water quality in the river. The saprobic index of biosestone at sampling sites observed by the Hungarian Party in the hydrological year 2006 reaches higher values, and fluctuates in the range from 2.3 to 2.84. They correspond to the alpha-beta-mezosaprobic state. Similar values were recorded in the right side river branch system as well (2.35-2.7). The saprobic index in the left side river branch system observed by the Slovak Party varied in the range from 1.7 to 2.19, which correspond to the beta-mesosaprobic state. The saprobic index values in the Mosoni Danube at Vének were lower in comparison with the previous year and varied in the range from 2.22 to 2.61 (in 2005 from 2.4 to 2.8). The saprobic index of biosestone at the other sampling site s on the Danube and Mosoni Danube fluctuated from 1.62 to 2.44. In the reservoir it varied from 1.55 to 2.28. In the seepage canals it fluctuated in a narrower range from 1.95 to 2.38, which correspond to the beta-mesosaprobic state, similarly as in the Danube. The self-purification processes at this level of the saprobic index run mainly as oxidising processes. Time series data of saprobic index of biosestone in the Danube water indicate slightly decreasing tendency. The differences between Hungarian and Slovak values at jointly sampled profiles at Rajka and Medveďov are documented in Fig. 2-13. Other biological parameters Phytoplankton Values of the phytoplankton abundance in the hydrological year 2006 at sampling sites in the Danube varied from 370 to 13666 NrC.ml-1. Low values of the phytoplankton abundance occurred in January, April and August, minimum 370 NrC.ml-1 was registered at Medveďov (sampling site No. 112) in April. High values of phytoplankton abundance were recorded already at the beginning of the hydrological year in November 2005, when the maximal abundance 13666 NrC.ml-1 at Rajka (sampling site No. 1203) was recorded as well. Another waves of algae growth occurred in February-March, June-July and at the end of hydrological year in October 2006. In the reservoir the phytoplankton abundance fluctuated from 46 individuals of algae in 1 ml (In.ml-1) up to 12610 In.ml-1. The highest value was recorded at sampling site No. 309, and it was significantly lower than in the previous year (20378 In.ml-1 in 2005). The amount of phytoplankton in Mosoni Danube at Čunovo followed the changes in the Danube. The high values recorded in the previous year at the Vének profile were not proved in 2006. The algae growth at this sampling site was partly influenced by the hydro-morphological characteristic, which differ from those in the upper section, and partly by nutrients delivered by the treated waste-water from the city of Győr. In 2006 the highest abundance of phytoplankton were recorded in the right side river branch system. Significant algae growth was registered in June, when the maximal value in the Szigeti river arm reached 26437 NrC.ml-1 and in the Ásványi river arm 16132 NrC.ml-1. Low abundance of phytoplankton throughout the year was characteristic for the seepage water, when it ranged from 100 to 1258 NrC.ml-1, with one higher value of 4464 NrC.ml-1 in July 2006. The total abundance of phytoplankton was lower in comparison with the previous years at most of the sampling sites (an exception were the sampling sites in the right side river branch system). This could be explained by different climatic conditions in 2006, when the second half of the summer (August and part of September) was slightly colder and more rich in precipitation. The autumn was longer, dry and sunny, which was reflected in the algae growth as well. In the spring the Chrysophyceae, Cryptophyceae, Bacillariophyceae and Volvocales dominated in the phytoplankton in the Danube water. In the summer period Chlorophyta and Cyanophyta taxons were increasing, while during the autumn they continuously decreased and the diatoms (Bacillariophyceae) remained. From among the Bacillariophyceae – Centrales the Aulacoseira, Cyclotella, Skeletonema, Cyclostephanos and Stephanodiscus families, from among the Bacillariophyceae – Pennales the Cymbella, Diatoma, Gomphonema, Fragilaria, Naviculla and Nitzschia families and from among the Chlorophyta the Actinastrum, Coelastrum, Dictyosphaerium, Monoraphidium, Pediastrum, Planktospheria, Scenedesmus, Tetraedron and Tetrastrum families dominated in the phytoplankton. In 2006 lower amount of Cyanophyta were registered in comparison with the year 2005. Considering the qualitative composition of phytoplankton at sampling sites in the reservoir and in the Danube old river bed the Bacillariophyceae – Centrales were dominant. The composition of phytoplankton in the river branch system was similar to the composition found in the Danube, however, higher species diversity was characteristic. In the Mosoni Danube in the stretch downstream of Győr eutrophic species were more abundant. The species composition in seepage canals was the poorest in species diversity and in abundance as well. Zooplankton In 2006 the zooplankton was not examined in the frame of boundary waters, so the results from Hungarian National Annual Report (data from six sampling cycles) and Slovak National Annual Report (data of the Water Management Authority from 12 sampling cycles) were used for evaluation. Based on the Slovak data it can be stated that considering the seasonal dynamics the highest values of abundance at most of sampled sites were recorded in May and July, the lowest values in March and April. The seasonal dynamics reflected the climatic conditions in 2006, which were characterised by temperatures above the average in May, June and July, subsequently followed by colder period in August and at the beginning of September, which was rich in precipitation. Long lasting warm autumn enabled the development of zooplankton also in this period. The average value of zooplankton abundance at observed sampling sites fluctuated from 100 to 21000 individuals in 100 litres (In/100 l). The number of individuals unambiguously increased along the longitudinal profile of the Danube in this year as well. The highest abundance was recorded in August at Medveďov (sampling site No. 112). The highest abundance in the reservoir throughout the year was registered at sampling site No. 308 at Kalinkovo, the maximal value was 19800 In/100 l (sampled in September). Compared to the previous two years (2004 and 2005) the abundance value were significantly lower, which can be explained by building works in this part of the reservoir. Contrary to the others sampling sites the maximal values in the reservoir occurred in August and September. Lower abundance values were registered at sampling sites No. 307 and 309 as well. Only at sampling site No. 311 at Šamorín an increase was observed. Species from the Rotatoria group considerably dominated throughout the year. In comparison with the previous years the portion of Copepoda group significantly increased, particularly in seepage canals. According to the species composition of individual groups of zooplankton species of Keratella, Brachionus and Polyarthra families were the most important from among the Rotatoria group. At several sampling sites species of Filinia, Trichocera and Asplanchna families as well. From among the Cladocera group the species of Daphnia and Bosmina families dominated, and in case of Copepoda group species of the Cyclopidae family in juvenile stage were the most frequent. In the right side river branch system (Hungarian side) the zooplankton species composition and abundance in the hydrological year 2006 was similar as in 2005. The seasonal dynamics of abundance was almost the same as in previous years, with a maximal occurrence in June or July. In the lower part of the Ásványi river branch system very dense communities has developed due to the slowly moving water. The abundance values were high, but they were lower than in previous years. The abundance in the river branches in the upper part of Szigetköz was lower throughout the year, due to higher flow velocity. The total number of individuals in the right side river branch system in 2006 fluctuated from 103 to 401 In/100 l at Helena sampling site, from 154 to 454 In/100 l in the Szigeti river arm, and from 174 to 615 In/100 l in the Ásványi river arm. In the species composition the species of Keratella, Brachionus and Polyarthra families from among the Rotatoria group, species of Bosmina family from among the Cladocera group, and juvenile species of the Copepoda group were dominant in the river branch system. Based on the observation results in the Mosoni Danube it can be stated that in 2006 there was only slight increase in abundance of zooplankton along the longitudinal profile of the river and no big communities developed at Vének as well, contrary to previous years. The species composition and the occurrence of rare species was similar as in years 2004-2005. Macrozoobenthos The faunistic results of aquatic macroinvertebrate communities in the Danube and reservoir remained very similar to those of previous years. At the monitored sampling sites in the Danube the species of Mollusca and Malacostraca groups were the most abundant. At the majority of sampling sites mostly species of aquatic molluscs typical for the Danube occurred (Ancylus fluviatilis, Corbicula fluminea, Dreissena polymorpha, Theodoxus danubialis, Theodoxus fluviatilis, Esperiana acicularis, Esperiana esperi). Besides species typical for this stretch of the Danube several species of Bivalvia and Gastropoda typical for large river occurred (Unio pictorum and Viviparus acerosus at Komárno, and Lithoglyphus naticoides at Rajka, Dunaremete, Medveďove and Komárno). Malacostraca were represented by species Corophium curvispinum, Dikerogammarus haemobaphes, Dikerogammarus villosus, Dikerogammarus bispinosus, Jaera istri, Obesogammarus obesus, Limnomysis benedeni, Pontogammarus obesus. At Bratislava and Rajka sampling sites the species Echinogammarus ischnus occurred as well. From among the insects the species of Chironomidae family were the most abundant. At many sampling sites species of Ephemeroptera and Annelida families (mainly Hypania invalida, Oligochaeta gen. sp. and Dina punctata) occurred as well. The experiences and results obtained in the right side river branch system prove that the existing biotopes are large water bodies with extremely complicated structure. The river branch system in the inundation area contains many invertebrate species of different kind of biotopes and different kind of ecological demands. The water supply is convenient and satisfies most of the demands. The lower part of the river branch system slightly differs from the stretches upstream because of slowly flowing water. The most abundant species in the river branch system were Oligochaeta gen. sp., Chironomidae gen. sp., Ceratopogonidae gen. sp., Corophium curvispinum, Dikerogammarus haemobaphes, Hypania invalida, Sialis lutaria, Jaera istri, Pisidium hensiowanum. To the dominant taxons of macrozoobenthos in the reservoir in 2006 belonged Limnodrilus sp., Lumbricidae g. sp. div., Corophium curvispinum, Dikerogammarus villosus, Hypania invalida, Pisidium sp., Chironomus sk. reductus. At sampling site No. 308 at Kalinkovo the species Micronecta minutissima, Nais sp., Potamopyrgus antipodarum and Cricotopus sp. occurred abundantly as well. The saprobic index values of macrozoobenthos in the longitudinal profile of the Danube from Bratislava to Komárno correspond to beta-mezosaprobic state, which is typical for this stretch of the river. The average saprobic index values in 2006 varied from 1.87 to 2.45. The maximal value 2.45 was recorded at Medveďov during the spring and according to the agreed limits for water quality classification (Tab. 2-2) corresponds to the III. class of surface water quality. The other remaining values belong to the II. water quality class. Contrary to the previous year improving of saprobic index values were registered in the Danube water. The saprobic index in the reservoir varied in the range from 2.08 to 2.96. The surface water in the reservoir according to the agreed limits belongs to a range from the II. to the IV. water quality class, what correspond to an beta-mezosaprobic or alpha-mezosaprobic state. The other aspects of development of macrozoobenthos communities are evaluated in Part 7 – Biological monitoring, where more detailed evaluation for Cladocera, Copepoda, Mollusca, Odonata, Ephemeroptera and Trichoptera can be found. In general the macrozoobenthos communities have not changed significantly in comparison with the previous year. 2.8. Quality of sedimentsIn the hydrological year 2006, similarly to the previous year, the Slovak and Hungarian Parties have realized unified evaluation of sediment quality according to the “Canadian Sediment Quality Guideline for Protection of Aquatic Life” (CSQG) published in 1999, revised in 2002. The sediment sampling in the frame of the Joint Monitoring by the Slovak Party was carried out in September 2006. The Hungarian Party sampled the sediments twice, in May and in September. The situation of sampling sites is shown on Fig. 2-2. Besides the inorganic and organic micro components the total phosphorus and total nitrate content were analysed. From among the inorganic micropollutants seven heavy metal were analysed: zinc, mercury, cadmium, chromium, lead, copper, arsenic (only by the Slovak party), and nickel (only by the Hungarian Party). According to the “Canadian Sediment Quality Guideline for Protection of Aquatic Life” the content of heavy metals in sediments at observed sampling sites on the Slovak territory did not exceeded the limits of Probable Effect Level (PEL) in any case. When the content of some parameter exceeds the PEL level, unfavourable impact on biological life (more than 50 %) can by expected frequently. The concentrations of heavy metals in sediments were low. All measured values fluctuated closely to the Threshold Effect Level (TEL), when the unfavourable effect on biological life occurs rarely, in less than 25 %, and it corresponds to an uncontaminated natural environment. The sediments on the Hungarian territory were taken in the spring and in autumn. Contrary to the previous year the differences between the sampling in May and in September were not so considerable. In the case of copper, chromium and lead most of the values were below or fluctuated closely to the limit for Threshold Effect Level (TEL). In the spring sampling one exceeding of Probable Effect Level limit value occurred in case of mercury at Ásványi river branch. This sampling site appeared as the most polluted in 2006 from the point of view of inorganic micropollutants. During the autumn sampling two exceedings of PEL limit values were recorded. In case of cadmium upstream of the bottom weir and in case of mercury in the Mosoni Danube at Vének. Except the sampling site in the Ásványi river arm and in the Mosoni Danube at Vének the heavy metal concentrations at other sampling sites were low and fluctuated below or slightly over the limit values for Threshold Effect Level (TEL). From among the organic micropollutants the fluorine, dibenzo(a,h)anthracene, naphthalene, pyrene, acenaphtylene, acenaphtene, phenanthrene, anthracene, fluoranthene, benzo(a)anthracene, chrysene, benzo(a)pyrene were analysed on both sides. Moreover the lindan, heptachlorine, endrine and dieldrine were analysed on the Slovak side. The benzo(b+k)fluoranthene, indeno(1,2.3)pyrene and benzo(ghi) perylene were analysed on the Hungarian side, however these components have no TEL and PEL values specified in the CSQG. In case of the organic micropollutants the sediments on the Slovak and Hungarian sides in hydrological year 2006 did not exceeded the PEL level in any case. The recorded concentrations in most cases varied below the TEL level, when no unfavourable influences on the biological life are expected. Concentrations slightly exceeding the TEL level were recorded in few cases, which potentially could have ecotoxicological impact, but in general the measured values were low and in any case had not exceeded the half of the specified range. On the Hungarian side the total phosphorus and total nitrate content in sediments was analysed as well. The total phosphorus content during the spring sampling varied from 880 to 3013.4 mg.kg-1, during the sampling in autumn it varied from 219 to 1576 mg.kg-1,and the highest value was measured at Dunakiliti upstream of the bottom weir. The total nitrogen content during sampling in May reached values between 1735 and 5250 mg.kg-1. Its content in September varied between 1520 and 3800 mg.kg-1, and the highest value was measured in the Mosoni Danube at Vének. 2.9. Differences in the data measured by the Slovak and Hungarian PartiesThis chapter is dealing with differences between Slovak and Hungarian data in surface water quality parameters at jointly monitored sampling sites and with results reached in elimination of these differences. In the evaluation of the previous hydrological year a good concordance was reached in a major part of examined parameters. However, there still exist parameters where the individual values measured by one of the Parties were different. Based on the results achieved in the year 2006 it can be stated that differences where the individual values of parameters measured by one of the Parties are higher or lower than values determined by the other Party (e.g. pH, manganese, iron, phosphates, BOD5) still persist. In case of other parameters, like saprobic index, specific electric conductivity, ammonium, sulphates, chlorides, CODMn and Coliform bacteria, the course is similar, but the values are either higher or lower at one of the Parties. Samples are shown on Figs. 2-10 and Fig. 2-13. 2.10. ConclusionsBased on the long-term evaluation it can be stated, that the water quality in the Danube generally improved. Improvement of surface water quality was already observed at Bratislava profile (109), which represents the entering water quality. The better surface water quality consequently influences the water quality in the territory influenced by temporary measures, realised according to the Agreement. Compared to the previous period no significant changes in surface water quality were detected in the hydrological year 2006. Increased values of some parameters in the Danube were related to higher flow rates in the Danube occurring during flood waves. The fluctuation of water quality parameters in the right side river branch system follows their fluctuation in the Danube since introducing the water supply in 1995. The tributaries and local pollution of settlements, besides the water supply influence, form the water quality in the Mosoni Danube. Before its confluence with the Danube the water quality state is variable in time, which is proved by unfavourable values of some parameters (electric conductivity, dissolved solids, Coliform bacteria, CODMn, BOD5, nutrients and saprobic index). Compared to the previous years the water quality improved, thanks to investments realized in the water treatment plant. The amount of chlorophyll-a in the Mosoni Danube at Vének was significantly lower than in the previous year. The values fluctuated from 2.4 to 19.5 mg.m-3 (in 2005 they fluctuated up to 97.1 mg.m-3). The cleanest water was found in the seepage canals, which results from its groundwater origin. In the table Tab. 2-3 an orientational classification of selected sampling sites into the quality groups was done. The classification was done according to the trans-boundary water quality criteria given in “Surface water quality observation directive for Slovak-Hungarian boundary waters and for extended water quality monitoring on the Danube”. The quality classes are determined according to the 90 % durability of measured values (C90). This classification does not differentiate the specific conditions when the respective values were recorded (e.g. hydrological conditions – floods, high or extremely low flow rates, oscillation of parameters). The given orientational classification gives only a comparison of the water quality inflowing to the influenced area (sampling site at Bratislava) and the water quality leaving the influenced region (sampling site at Medveďov). The classification of the sampling sites in the Danube old riverbed and sampling sites in the Mosoni Danube, right side river branch system and in the seepage canal were done in a similar way. Part of the observed parameters shows a seasonal fluctuation, which consequently influences the categorisation into a water quality classes. In case that a range of classes are given (e.g. I-II) it represents natural seasonal fluctuation of individual parameters or dependence on climatic conditions. The water quality class in brackets means that the measured value of the respective parameter reached the given water quality class, but it occurred once, maximally two times in a hydrological year or during flood events. From the given table is clear, that the quality of water entering the hydropower system and the quality of water leaving the system is very similar or even slightly better. Table 2-3: Orientational classification of parameters or group of parameters according to the agreed limits for surface water quality classification
* all the data below the detection limit ** most of the data below the detection limit
|
|||||||||||||||||||||||||||||||||||||||||||||||||||||||||||||||||||||||||||||||||||||||||||||||||||||||||||||||||||||||||||||||||||||||||||||||||||||||||||||||||||||||||||||||||||||||||||||||||||||||||||||||||||||||||||||||||||||||||||||||||||||||||||||||||||||||||||||||||||||||||||||||||||||||||||||||||||||||||||||||||||||||||||||||||||||||||||||||||||||||||||||||||||||||||||||||||||||||||||||||||||||||||||||||||||||||||||||||||||||||||||||||||||||||||||||||||||||||||||||||||||||||||||||||||||||||||||||||||||||||||||||||||||||||||||||||||||||||||||||||||||||||||||||||||||||||||||||||||||||||||||||||||||||||||||||||||||||||||||||||||||||||||||||||||||||||||||||||||||||||||||||||||||||||||||||||||||||||||||||||||