PART 1
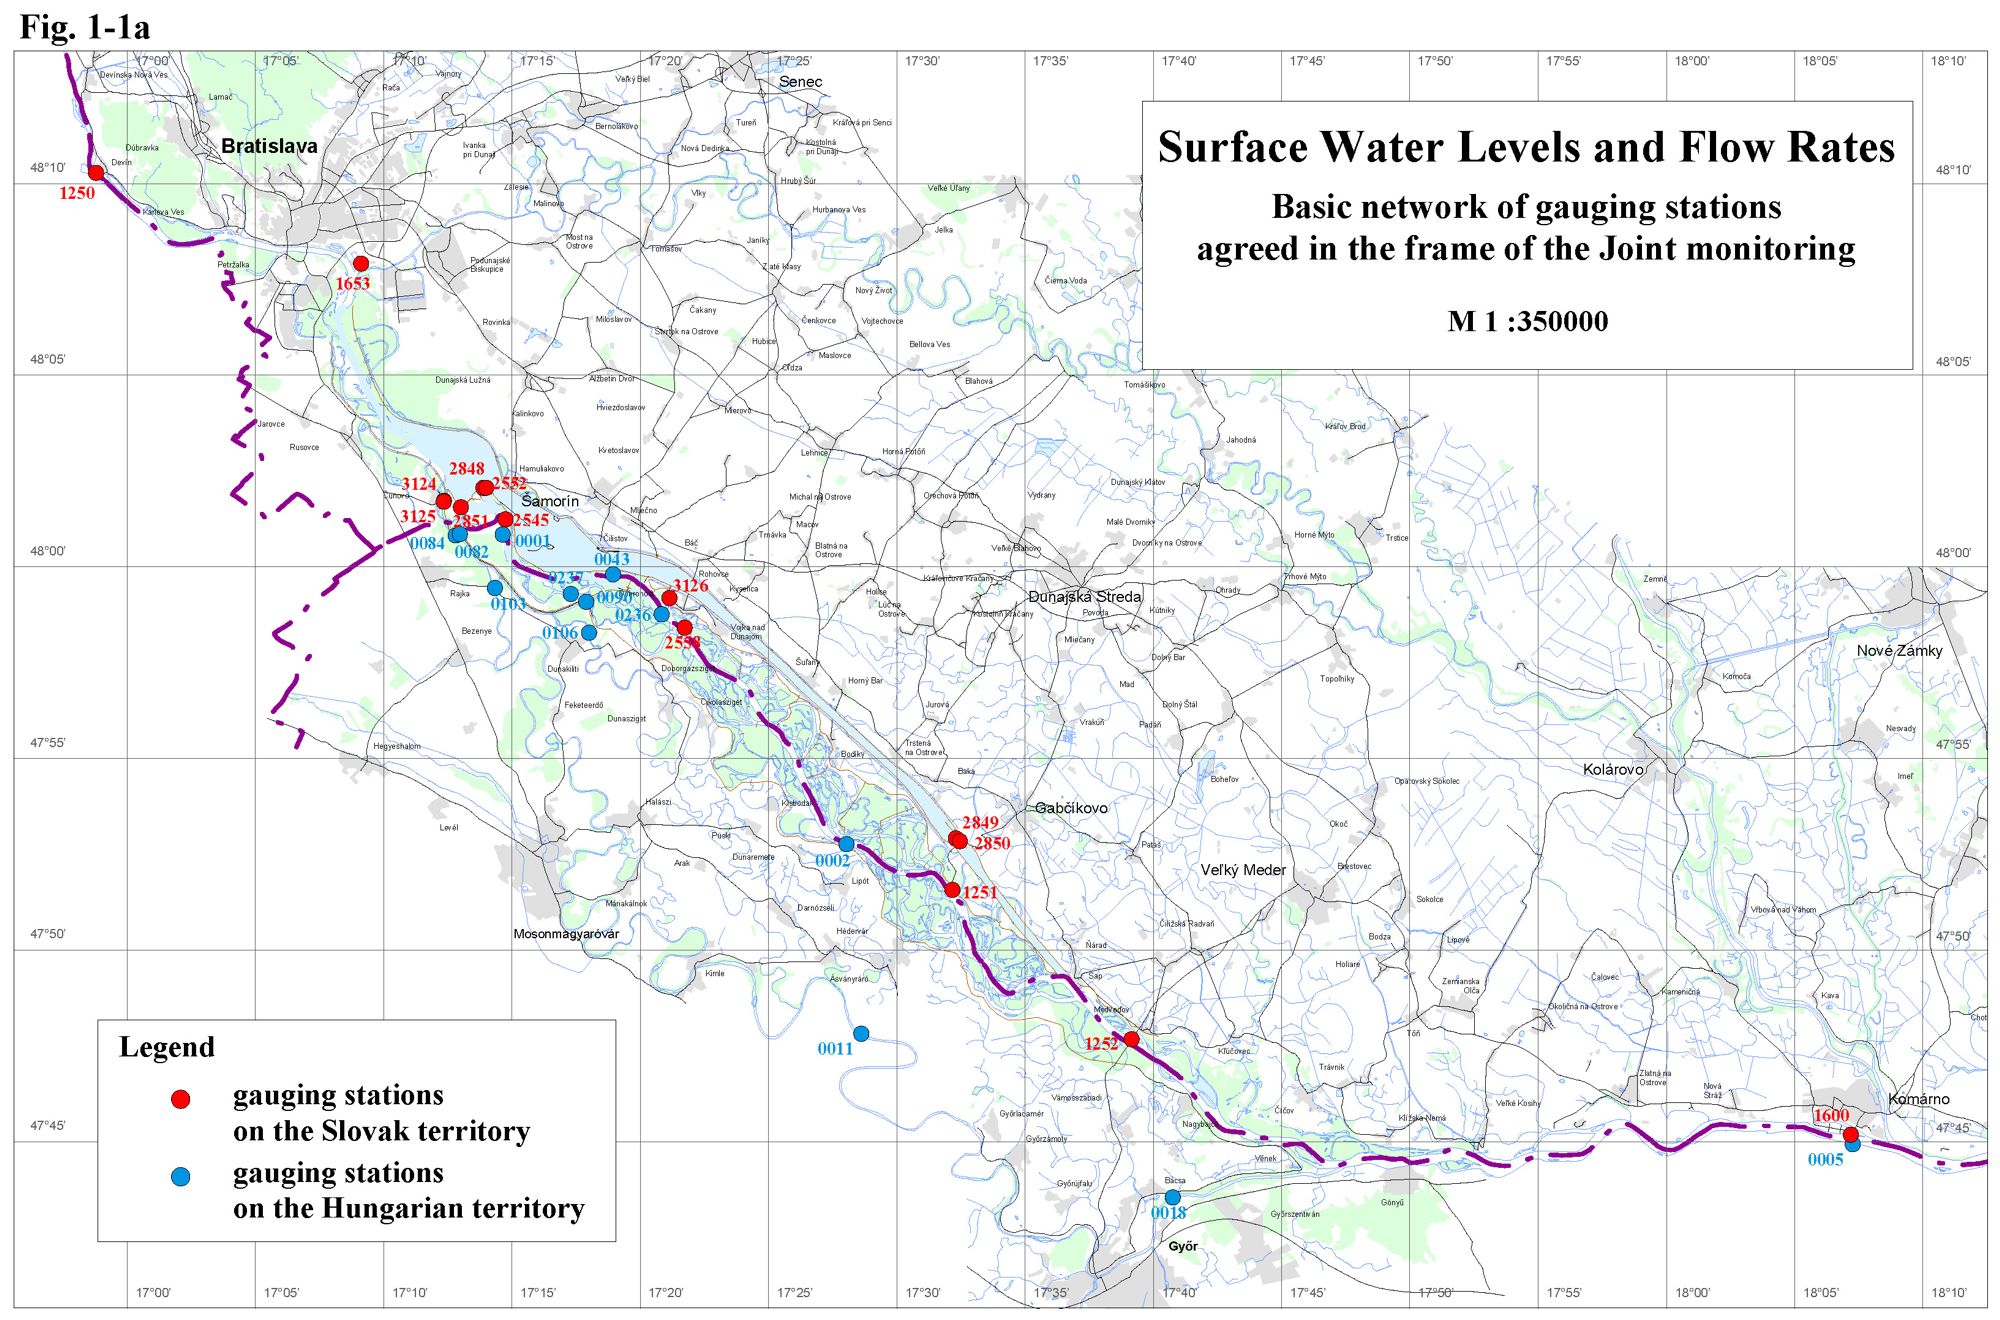
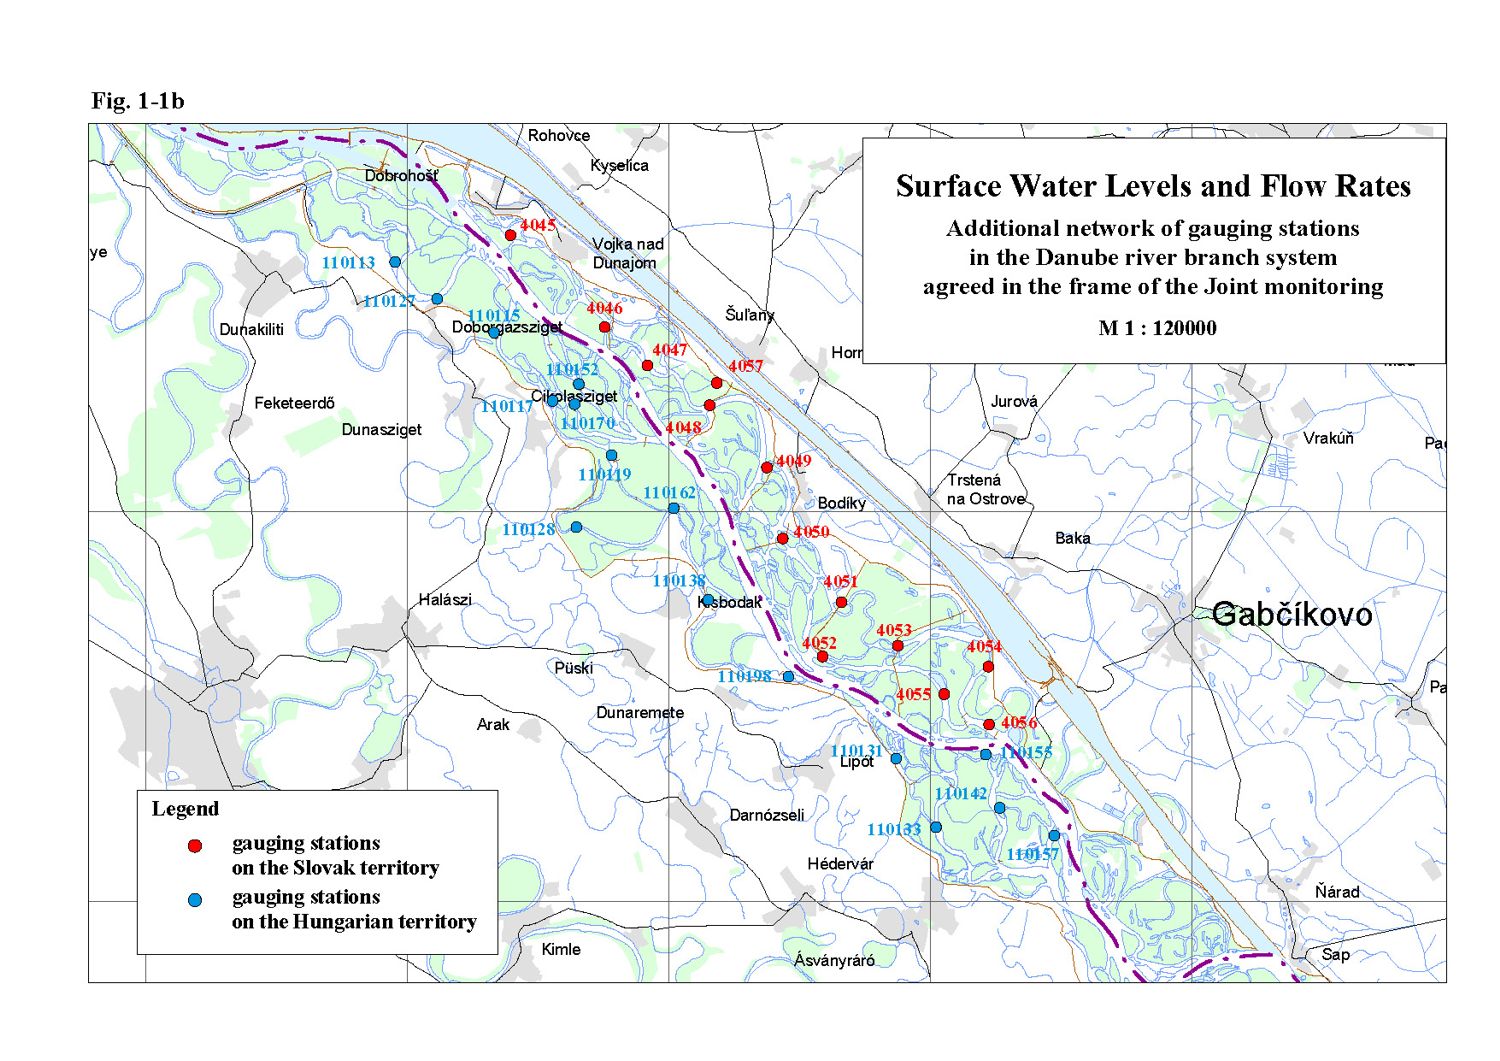
Surface water levels and flow ratesNo changes were registered in the monitoring of surface water levels and flow rates comparing to the previous year. Surface water level recording in the hydrological year 2006 were carried out at 28 gauging stations on the Slovak side and 29 gauging stations on the Hungarian side (Tab. 1-1). On several gauging stations flow rate calculations were performed (10 gauging stations on each side). The observation network is shown in Fig. 1-1a, Fig. 1-1b. The Parties in the intergovernmental Agreement have agreed to mutually exchange data from these gauging stations. Joint flow rate measurements helped the joint evaluation of flow rates discharged into the Danube downstream of the Čunovo dam and into the Mosoni branch of the Danube. Based on a mutual evaluation of joint measurements, time series data were accepted. These data create the basis for joint evaluation of measures and water supply realised according to Articles 1-3 of the Agreement. Table 1-1: List of gauging stations
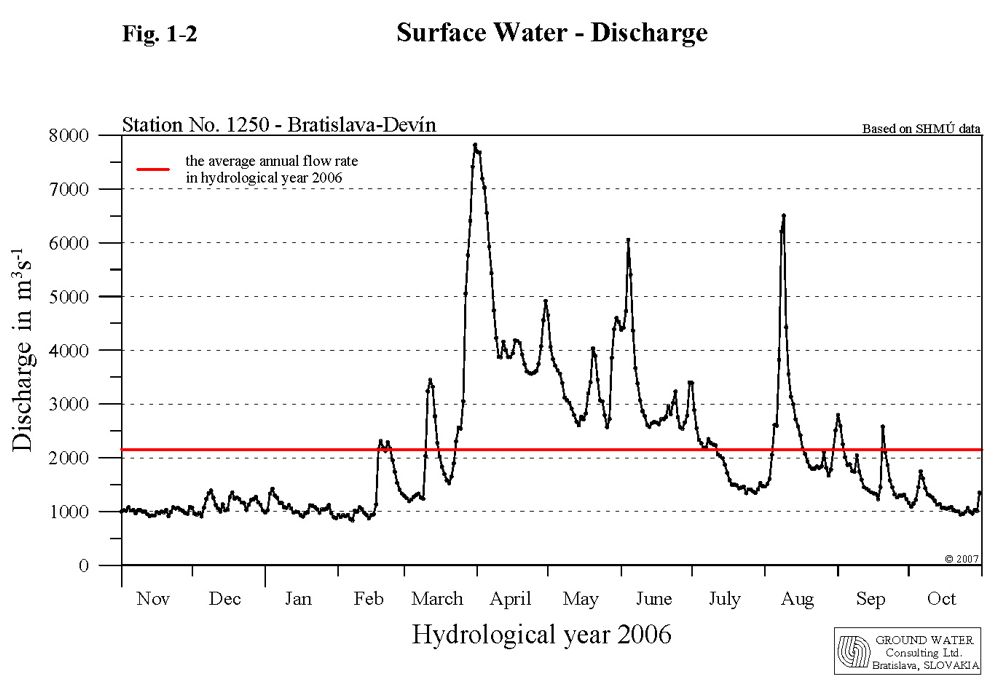
As a part of the intergovernmental Agreement, signed on April 19, 1995 a temporary water management regime was set up. It was agreed that in the case of average annual flow rate of 2025 m3s-1 at the Bratislava-Devín gauging station an annual average of 400 m3s-1 should be discharged into the Danube old riverbed downstream of the Čunovo weir. The actual daily amount of water is governed by the flow rate reaching the Bratislava-Devín profile, taking into consideration the rules of operation described in Annex 2 of the Agreement. The flow rate in the vegetation period, depending on hydrological conditions, should fluctuate from 400 to 600 m3s-1; in non-vegetation period the flow rate should not be less than 250 m3s-1. In case of flow rates over 5400 m3s-1 the amount of water above 600 m3s-1 discharged through the Čunovo weir is not taken into consideration when the annual average is calculated. An additional 43 m3s-1 of water was agreed in the Agreement to be discharged into the Mosoni branch of the Danube and the right side seepage canal. The gauging station Bratislava-Devín plays a key role in determining the amount of water to be discharged into the old Danube riverbed downstream of the Čunovo weir. The minimum daily flow rate 805 m3s-1 occurred on February 7, 2006, when the average daily flow rate was 832,9 m3s-1. The maximum flow rate occurred on March 31, 2006, when it reached 8024 m3s-1, with a maximum average daily flow rate of 7823 m3s-1. The average annual flow rate at this station in the hydrological year 2006 was similar to the flow rate in previous year, and reached 2152 m3s-1, which was the sixth highest annual average flow rate observed since 1992 (Tab. 1-2). Considering the course of water levels and flow rates during the hydrological year 2006 it can be stated that no unusual values occurred. April was an extremely water rich month. March, May, June and August 2006 were water rich months; while November and December 2005, January, February, July and October 2006 belonged to dry months. September 2006 belonged to medium water rich months. Extremely dry months did not occur. Table 1-2: Average annual flow rates
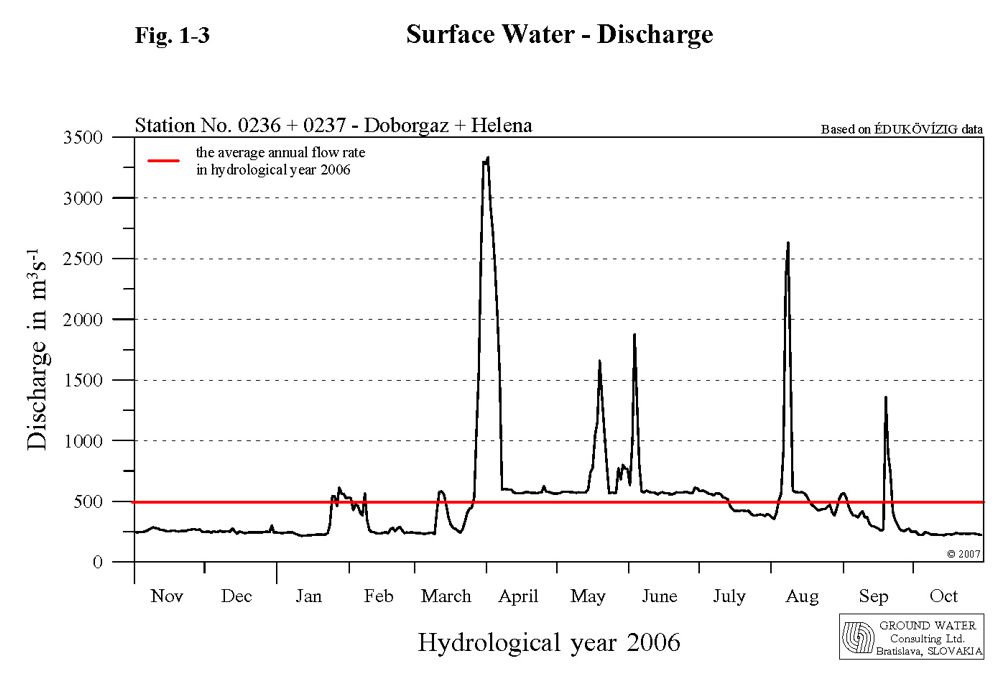
Low flow rates in the Danube prevailed from the beginning of the hydrological year till the middle of February 2006, when the average daily discharge mostly fluctuated around 1000 m3s-1. In the second half of February flow rates increased and reached values over 2000 m3s-1, however consequently they dropped back to about 1300 m3s-1. Another discharge wave occurred at the beginning of the second decade of March, when the flow rates reached values over 3000 m3s-1 with a maximum of 3590 m3s-1. Rich precipitation and snow melting at the end of March caused a sudden increase of flow rate, which culminated on March 31, 2006 at 8024 m3s-1 (average daily discharge 7823 m3s-1). The second peak of the same flood wave occurred on April 2, 2006. During April flow rates remain rather high an fluctuated around 4000 m3s-1. At the end of April another discharge wave occurred, culminating at 5236 m3s-1. During May the flow rate changed between 2500 and 4500 m3s-1, and at the end of month and at the beginning of June another flood wave occurred, culminating at 6415 m3s-1. From the end of the first decade till end of the month flow rates fluctuated between 2500 and 3500 m3s-1. At beginning of July the flow rates started to decrease and at the end of July they dropped to 1400 m3s-1, which represented almost the lowest values for this month during the whole observation period. At the beginning of August another flood wave occurred as a response to heavy rains in the Danube basin, culminating at 7224 m3s-1. After its decrease the flow rates from middle of August till the end of the hydrological year fluctuated below the long term average, however at the beginning of September and at the beginning of the third decade of September two discharge wave occurred, with a flow rate up to 2800 m3s-1. The course of flow rates during the hydrological year 2006 at gauging station No. 1250 - Bratislava-Devín is shown in Fig. 1-2. 1.1. Discharge into the Danube downstream of Čunovo weirThe determination of the average daily amount of water discharged into the Danube downstream of the Čunovo weir was based on average daily flow rates determined at stations Doborgaz and Helena (Fig. 1-3). The monthly characteristics of the daily average flow rates into the Danube in the hydrological year 2006 were as follows:
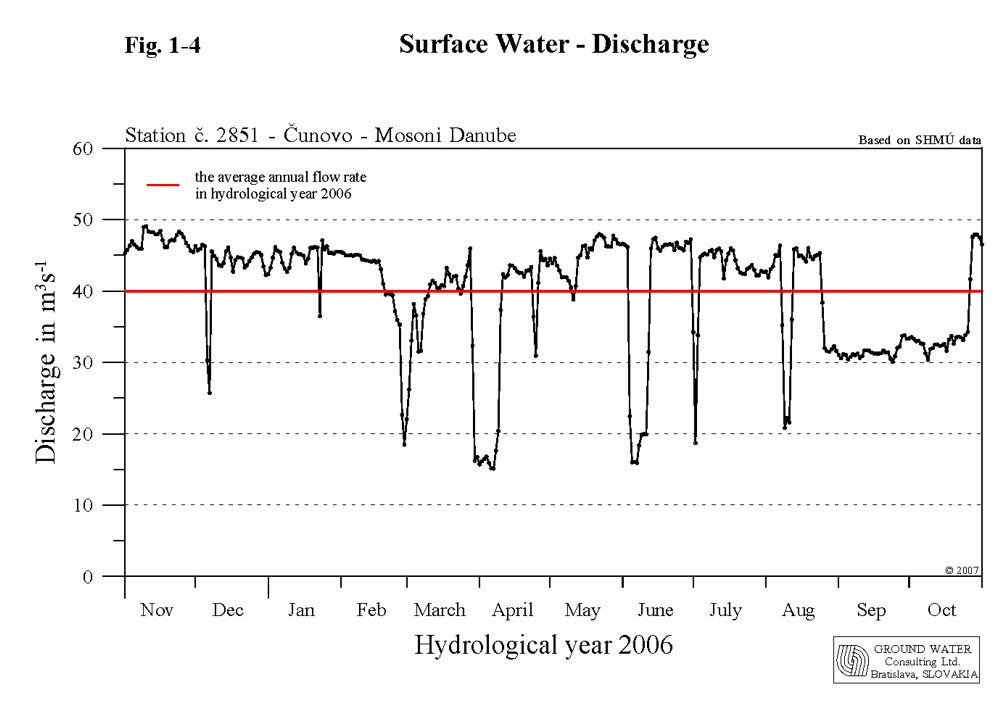
The average annual flow rate in the Danube at the Bratislava-Devín profile in hydrological year 2006 was 2152 m3s-1. Taking into consideration obligations envisaged in the intergovernmental Agreement, the Slovak Party was obliged to release an average annual discharge of 425.1 m3.s-1 into the Danube riverbed downstream of the Čunovo weir. The total average annual discharge released to the Danube downstream of Čunovo was 495.6 m3s-1. During hydrological year 2006 it was necessary to release an amount of water into the riverbed downstream of Čunovo exceeding 600 m3s-1 on three occasions, due to high flow rates in the Danube (flood waves in March/April, June and August). According to the modified method of average discharge calculation, accepted in the Joint Annual Report on the environment monitoring in 2004, discharges exceeding 600 m3s-1, while the flow rate in the Danube was higher than 5400 m3s-1, were reduced to 600 m3s-1. When subtracting the amount of water over 600 m3s-1 released during the flood events (15 values), the average annual flow rate of 424.5 m3s-1 is obtained, which represents 99.9 % of the amount requested by the Agreement. The yearly average minimum of 215.8 m3s-1 in the Danube old riverbed was measured on January 12, 2006; the yearly average maximum of 3335 m3s-1 was recorded on April 2, 2006. When evaluating the amount of water discharged to the Danube old riverbed, it can be stated that Slovak Party fulfilled the average annual discharge jointly agreed in the intergovernmental Agreement. Taking into consideration the minimal values prescribed in the Agreement (in the winter period not less than 250 m3s-1, in the vegetation period at least 400 m3s-1) it can be stated that considering the accuracy of the measurements (10 %) discharges below 250 m3s-1 in the winter period occurred several times (3 days in January 2006 ), in the vegetation period the minimal discharges of 400 m3s-1 were fulfilled. 1.2. Discharge into the Mosoni branch of the DanubeAccording to the intergovernmental Agreement, the discharge into the Mosoni branch of the Danube should be 43 m3s-1, which is composed of both the discharge released to the Mosoni branch of the Danube through the intake structure at Čunovo, and the discharge through the seepage canal. Discharge measurements are carried out downstream of the intake structure on the Slovak territory at 0.160 rkm and also upstream of lock No. I on the Hungarian territory. The average daily discharges were agreed after the joint evaluation of joint discharge measurements performed at both profiles. In this evaluation, data measured just downstream of the intake structure was considered (Fig. 1-4). The monthly characteristics of the amount of water released into the Mosoni Danube through intake at Čunovo in the hydrological year 2006 were as follows:
The average annual discharge was 39.97 m3s-1. The minimal daily average discharge was 15.11 m3s-1; the maximal daily average discharge was 49.07 m3s-1. The flow rate in the right side seepage canal was measured at two sites as well. The first is on Slovak territory at Čunovo; the second is on Hungarian territory at lock No. II. In the evaluation the data observed at lock No. II was considered. The monthly characteristics of the flow rates recorded at lock No. II in the hydrological year 2006 were as follows:
The average annual flow rate was 2.60 m3s-1. The minimal daily average discharge was 1.26 m3s-1; the maximal daily average discharge was 5.66 m3s-1. The monthly characteristics of the total flow rate released into the Mosoni Danube in the hydrological year 2006, consisting of the water amount discharged through the intake structure at Čunovo and water amount flowing in the right side seepage canal, were as follows:
The total average annual flow rate was 42.57 m3s-1, which represents 99.0 % of the agreed amount. The minimal daily average discharge was 18.34 m3s-1; the maximal daily average discharge was 52.21 m3s-1. Regardless the technical (maintenance of turbines) and hydrological conditions it can be stated that the total water amount of 43 m3s-1 envisaged in the Agreement, discharged through the Mosoni Danube and through the seepage canal, was satisfied. 1.3. Water distribution on the Hungarian territoryThe goal of distributing water on the Hungarian side is to provide a continuous water supply into the inundation area, into the river branches on the flood-protected area and into the Mosoni Danube. 1.3.1. Water supply into the inundation areaThe river branches in the inundation area on the Hungarian side can be supplied by water from two sources. These two flows are summed to get the total amount. a) Through three openings in the Danube riverbank, by manipulating the water level increased by the submerged weir and the Dunakiliti dam. The total inflowing discharge is measured at Helena. b) From the seepage canal through lock No. V. Joint discharge measurements by both Parties were performed at the Helena profile. The measurements were jointly evaluated and the average daily flow rate data were accepted. The monthly flow rates characteristics at Helena profile in the hydrological year 2006 were as follows:
The average annual flow rate was 68.35 m3s-1. The minimal daily average discharge was 2.58 m3s-1; the maximal daily average discharge was 355.2 m3s-1. The monthly flow rates characteristics at lock No. V in the hydrological year 2006 were as follows:
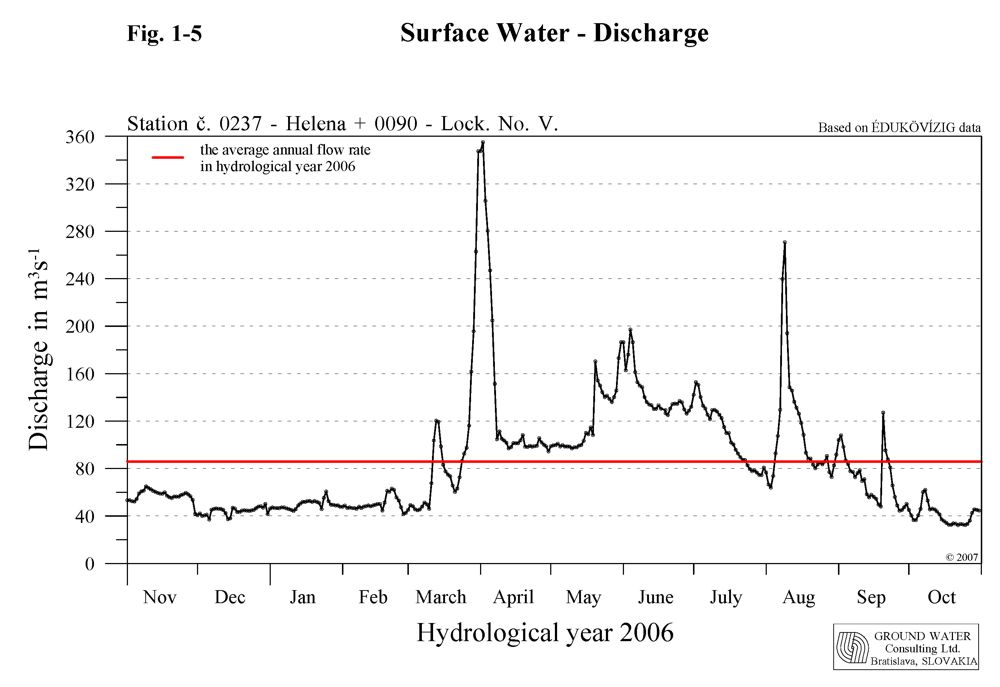
The average annual flow rate was 17.60 m3s-1. The minimal daily average discharge was 0.00 m3s-1; the maximal daily average discharge was 40.40 m3s-1. The monthly flow rates characteristics of the total amount of water released into inundation area in the hydrological year 2006 (Fig. 1-5), consisting of the water amount flowing through the Helena profile and water amount flowing through the Lock. No. V in the right side seepage canal, were as follows:
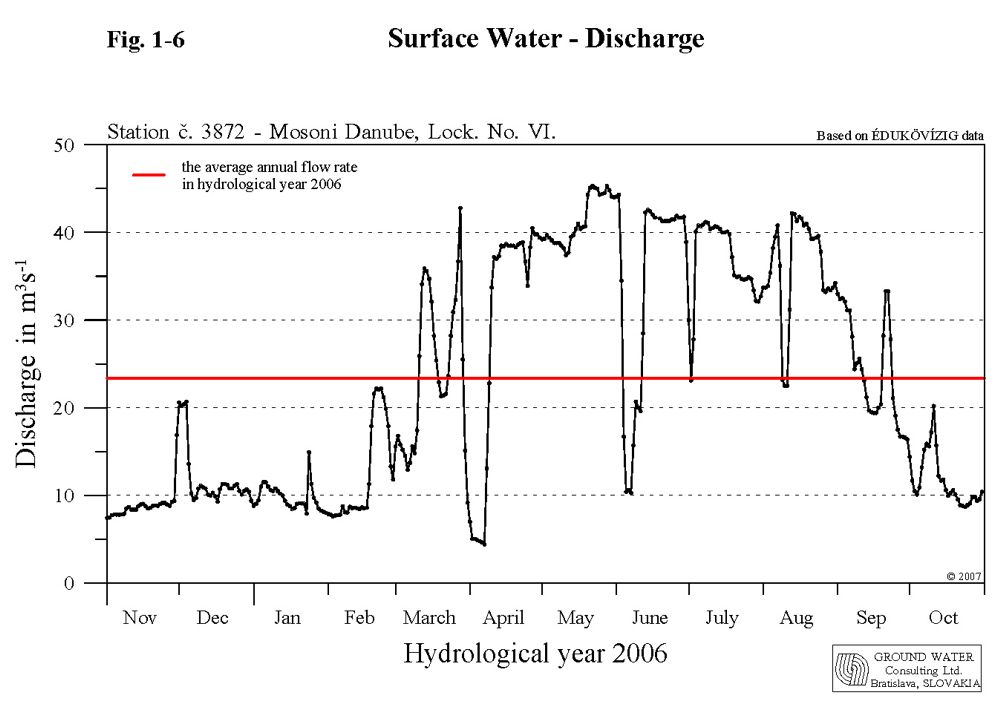
The total average annual flow rate supplied into river branches in the inundation area was 85.95 m3s-1. The minimal daily average discharge was 32.27 m3s-1; the maximal daily average discharge was 355.2 m3s-1. 1.3.2. Water supply into the Mosoni DanubeThe water supply into the Mosoni Danube is secured from the seepage canal through the lock No. VI (Fig. 1-6). The flow rate is measured at the profile downstream of the lock. The monthly characteristics of flow rates through the lock No. VI in the hydrological year 2006 were as follows:
The average annual flow rate in the Mosoni Danube at lock No. VI. was 23.37 m3s-1. The minimal daily average discharge was 4.40 m3s-1; the maximal daily average discharge was 45.30 m3s-1. The water supply regime is regulated by rules of operation and follows the Danube’s water regime. During the non-vegetation period a low water period was simulated in the Mosoni Danube as well. This was done by redirecting of a large part of the water from the seepage canal into the inundation area through lock No. V., while amount of water taken from the Danube upstream of Dunakiliti was reduced. Besides its water supply function lock No. I also has a flood protection function. It prevents floods entering the flood-protected area. 1.4. The Danube water level characteristics on the Čunovo-Vámosszabadi stretchThe Danube stretch between Čunovo and Vámosszabadi can be divided into four different sections according to the prevailing influence. These sections can be characterised by data obtained from the following gauging stations: Rajka and Hamuliakovo, Dunakiliti, Doborgaz and Dobrohošť, Dunaremete and Gabčíkovo. Vámosszabadi and Medveďov. The characteristics of four sections on the Čunovo-Vámosszabadi stretch in hydrological year 2006 are the following: a) Čunovo - Dunakiliti section. The water
level in this section has been impounded since construction of the submerged
weir. This impounded section supplies water into the right side river branch
system. The amount of water released to the river branch system is determined
by water level regulation at the Dunakiliti dam. The water level is kept in the
mid-water riverbed. Average flow velocities fluctuated in the range between
0.35 - 0.77 m.s-1. In hydrological year 2006 discharges
exceeding 600 m3s-1 were released into the Danube old
riverbed on three occasions. For the first time it was between March 28 and
April 7, when the highest average daily flow rate reached 3335 m3s-1.
For the second time it was on June 4-5, when the average daily discharge
reached 2013 m3s-1. The last one occurred during August
8-9, when the average daily flow rate reached 2772 m3s-1.
During the hydrological year 2006 no increased amount of water (above the
agreed maximum of 600 m3s-1) was requested by the
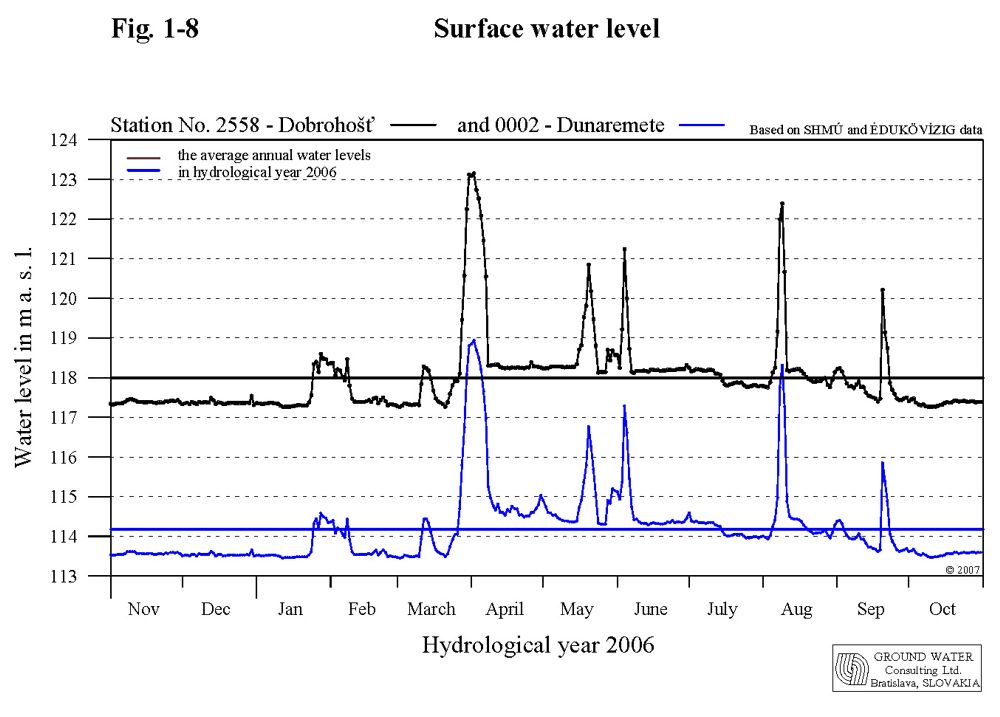
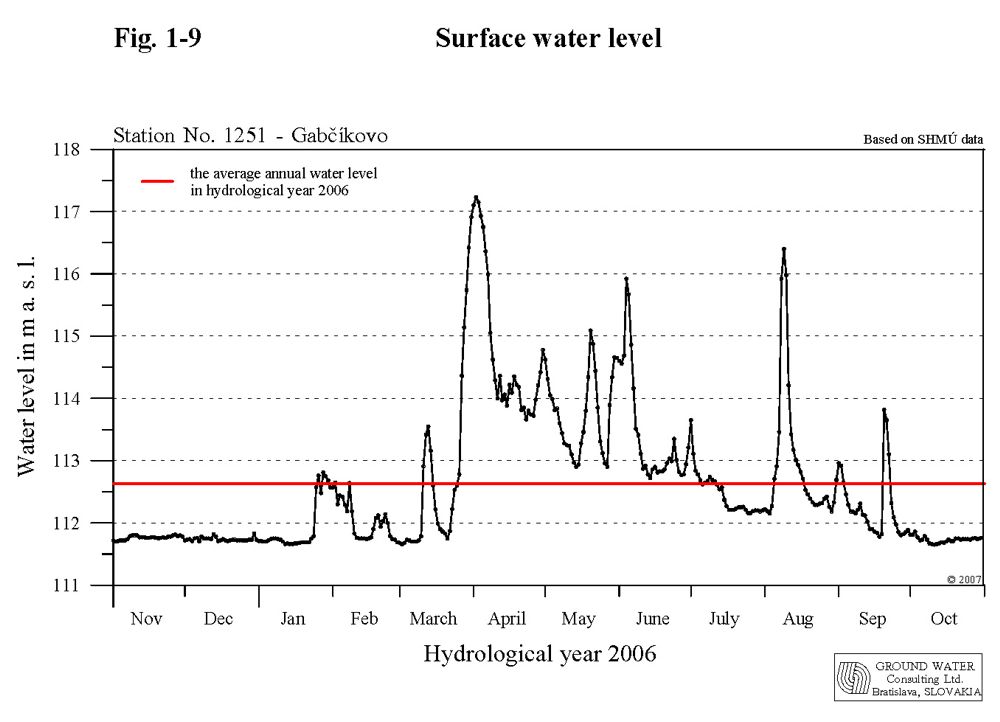
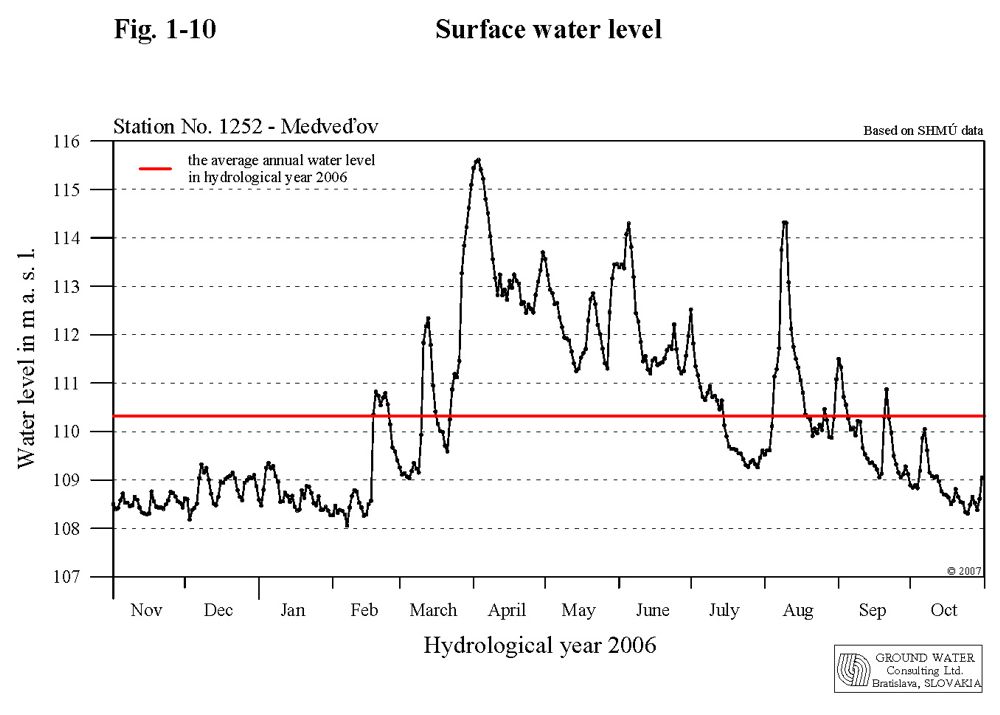
Hungarian side, for artificial flooding of the right side inundation area. b) Section between Dunakiliti and Dunaremete. This section of Danube is not influenced by any measures and the water level is determined only by the flow rate in this riverbed section. In the upper part of this section the water level in river branches is about 3 m higher than the water level in main riverbed. The average daily water level at the Dobrohošť gauging station (rkm 1838.6) fluctuated in the range from 117.26 to 123.15 m a. s. l. and the average annual water level was 117.99 m a. s. l. The average daily water level at the Dunaremete profile (1825.5) fluctuated from 113.45 to 118.94 m a. s. l. and the average annual water level was 114.18 m a. s. l (Fig. 1-8). The average flow velocities fluctuated in the range between 0.74-1.12 m.s-1. c) Section between Dunaremete and Sap. The water level in this section is influenced by the backwater effect from the confluence of the tail race canal and the Danube old riverbed (rkm 1811). The water level changes, especially in the lower part of this section, are influenced by the flow rates in the tail race canal. The length of the upstream section influenced by the backwater effect depends on the actual flow rate distribution between the hydropower station and the Danube old riverbed. At regular operation it can be stated that the backwater effect reaches the Dunaremete profile (rkm1825.5) at flow rates over 2500 m3s-1 at Medveďov. The average daily water level at the Gabčíkovo gauging station (rkm 1819) fluctuated in the range from 111.65 to 117.23 m a. s. l. and the average annual water level was 112.63 m a. s. l (Fig. 1-9). The daily water level fluctuation at the Gabčíkovo gauging station in the Danube old riverbed can reach app. 0.20 m as a consequence of hydropower station operation. d) Sap – Vámosszabadi section. The flow rate in this section approximately equals the flow rate at Bratislava and is additionally influenced by the Gabčíkovo hydropower station operation. The daily water level fluctuation at this stretch (up to 0.30 m) depends on the hydropower station operation. Higher changes occur at low flow rates in the Danube due to the ratio of the total flow rate and the capacity of one turbine, which may be put into operation or stopped. The average annual flow rate at the Vámosszabadi-Medveďov profile in 2006 was 2091 m3s-1. The average daily water level at Medveďov profile (rkm 1806.3) fluctuated in the range from 108.06 to 115.61 m a. s. l. and the average annual water level was 110.32 m a. s. l (Fig. 1-10).
|
||||||||||||||||||||||||||||||||||||||||||||||||||||||||||||||||||||||||||||||||||||||||||||||||||||||||||||||||||||||||||||||||||||||||||||||||||||||||||||||||||||||||||||||||||||||||||||||||||||||||||||||||||||||||||||||||||||||||||||||||||||||||||||||||||||||||||||||||||||||||||||||||||||||||||||||||||||||||||||||||||||||||||||||||||||||||||||||||||||||||||||||||||||||||||||||||||||||||||||||||||||||||||||||||||||||||||||||||||||||||||||||||||||||||||||||||||||||||||||||||||||||||||||||||||||||||||||||||||||||||||||||||||||||||||||||||||||||||||||||||||||||||||||||||||||||||||||||||||||||||||||||||||||||||||||||||||||||||||||||||||||||||||||||||||||||||||||||||||||||||||||||||||||||||||||||||||||||||||||||||||||||||||||||||||||||||||||||||||||||||||||||||||||||||||||||||||||||||||||||||||||||||||||||||||||||||||||||||||||||||||||||||||||||||||||||||||||||||||||||||||||||||||||||||||||||||||||||||||||||