PART 5
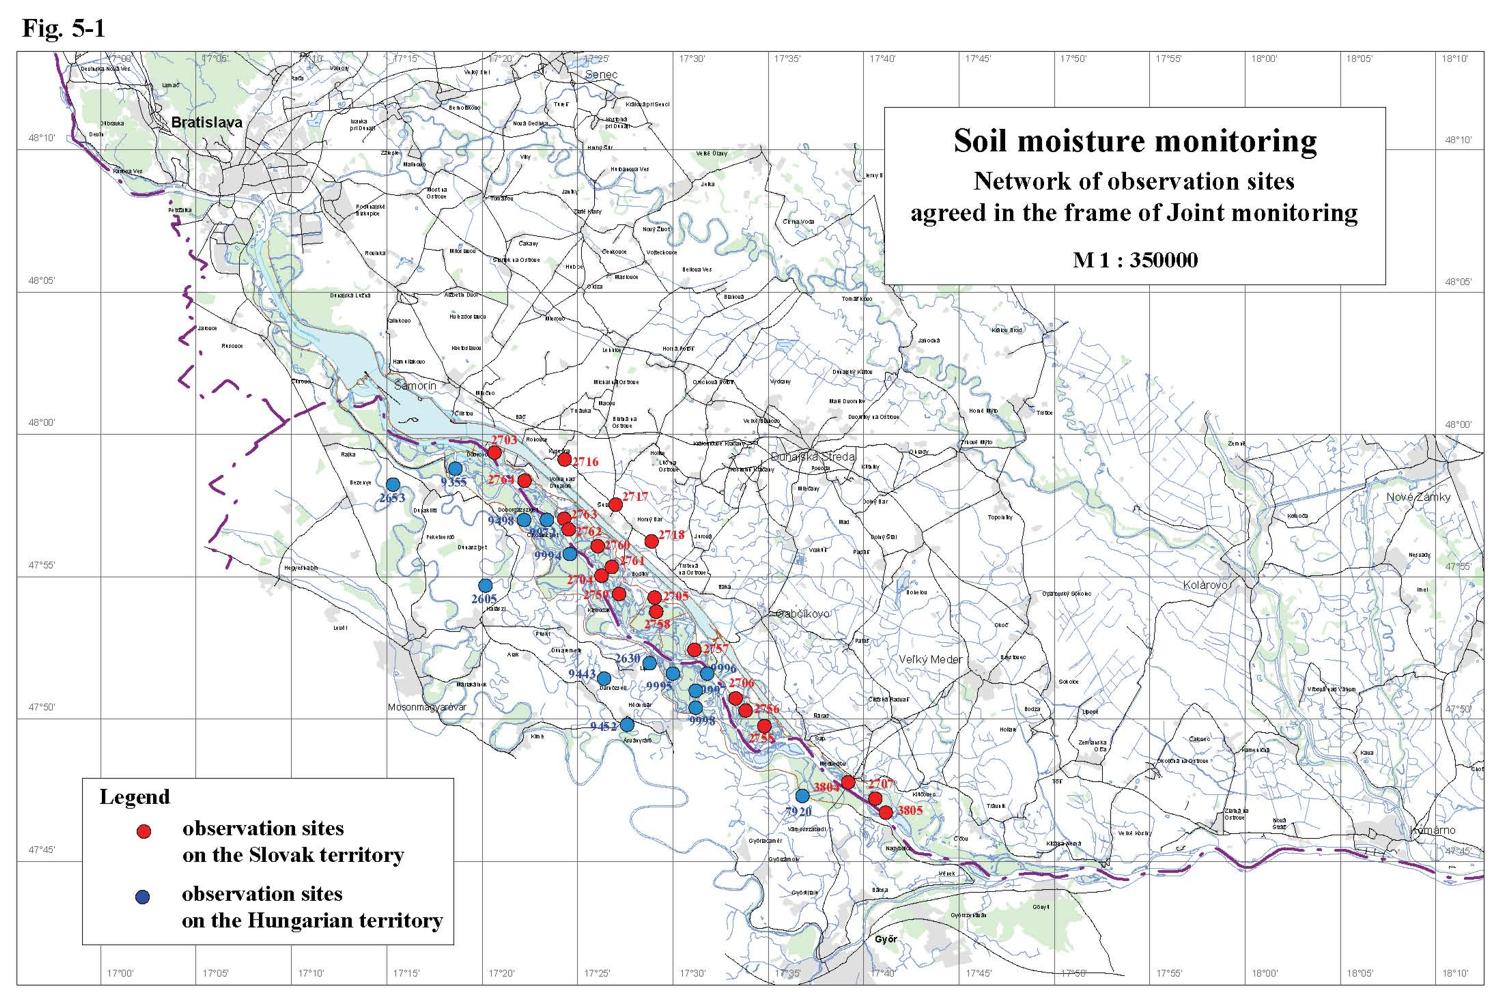
Soil Moisture Monitoring5.1. Data collection methodsThe soil moisture monitoring in the hydrological year 2002 was performed according to the intergovernmental Agreement. The measurements on both sides were carried out without changes. The Slovak side measured the soil moisture by a neutron probe down to a prescribed depth or to the depth of the ground water level. The Hungarian side measured the soil moisture with a capacity probe to the depth of 2 m. The soil moisture on both sides is expressed by the total soil moisture content in volume percentage recorded in 10 cm depth intervals for each measurement during the year. Measurements on the Slovak side were performed on 12 forest monitoring areas, on 5 biological monitoring areas and on 3 agricultural areas – Tab. 5-1. Measurements on the Hungarian side were performed on 9 forest monitoring areas and 5 agricultural areas - Tab. 5-2. The situation of observation objects is shown on Fig. 5-1. Table 5-1: List of monitoring stations on the Slovak side
Table 5-2: List of monitoring stations on the Hungarian side
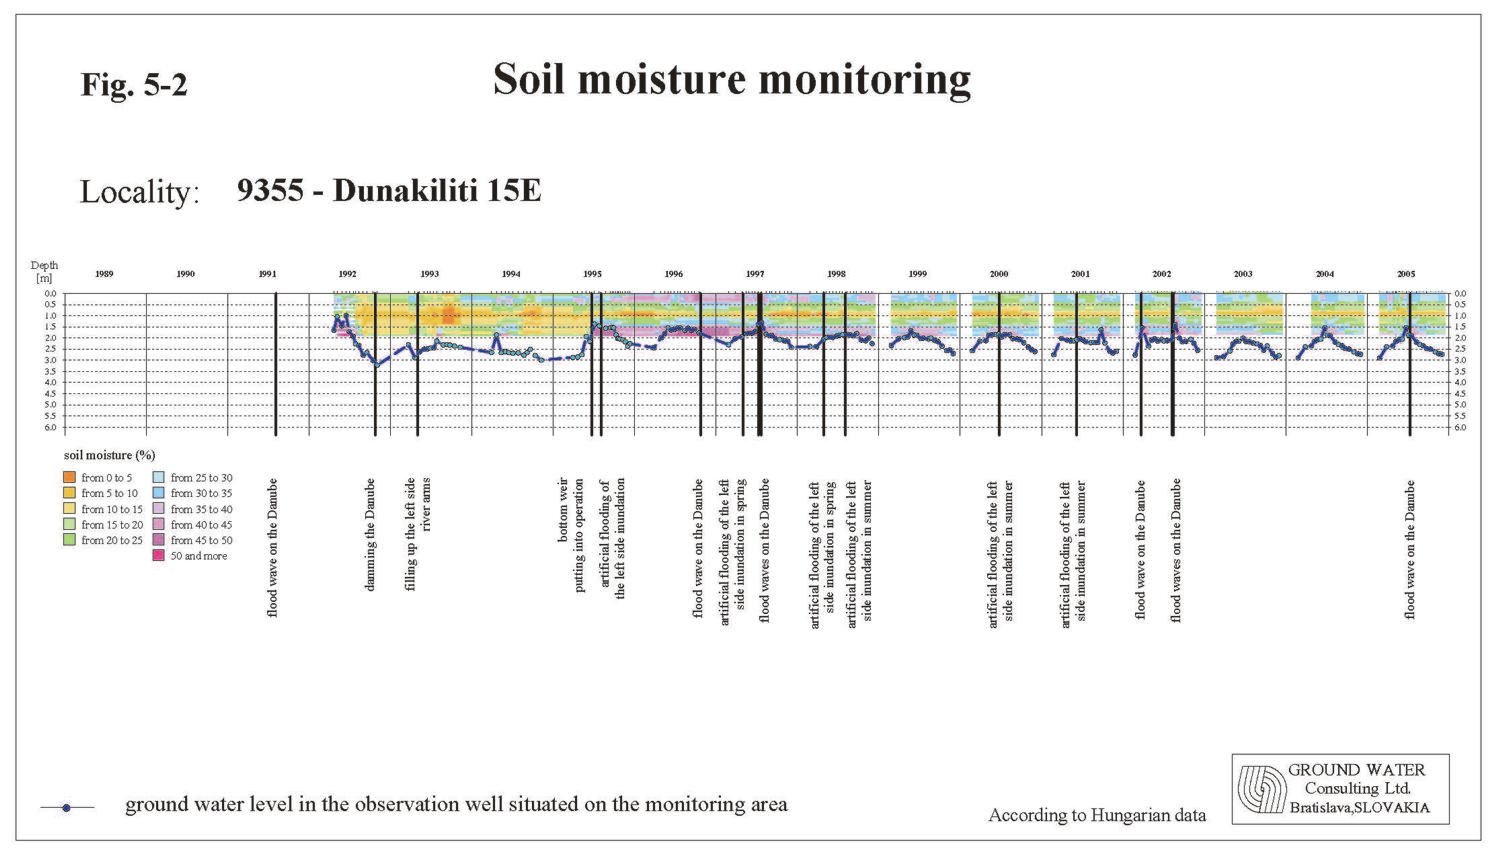
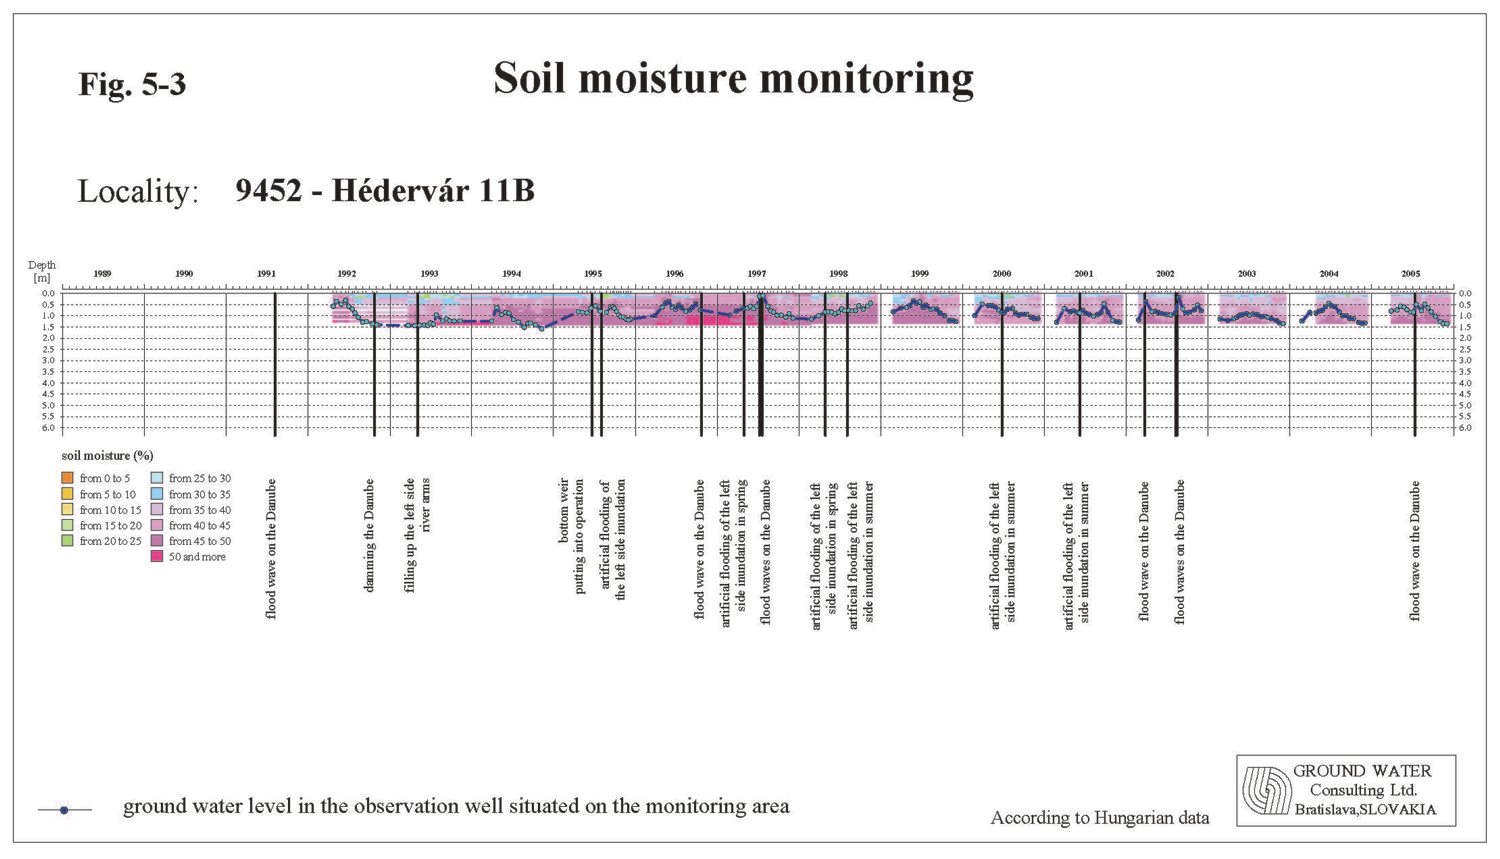
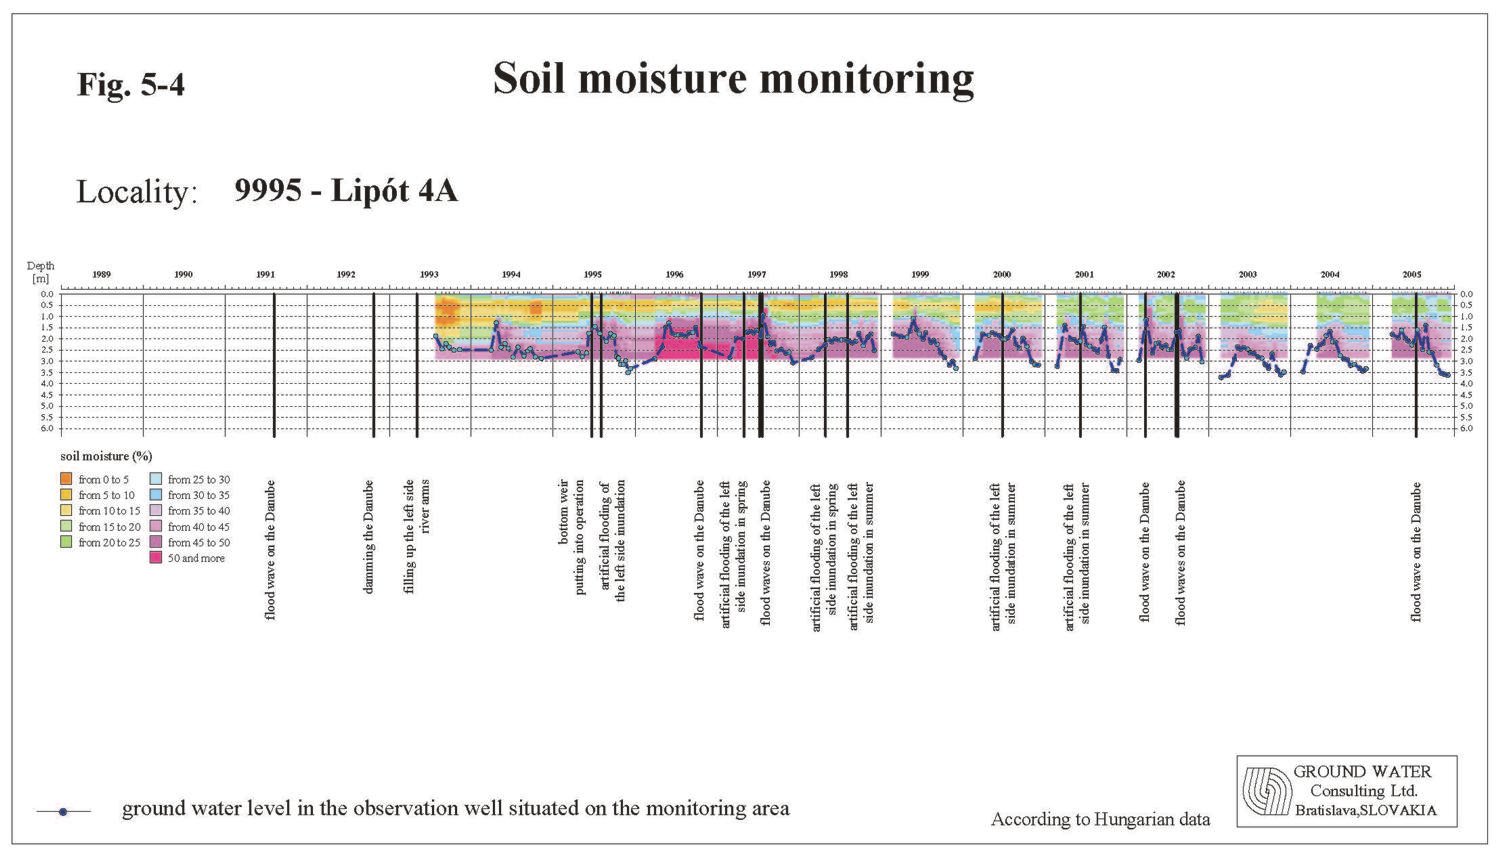
5.2. Data presentation methodsBoth Parties present soil moisture in figures showing the average soil moisture content in volume percentage for the depth interval from 0 to 100 cm and from 110 to 200 cm. A small difference can occur in the Hungarian data, where the value for a depth interval under 110 cm can represent the average value for the rest of the total measured depth (the average value can be calculated from less than 10 measured values). On colour figures the soil moisture time distribution for the whole measured depth is presented. The graphical presentation of the whole set of measured data is given in the Slovak and Hungarian National Annual Reports. 5.3. Evaluation of results on the Hungarian sideThe soil moisture measurements on the Hungarian side in 2004 continued at forestry monitoring sites in the floodplain area as well as at agricultural monitoring sites in the flood-protected area (Fig. 5-1). The moisture conditions of soils are essentially influenced by the rainfall conditions, by the soil layer thickness and composition, as well as by the ground water level position. The volume of rainfall in the period of six month before the growing season was 220 mm in Győr and 201 mm in Mosonmagyaróvár, which represents 83.4 and 97.3 % of the long-term average respectively. This is 25-46 mm less than the starting base in the previous year. However the precipitation amount in first three months of 2005 were slightly over the long-term average. The soil saturation by water reached 85-90% at the beginning of the vegetation period. Higher amount of rainfall occurred in April, May and June, however the regional differences were significant. The amount of precipitation in March reached 125 and 130 % in Győr and Mosonmagyaróvár respectively, in May 100 and 72 % and in June 119 and 51 %. The soil moisture content decreased slightly or it did not change in the upper soil layers. During discharging increased amount of water into the Danube old riverbed and right side river branches ground water level increase were registered, which helped in soil moisture recharge. The lowest soil moisture content was registered in the second half of June and at the beginning of July. However, it was higher in comparison to the soil moisture content in the previous year. Extremely high amount of precipitation in the second half of July and in August caused that the rainfall reached 186 % at Győr and 113 % at Mosonmagyaróvár of the long-term averages and in August 198 and 253 % respectively. The soil moisture at most of observed soil profiles reached or almost reached the saturation level. Higher precipitation amount was registered in September as well, what resulted in slight increase of soil moisture content after its temporary decrease in the first half of the month. In October there was almost no precipitation and due to low discharges in the Danube the ground water level decreased as well. The precipitation amount in November did not reach the long-term average either, so the soil moisture content decreased to a moderate level. However, it was higher in comparison to the previous year thanks to the high precipitation amounts in previous months. The soil moisture in the Szigetköz region was positively influenced by higher discharges in March, July and August. Artificial flooding in May positively influenced the soil moisture content in the inundation area as well. The amount of water discharged into the river branch system induced situations characteristic for natural floods. The average ground water level during the vegetation period 2005 was noticeably higher comparing the average ground water level in 2004. The soil moisture on forestry monitoring sites In general, the soil moisture content at all forestry monitoring areas was higher in comparison with the previous year. It was characteristic that in the soil layers up to 1 m depth the minimum, average and the maximum values of the soil moisture contents were higher at all monitoring sites except the site No. 9972. In the depth below 1 m the maximum and average values were higher at all measuring sites except the measuring site No. 9972. The minimum values were higher at all sites. The increased ground water level in various depths moisturized the soil on monitoring sites No. 9355, 9994 and 9995 (Figs. 5-2, 5-4). Slight or no impact of ground water was detected at monitoring site No. 9998, while at monitoring sites No. 9996 and 9997 is the moisturizing from the ground water level not sufficient. Drainage effect of the Danube old riverbed prevails at monitoring site No. 9972. Monitoring site No. 9452 is situated near a water supply rive branch in the middle part of Szigetköz. Soil layers are continuously recharged from the ground water level (Fig. 5-3). The minimal and maximal average soil moisture contents on forestry monitoring sites in 2005 were as follows: Table 5-3: The minimal and maximal average soil moisture contents at forestry monitoring sites
The soil moisture on agricultural monitoring sites on the flood protected side The soil moisture content at monitoring sites No. 2605, 2630 and 2653 were mostly dependent on precipitation and weather condition. However, the ground water level influenced deeper parts of the soil profile as well. The ground water in the hydrological year 2005 reached lower parts of the soil profiles from March to August. Maximum soil moisture values in the layer down to 1 m depth were recorded during August, September and December, when higher amount of precipitation occurred. The soil moisture values below 1 m depth reached the maximum values in July, when a flood wave on the Danube occurred. Minimal soil moisture values in the depth down to 1 m were registered in the winter period and in June. In the soil layers below 1 m depth they occurred at the beginning of the year. The minimal, average and maximal values were in general higher in comparison with the previous year. Monitoring sites No. 9443 and 7920 represent agricultural areas in the Middle and Lower Szigetköz. Both monitoring sites have a thick covering layer and throughout the vegetation period the ground water level moisturized the bottom part of soil layers. Maximum soil moisture values in both layers, down to 1 m depth and below it, were recorded during August. Minimal soil moisture values in the depth down to 1 m were registered at the end of June and at the beginning of July. In the soil layers below 1 m depth they occurred at the beginning and end of the year. The minimal, average and maximal values were higher in comparison with the previous year. The minimal and maximal average soil moisture contents on agricultural monitoring sites in 2005 were as follows: Table 5-4: The minimal and maximal average soil moisture contents at agricultural monitoring sites
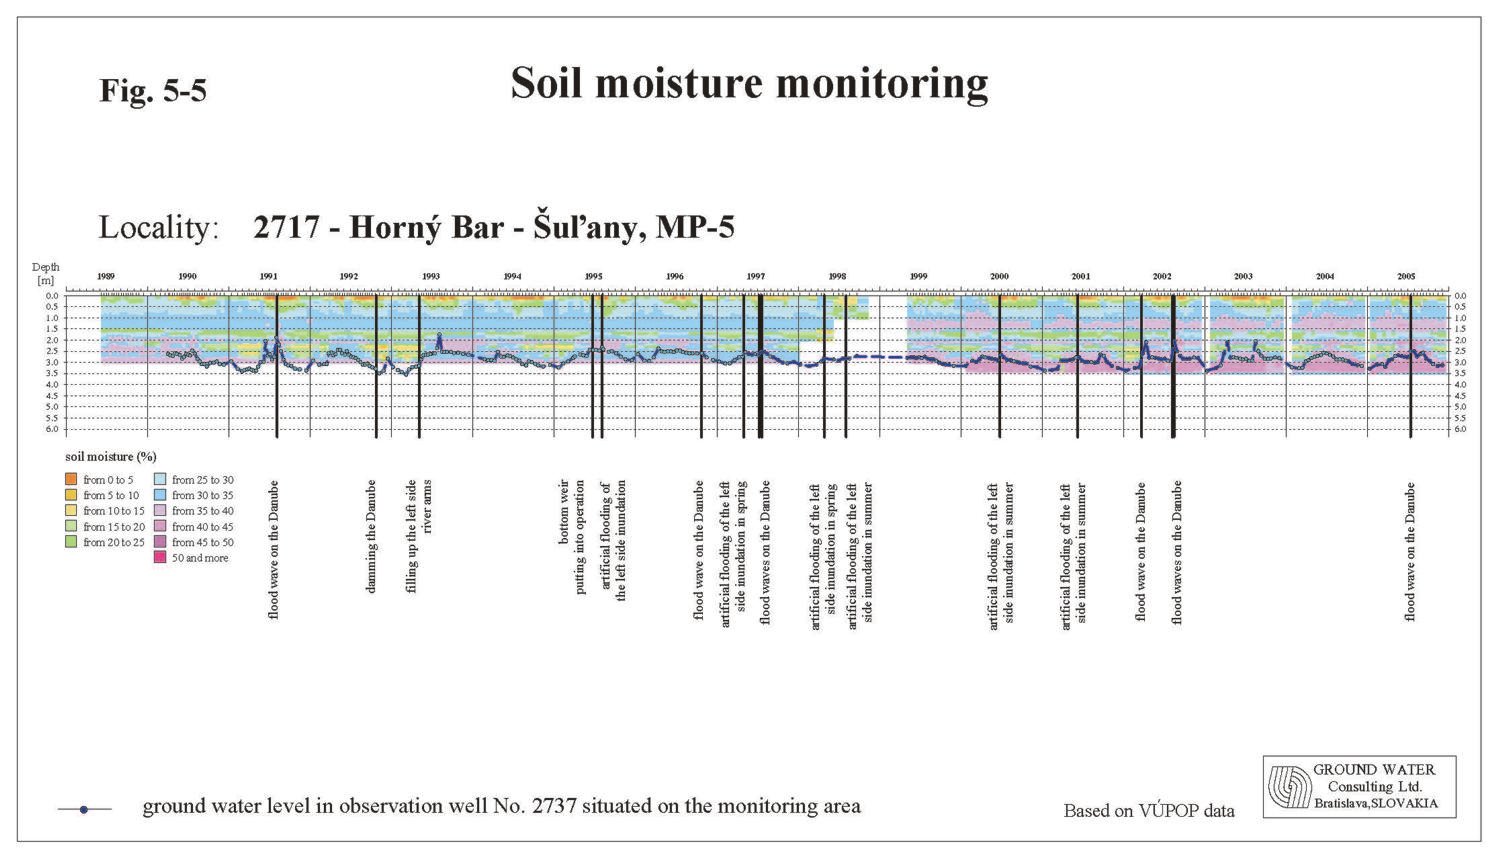
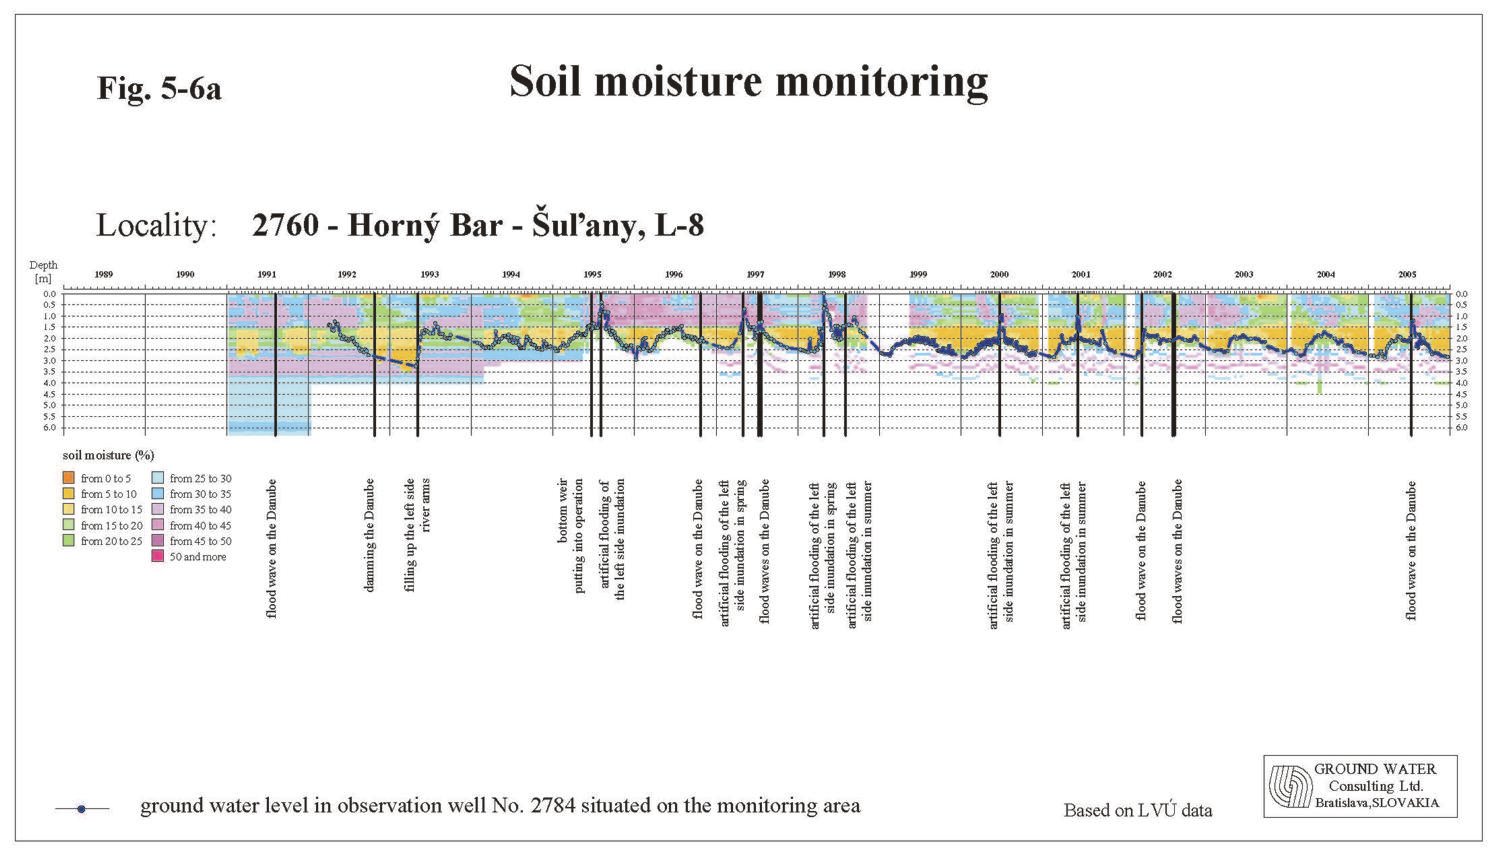
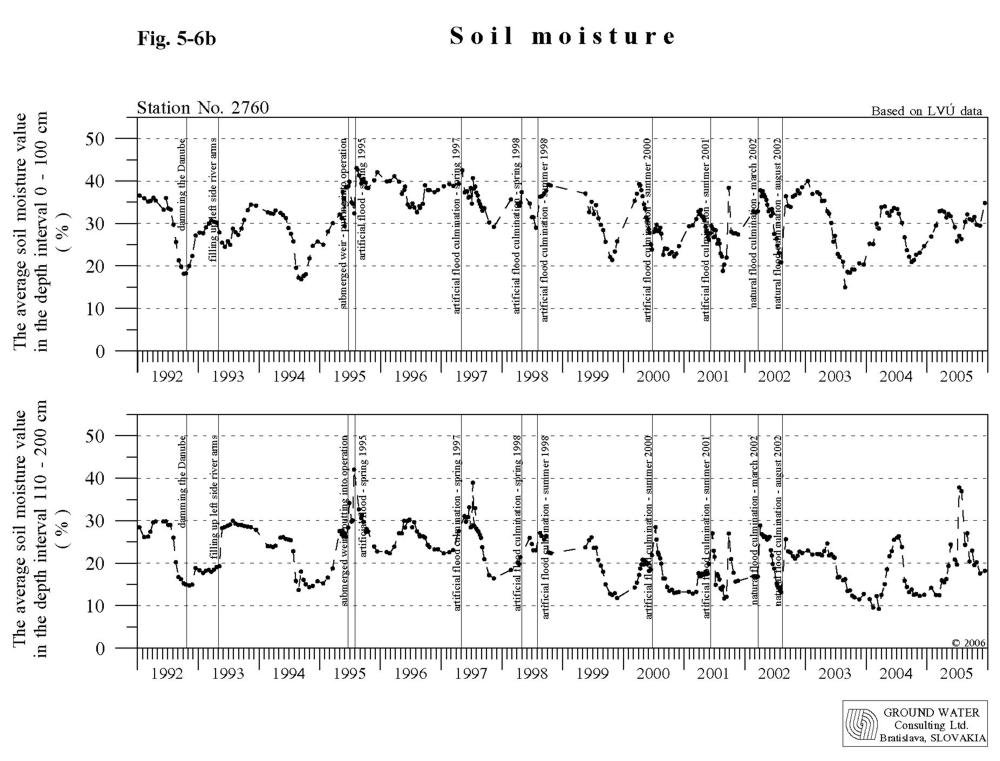
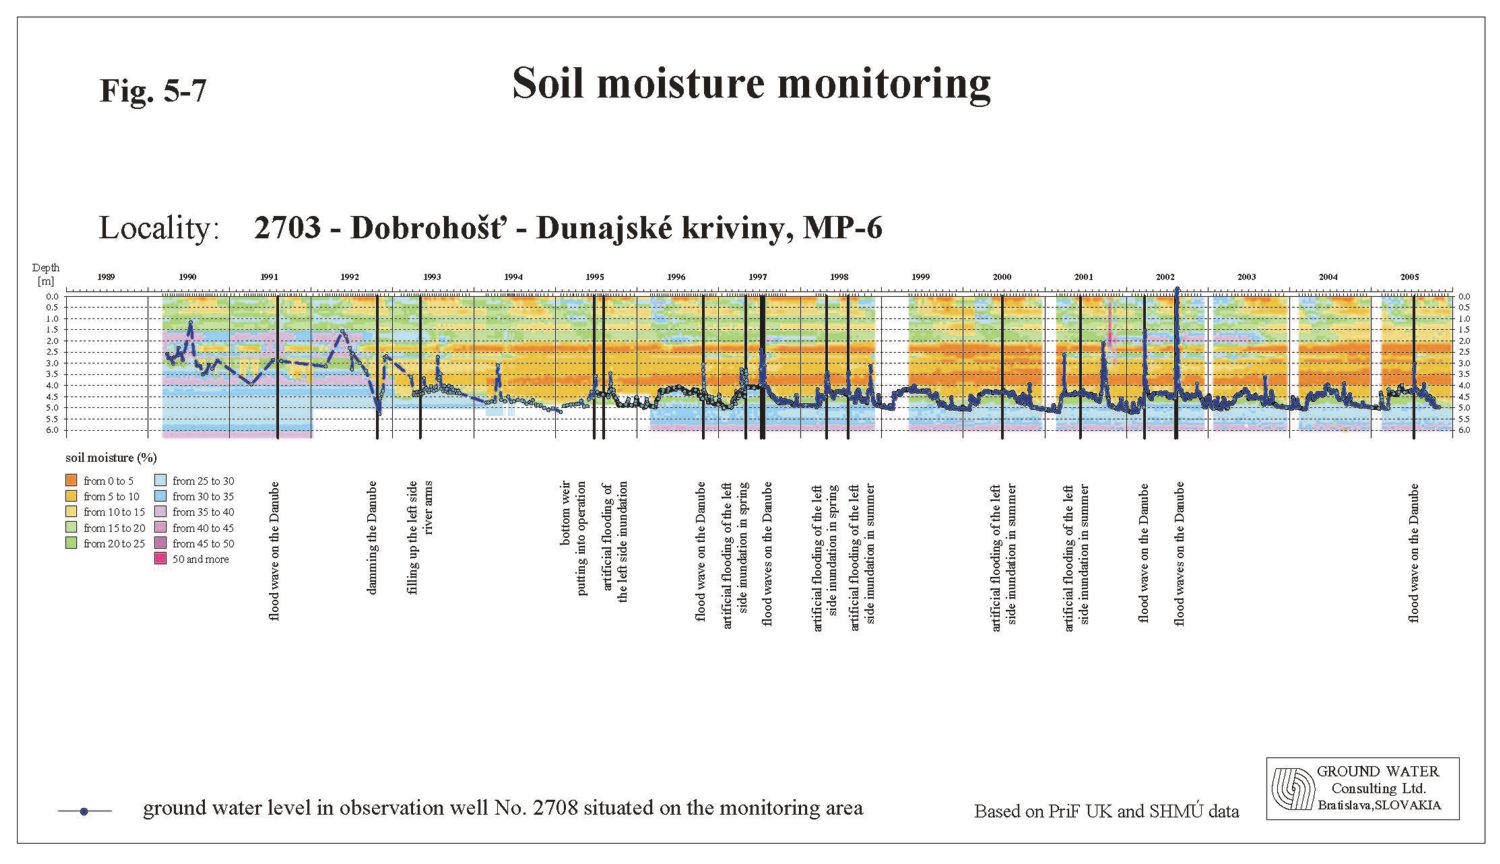
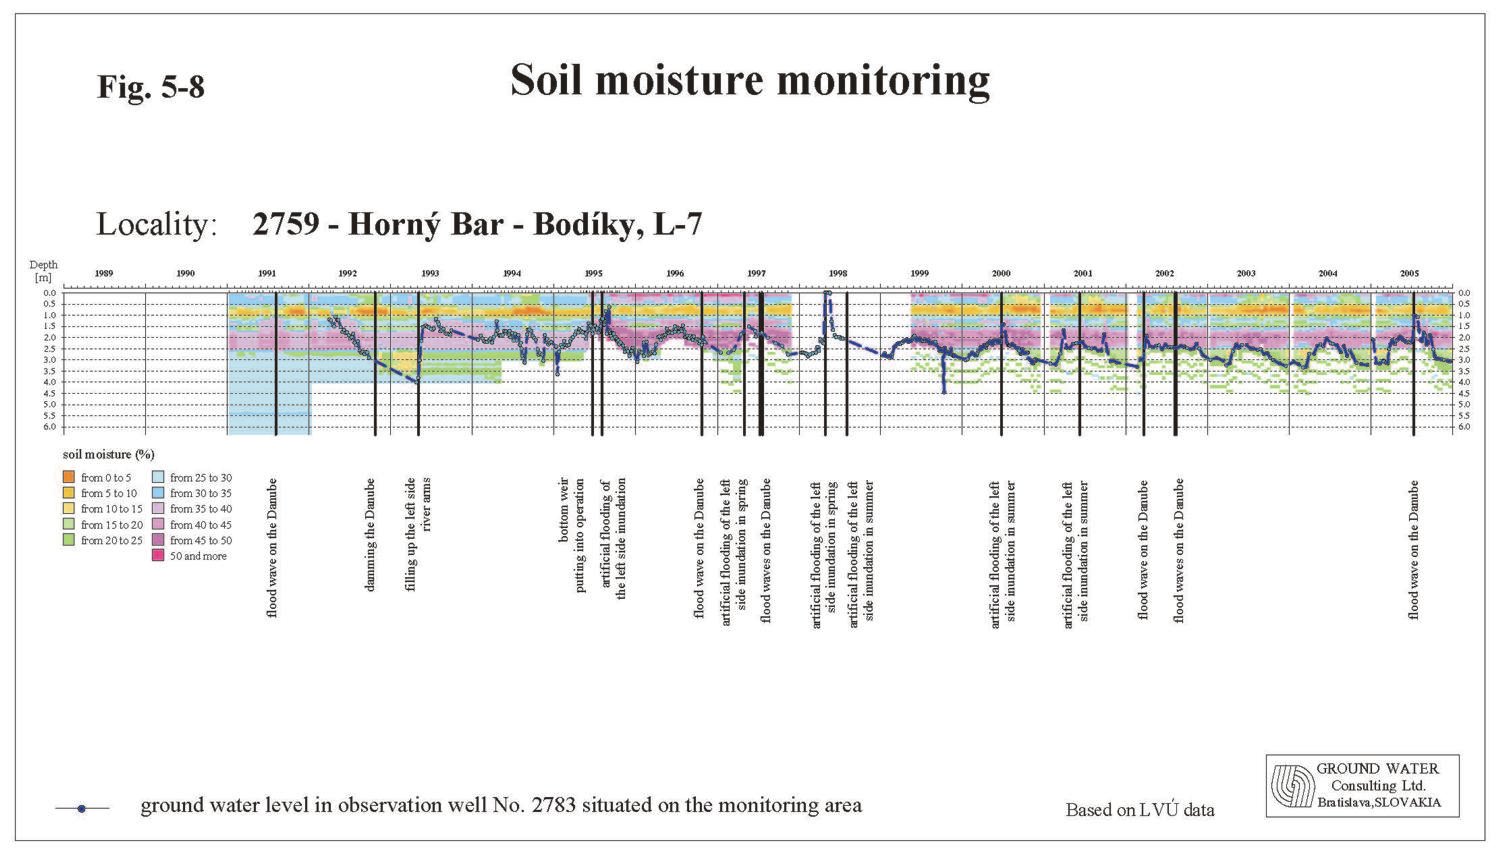
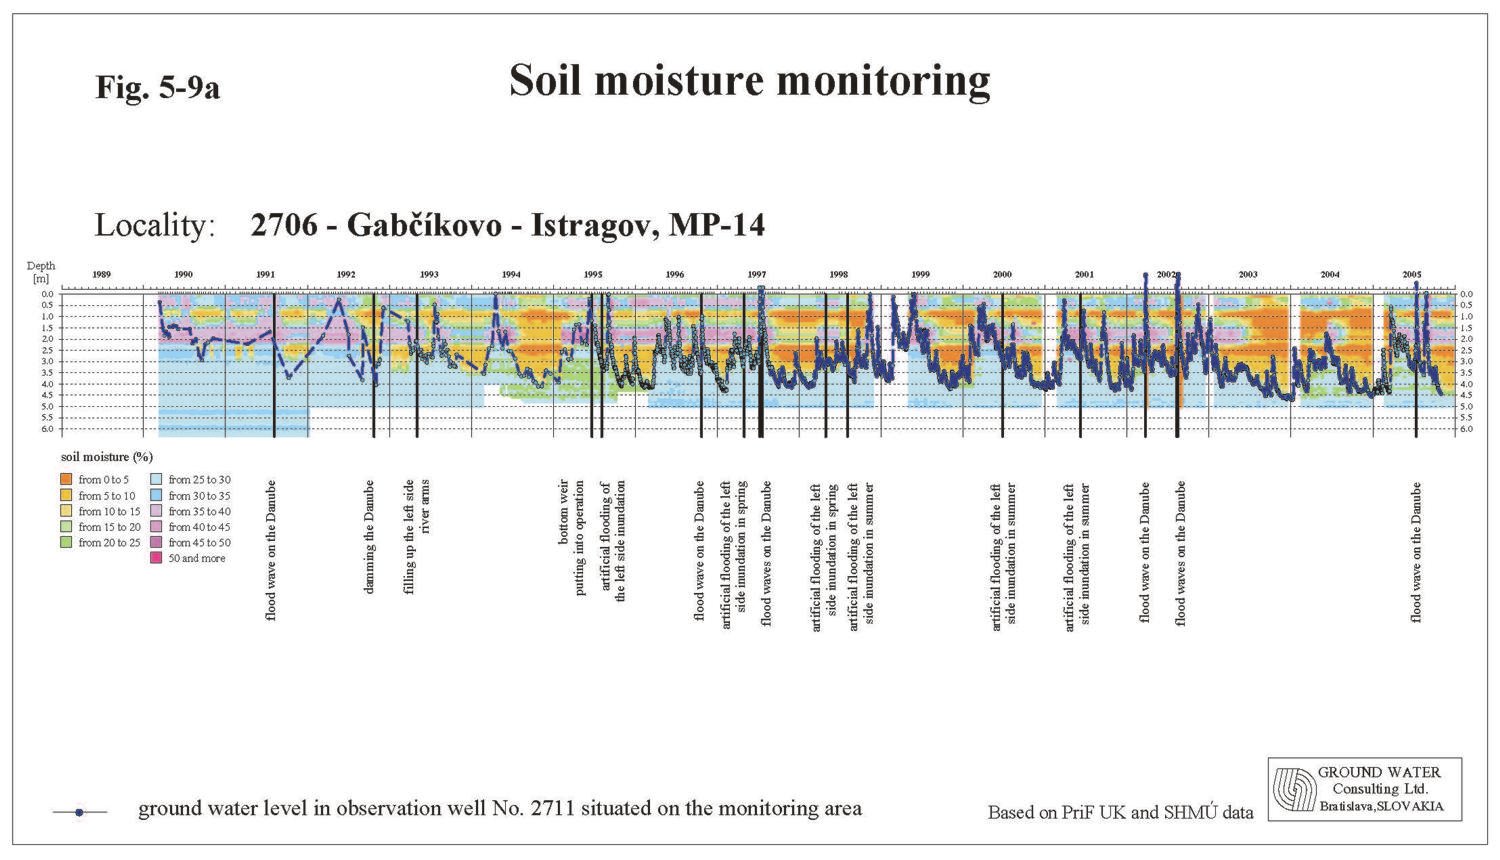
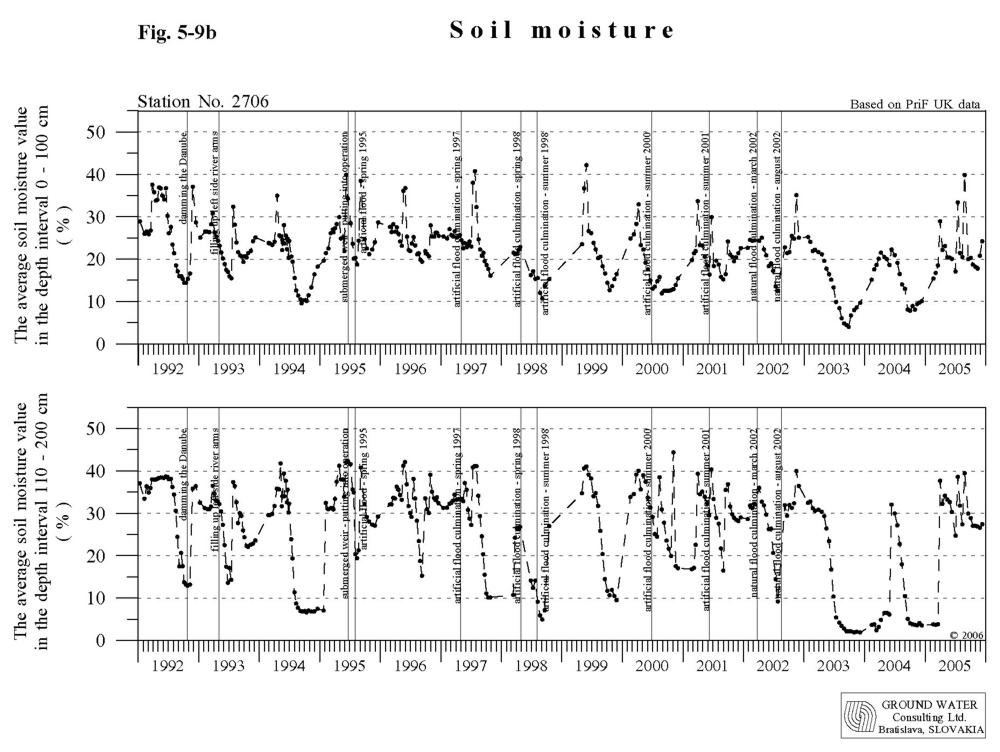
5.4. Evaluation of results on the Slovak sideMonitoring sites on the Slovak side are situated in the inundation area and flood-protected agricultural area (Fig. 5-1). According to the soil moisture observations at monitoring sites situated in the agricultural area (sites No. 2716, 2717, 2718), the soil moisture content during the whole observed period remained unchanged (Fig. 5-5). The position and fluctuation of ground water levels remained unchanged as well. In the year 2005 the ground water level at monitoring site No. 2716 fluctuated in depths of 2.8-3.8 m, at site No. 2717 in depths of 2.5-3.3 m and at site No. 2718 in depths of 2-2.6 m. The fluctuation of soil moisture content in the depth interval from 0 to 1 m depends mostly on climatic conditions. In the depth from 1 to 2 m, the soil moisture fluctuation, except monitoring area No. 2716, is partly influenced by the ground water level. The soil moisture content in the depth down to 1 m mostly in the year 2005 fluctuated in the range from 9 to 21 % at monitoring site No. 2716 and in the range from 25 to 33 % at monitoring sites No. 2717 and 2718. In the depth between 1 and 2 m, the soil moisture content mainly varied from 12 to 20 % at monitoring site No. 2716, in the range from 28 to 36 % at monitoring site No. 2717 and in the range from 12 to 23 % at monitoring site No. 2718. The situation in the inundation area is more complex. Changes of the soil moisture content depend mainly on the location of the monitoring site in respect to the Danube, in respect to the river branch water supply, and on the soil profile thickness. The soil moisture is, along with the ground water level and precipitation, highly dependent on natural or artificial floods. In hydrological year 2005 natural floods occurred in three occasions. However, the floods were not big enough to flood the inundation area. Only the lower part of the inundation was partially flooded. The soil moisture content at the beginning of vegetation period was unfavourable influenced by low amount of precipitation in last months of the previous year. Till the beginning of the vegetation period the soil moisture content in the upper layer (down to 1 m depth) reached 80-95 %, which was influenced by the precipitation in first three months. The soil moisture storage at the end of the winter period in layers below 1 m reached only 50-70 % of usual values. In February and March minimal values were measured. Hydrological and climatic conditions became favourable from March to May 2005. Especially the spring flood in the second half of March helped in saturation of soils from the ground water level. The maximal values of the soil moisture in the layer down do 1 m depth were recorded in May and July, thanks to higher amount of precipitation. In the layer below 1 m depth the maximum values were reached in July and August, when flood waves occurred in the Danube. From August till end of the year the soil moisture content continuously decreased. In the inundation area around Dobrohošť and Bodíky villages, the thickness of the soil profile is low, similar to the Hungarian side, at monitoring sites No. 2703, 2764, 2763, 2762 and 2761. The ground water level at these places fluctuates only in the gravel layer. The ground water level on the area No. 2703 fluctuated from 4 to 5 m, on the areas No. 2764, 2763, 2762 and 2761 changed from 1.0-4.7 m. The average values of the soil moisture content in the depth to 1 m significantly fluctuated and they were highly dependent on the climatic conditions (Fig. 5-7). Maximal average soil moisture contents occurred during March, April and May 2005. Minimal values occurred in June and at the end of the year 2005. The maximal values of soil moisture in the depth below 1 m occurred during flood waves in July and August; the minimal values occurred at the beginning of the year. The thickness of the soil profile in the middle part of the inundation area is higher. In general the ground water regime in this region is influenced by the water supply of the river branch system, introduced in May 1993. Moreover, the natural or artificial floods have a high influence on the ground water level. The ground water level usually fluctuates above the boundary between the soil profile and gravel layers - monitoring sites No. 2704, 2705, 2758, 2759, 2760 (Fig. 5-6a, Fig. 5-6b, Fig. 5-8). Except the monitoring site No. 2705 the ground water supplies the soil profile in the depth below 1 m. The maximal values of average soil moisture content in the layer to 1 m depth were reached in March 2005, minimal values occurred in June. In the layer below 1 m depth the maximal values occurred in March, July and August, when flood waves occurred in the Danube; the minimal values at the beginning of the year 2005. In the lower part of the inundation area, downstream of the confluence of the river branch system and the Danube (monitoring sites No. 2706, 2756, 2755), the ground water level usually fluctuates around the boundary between the soil profile and the gravel layer. During higher discharges in 2005 the groundwater level moisturized the soil profile in both depth interval, or even the monitoring sites were flooded. However, due to riverbed erosion downstream of the confluence of the tailrace canal and the Danube old riverbed decrease of groundwater level was registered, especially at low flow rates in the Danube. The average values of the soil moisture significantly fluctuated, and were strongly dependent on the ground water level fluctuation. The minimum and maximum values were related to the minimum and maximum ground water levels respectively. Minimal average values of soil moisture in layers up to 1 m depth occurred at the beginning and at the end of the year; in the layer below 1 m depth at the beginning of the year only. The maximal average values of soil moisture were reached during flood waves in March, July and August 2005 (Fig. 5-9a, Fig. 5-9b). The soil moisture contents at monitoring sites No. 2707, 3804, 3805, located in the inundation below the confluence of the tailrace canal and the Danube old riverbed, are highly influenced by the flow rate regime in the Danube. The maximum values in the year 2005, in the depths down to 1 m and between 1 and 2 m, occurred in March, July and August, while the minimum values occurred at the beginning of the year and in June. The ground water level at monitoring sites No. 2707, 3804 and 3805 fluctuated in the depth 0-4 m. The riverbed erosion negatively influences these monitoring areas. During low flow rates in the Danube the ground water level does not supply the soil profiles sufficiently.
|
||||||||||||||||||||||||||||||||||||||||||||||||||||||||||||||||||||||||||||||||||||||||||||||||||||||||||||||||||||||||||||||||||||||||||||||||||||||||||||||||||||||||||||||||||||||||||||||||||||||||||||||||||||||||||||||||||||||||||||||||||||||||||||||||||||||||||||||||||||||||||