PART 2
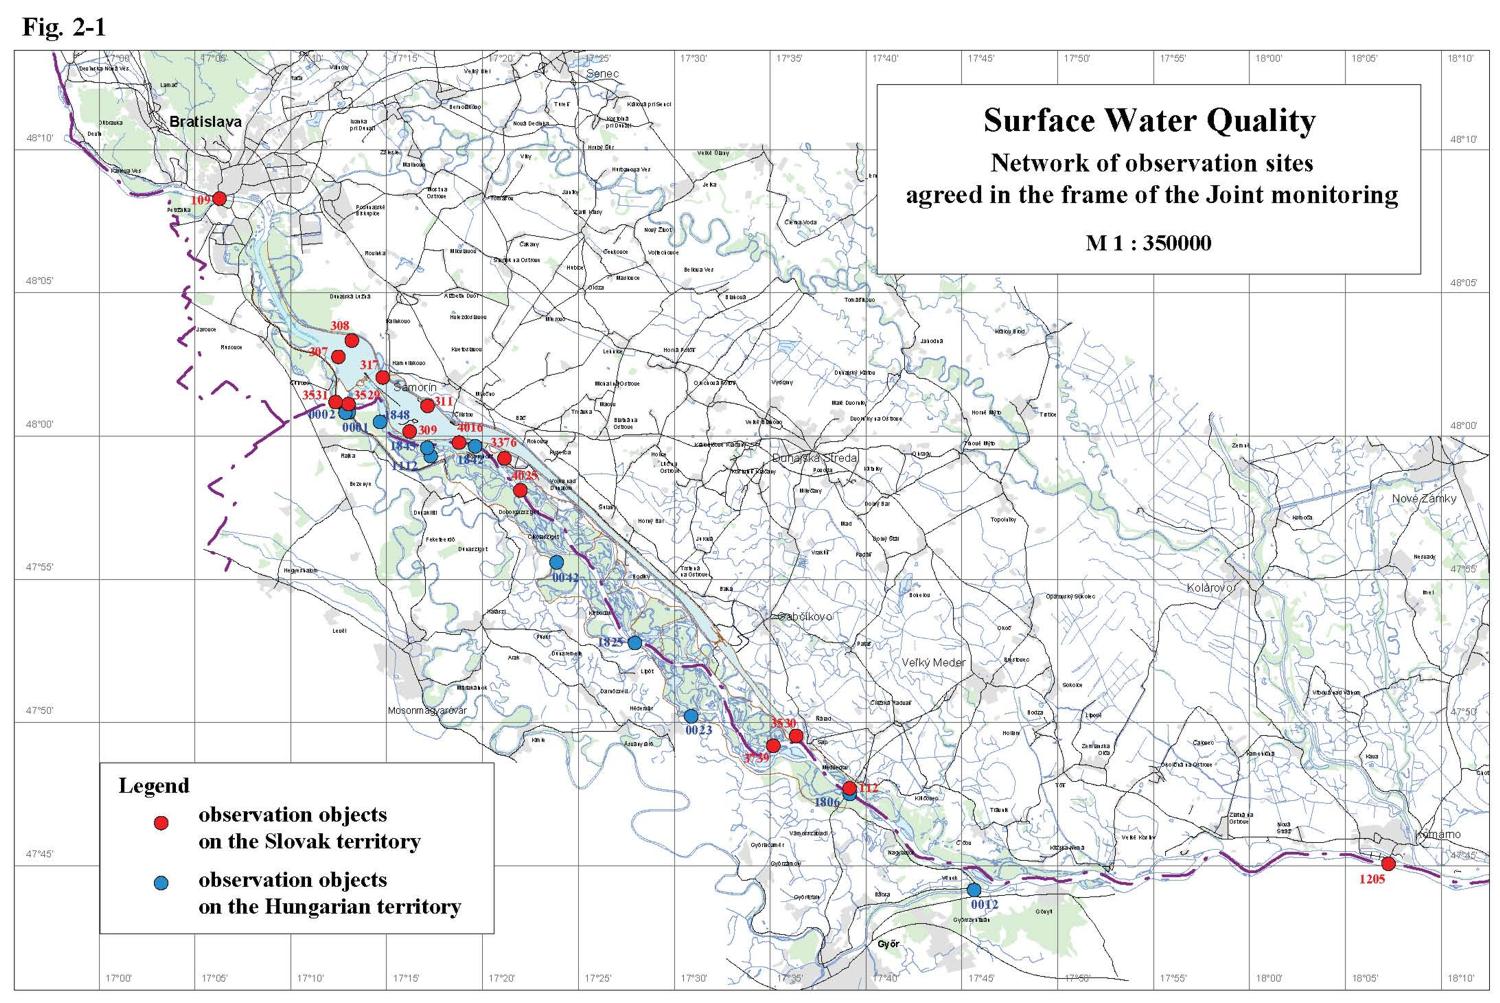
Surface Water QualityIn accordance with the Agreement surface water quality measurements in hydrological year 2005 were carried out at 15 monitoring sites on Slovak territory and at 11 monitoring sites on Hungarian territory - Table 2-1, Fig. 2-1. At all of monitoring sites the influence of measures, described in the Agreement, on surface water quality was observed. Main factors, which could influence the water quality, are: the backwater effect upstream of bottom weir, the increased discharges into the Danube downstream of Čunovo dam and into the Mosoni branch of the Danube, the water supply into the right side river arm system, and morphological changes in riverbed. Sampling and analysing were mainly performed according to the methods agreed by the Sub-commission for Water Quality Protection of the Slovak-Hungarian Trans-boundary Water Commission. Table 2-1: List of monitoring sites
Surface water quality and sediment quality data for the agreed monitoring sites, and time series diagrams for the respective parameters of the surface water quality, are given in the Annexes to the Slovak and Hungarian National Reports on the Environment Monitoring in 2005. Figures in this report present the data of selected parameters. At jointly observed monitoring sites values agreed by the Trans-boundary Water Commission were used. Jointly observed monitoring sites on the Danube are Bratislava, Rajka, Medveďov, Komárno; on the Mosoni Danube the Lock No. I at Rajka and Vének; and on the right side seepage canal at Lock No. II at Rajka. In this evaluation new limit values for surface water quality were used, as agreed at LXV. session of the Slovak-Hungarian Trans-boundary Water Commission (2003) - Table. 2-2. These limits are given in “Surface water quality observation directive for Slovak-Hungarian boundary waters and for extended water quality monitoring on the Danube”. Table 2-2: Agreed limits for surface water quality classification
2.1. General evaluation of the actual hydrological year
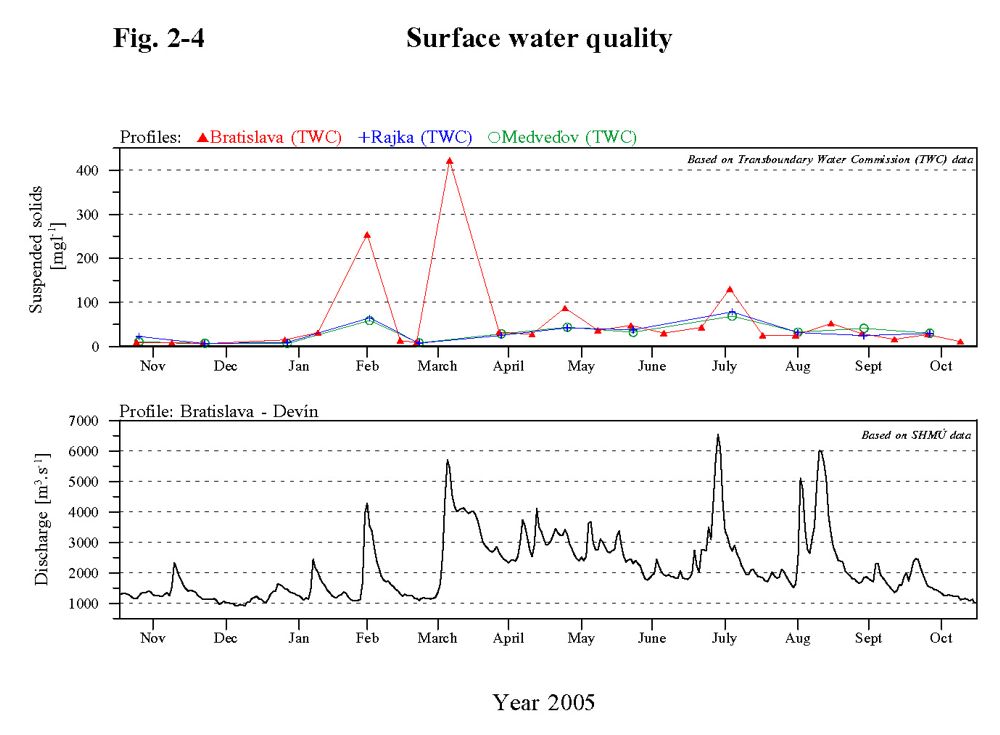
The average flow rate in the hydrological year 2005 exceeded the long-term average. In the winter period flow rates oscillated slightly over 1000 m3s-1, however several times higher discharge waves occurred. The first significant discharge wave occurred in February, when it exceeded 4000 m3s-1. The most important flood waves occurred in March, July and August. Discharges around 3000 m3s-1 were characteristic in April and May, while in June discharges oscillate around 2000 m3s-1. 2.2. Basic physical and chemical parameters
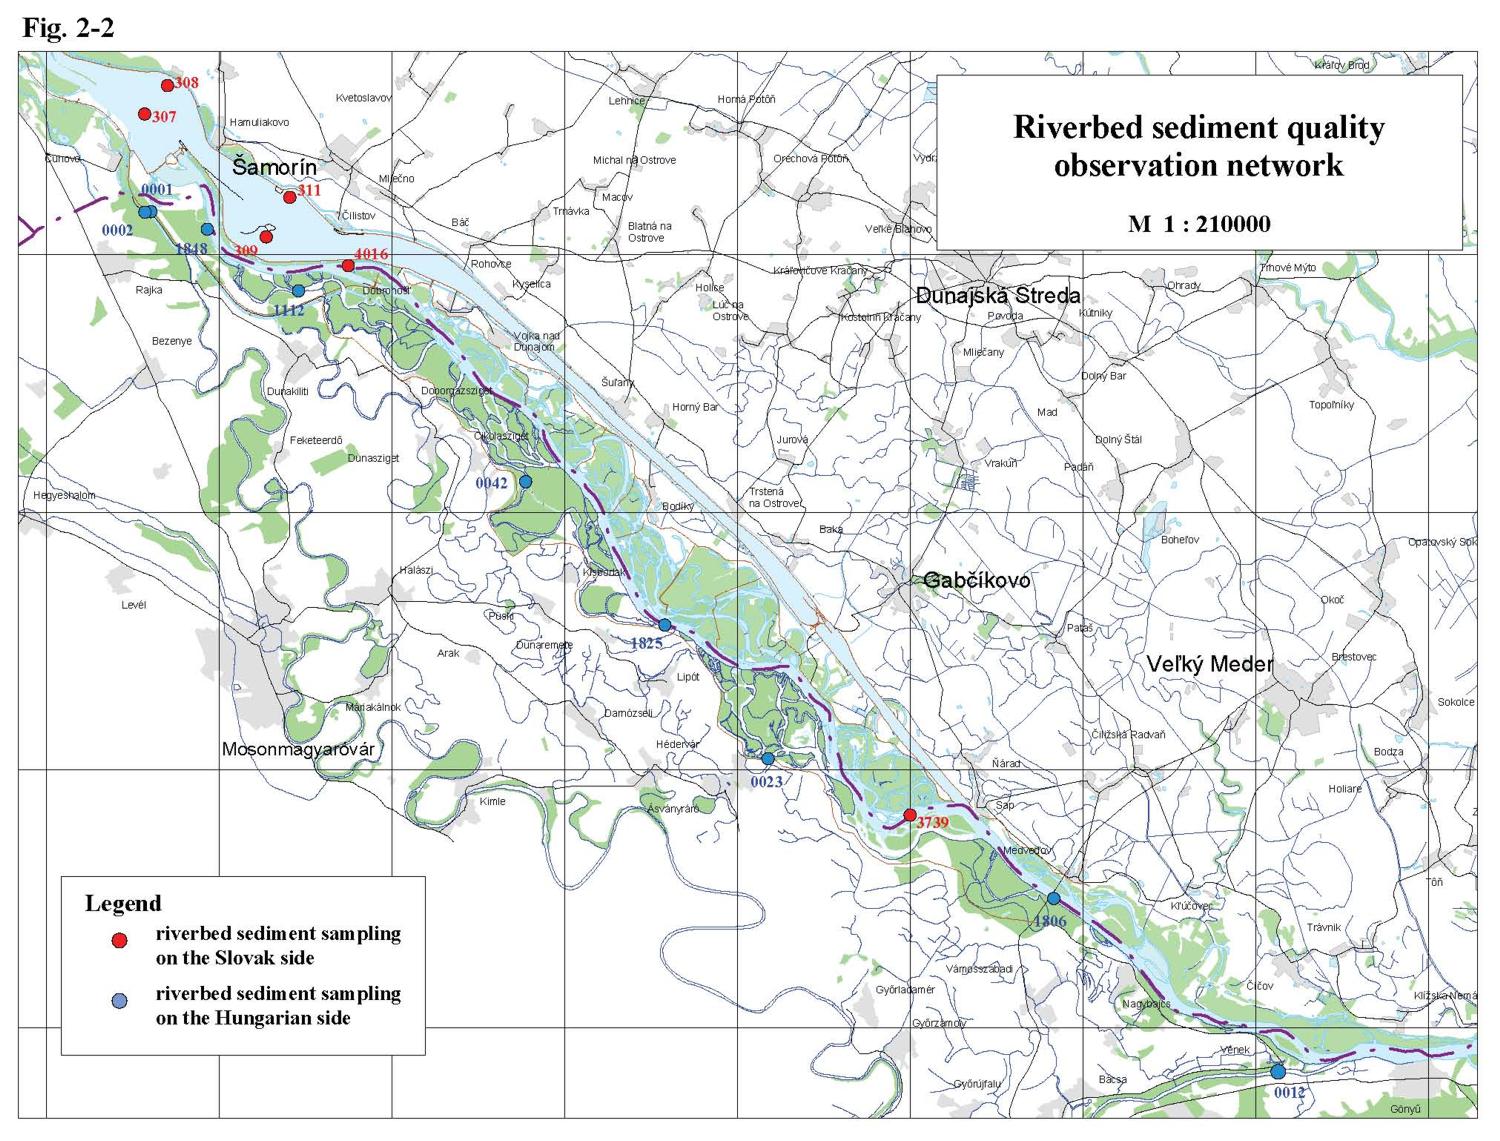
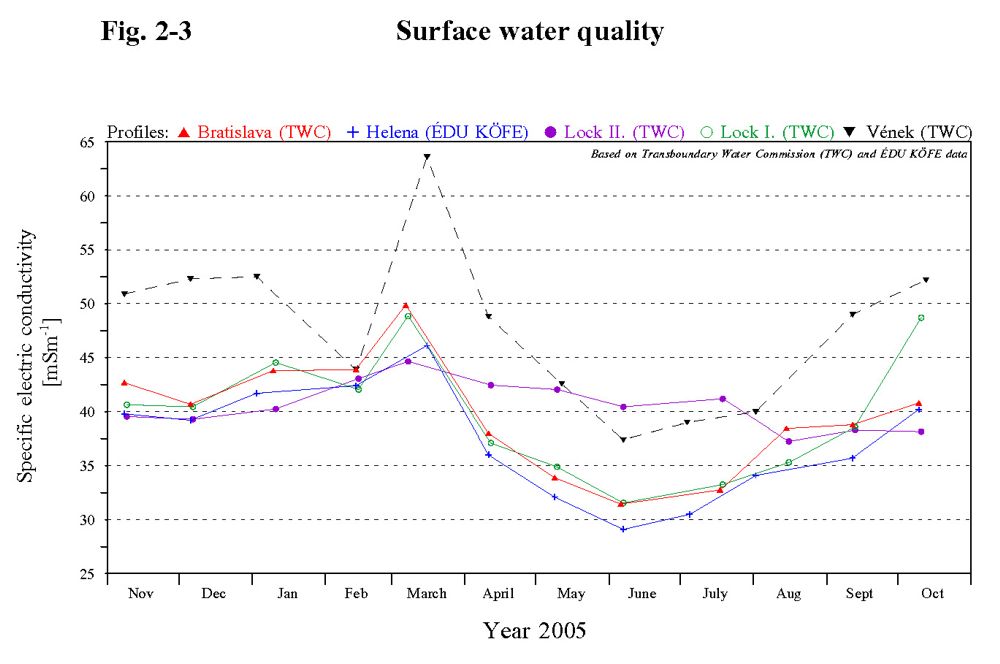
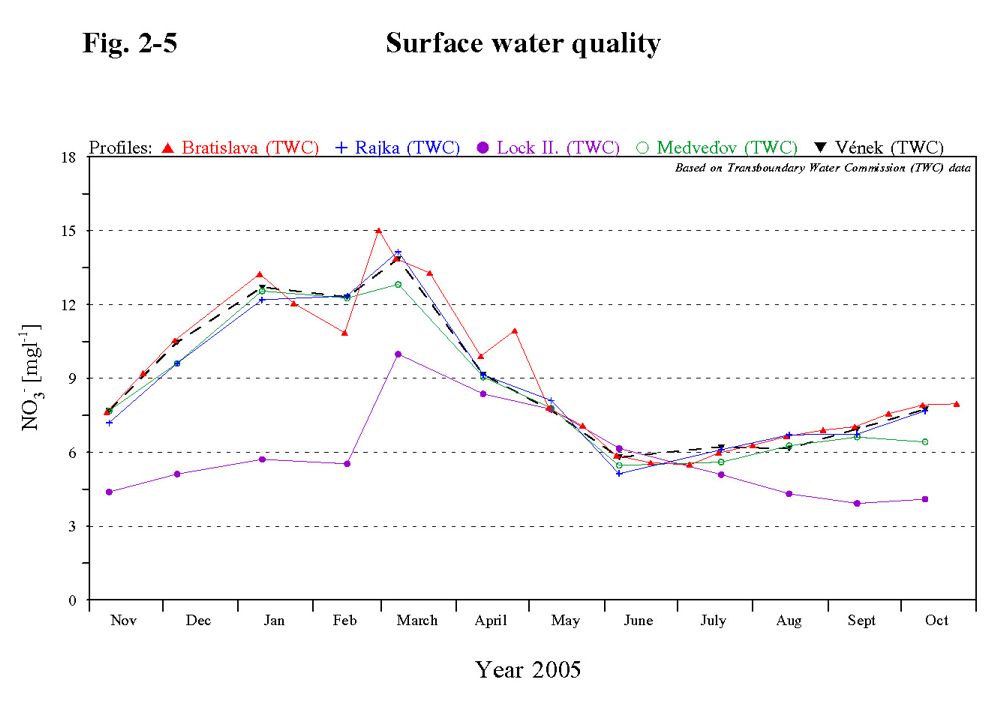
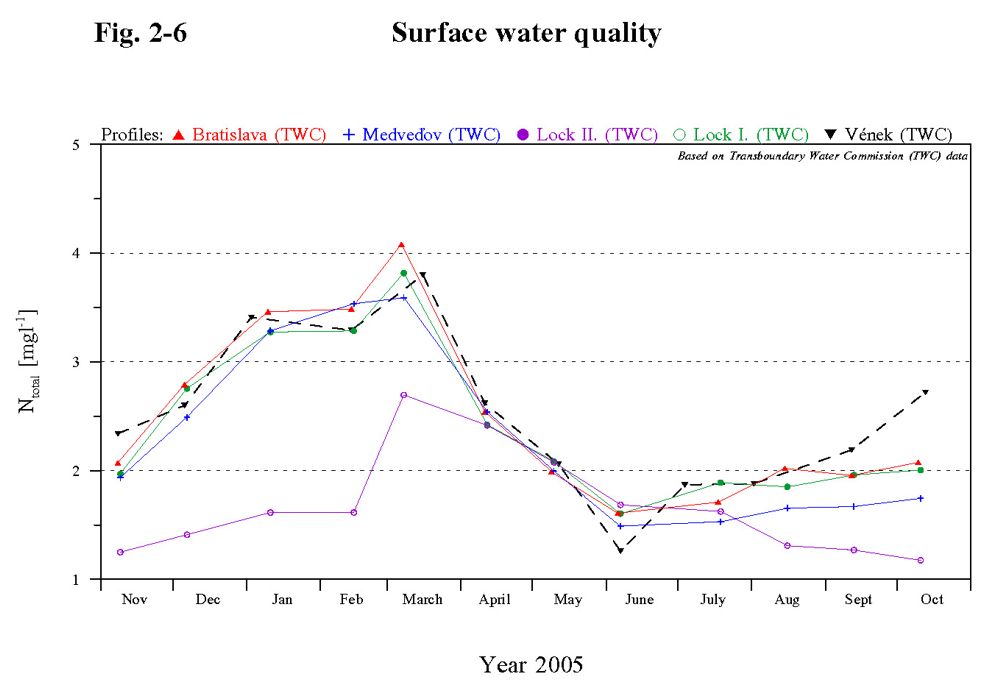
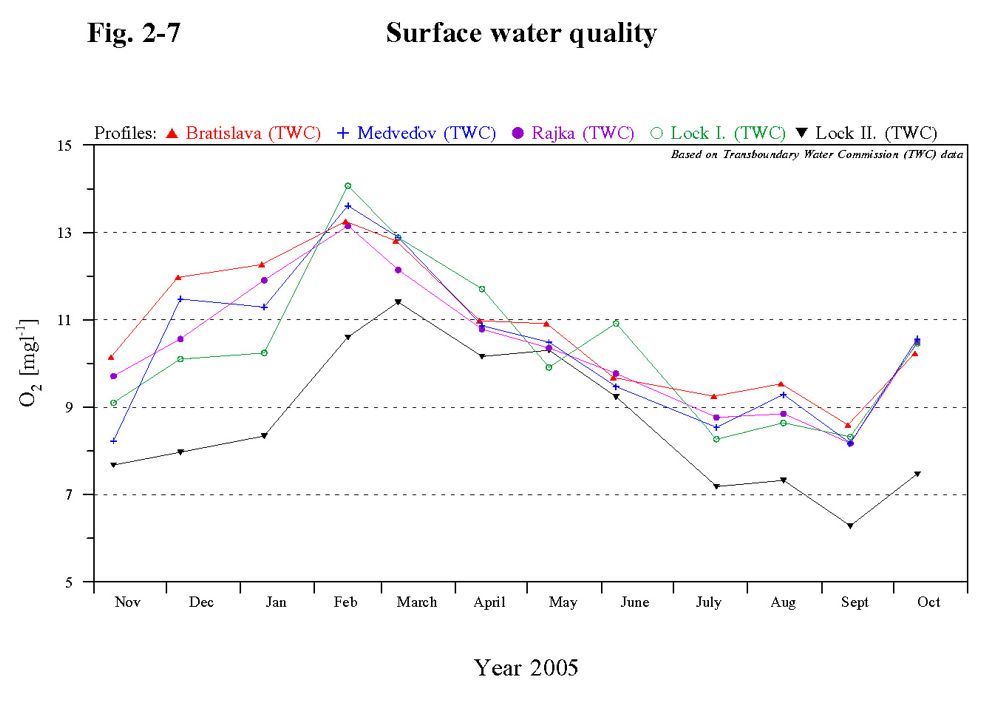
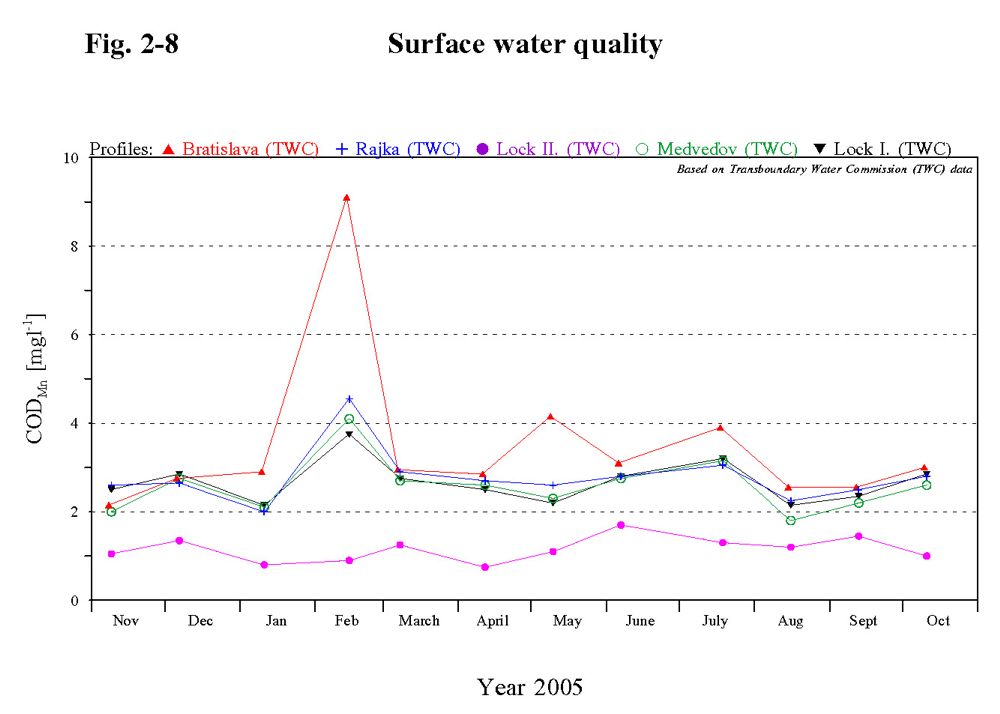
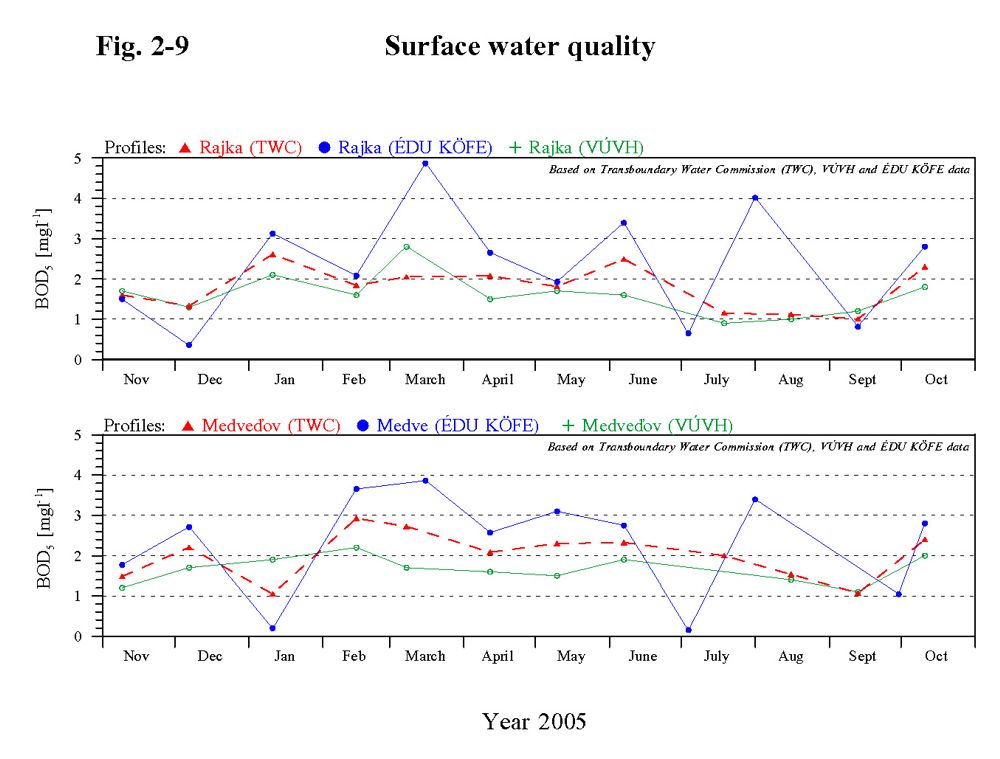
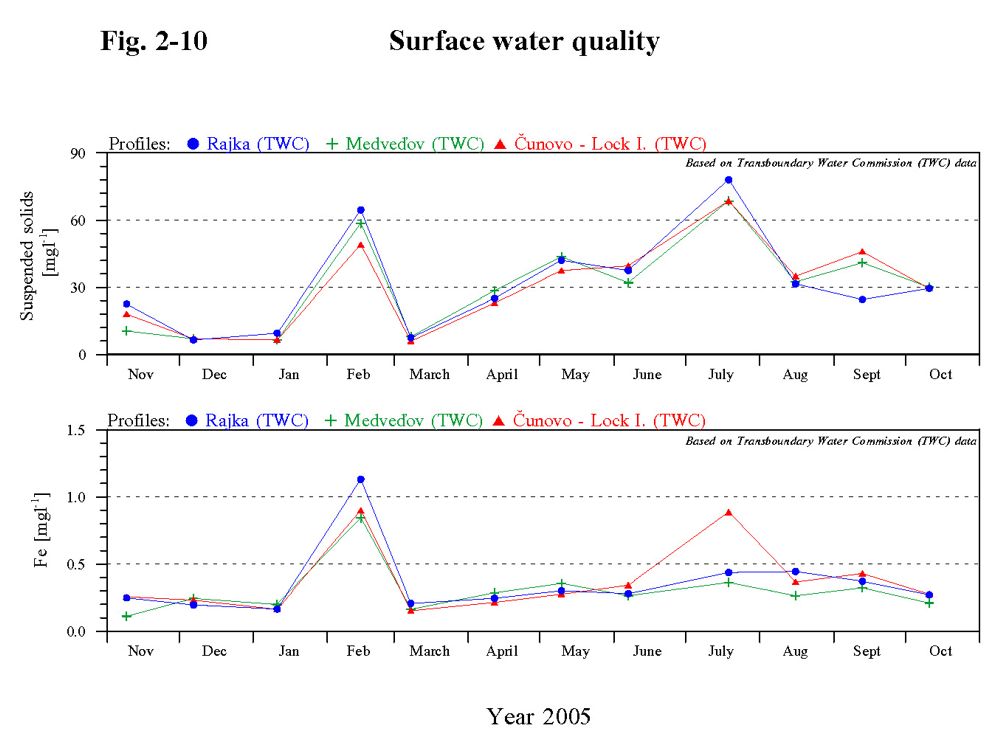
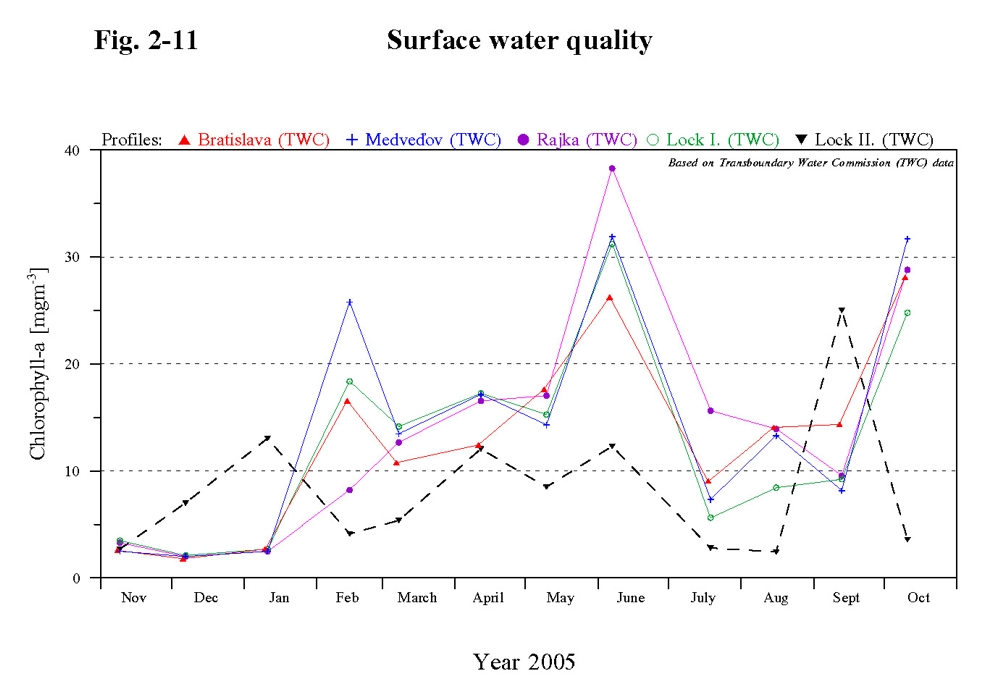
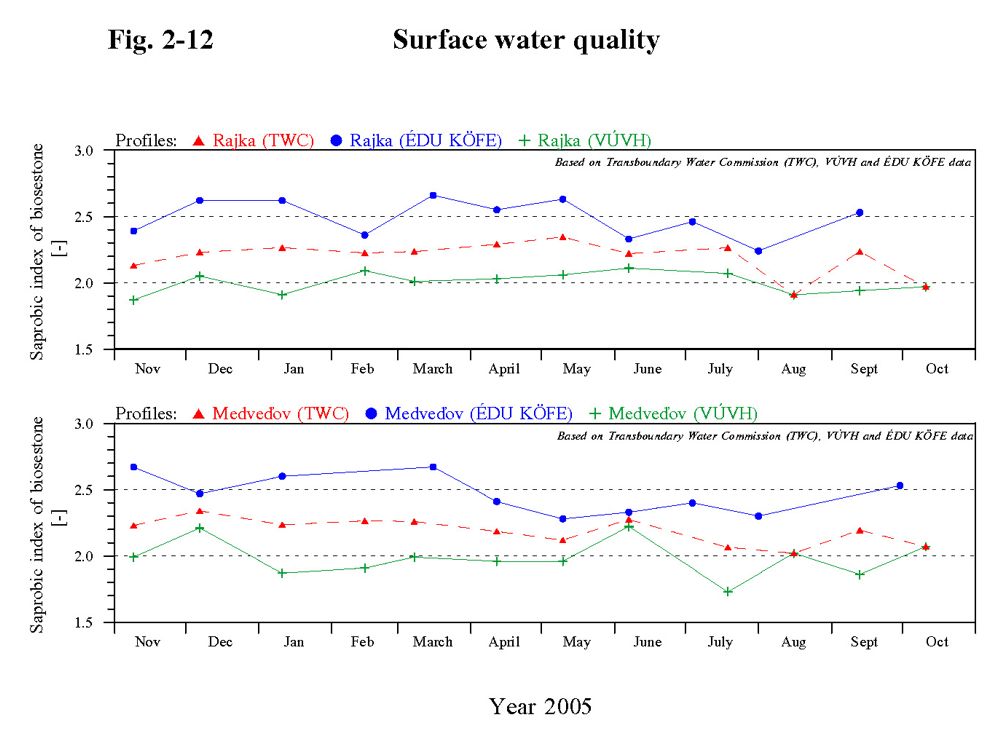
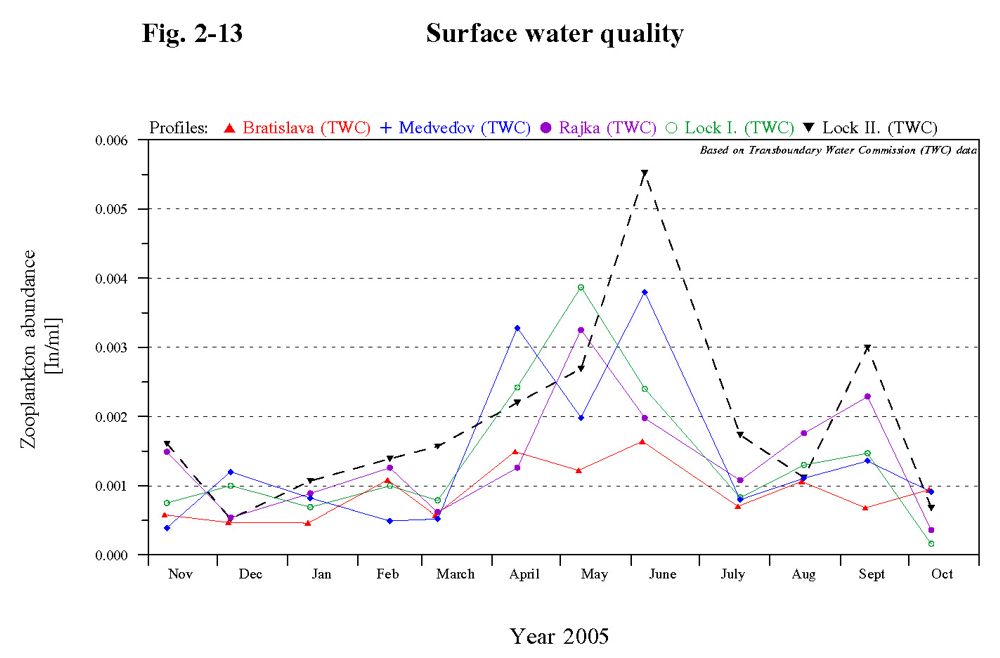
Water temperature The water temperature fluctuation in the whole Danube stretch downstream of Čunovo follows the water temperature course observed in the Danube at Bratislava (sampling site No. 109). In the actual hydrological year the water temperature in the Danube fluctuated in the range from 1.5 to 21.4 °C. Maximal values occurred in July, August and September. Minimal values were measured in February and at the beginning of March. The water temperature in the reservoir fluctuated from 0 to 22.1 °C, while the maximal values were recorded already in June. The water temperature in the seepage canal was different, just as in the previous years. In the winter period (till March) it was warmer (by 2-6 °C), and in the summer period (from June to September) it was cooler (by 2-3 °C), because the seepage canal is supplied by ground water. The water temperature in the Mosoni Danube at Čunovo sampling site was similar to the water temperature in the Danube, at Vének sampling site it was warmer and it fluctuated from 3.4 to 22.5 °C. The water in the river branch system in the winter period was cooler than the Danube water. The water temperature throughout the year fluctuated from 0.4 to 20.6 °C. pH Higher values of pH occur in seasons corresponding to periods of increased assimilation activity of phytoplankton. The Danube water pH values in the hydrological year 2005 fluctuated in the range from 7.75 to 8.45. Higher values occurred particularly during the algae growth (November 2004, February-March 2005, May-June and October 2005). The pH values in the reservoir fluctuated between 7.78-8.57. The situation at sampling sites in the reservoir (sites No. 307, 308, 309, 311) differs from that in the Danube water, particularly in the summer period, when the pH values changed in leaps. These leaps are probably connected to rapid water temperature changes, changes in phytoplankton abundance and chlorophyll content, and variation in flow velocity. The pH values in the river branch system fluctuated from 7.64 to 8.6. In the seepage canal it varied from 7.75 to 8.33. The pH values in the Mosoni Danube downstream of the intake structure at Čunovo fluctuated between 7.70 and 8.41, and upstream of the confluence with the Danube at Vének fluctuated between 7.45-8.5. Specific electric conductivity The specific electric conductivity of the surface water refers to the dissolved salts content of mineral origin. The course of specific conductivity in the Danube and in the reservoir in the hydrological year 2005 followed the conductivity values at the Bratislava profile (No. 109). The conductivity values fluctuated between 29.1 and 52.5 mS.m-1. Salinity increased from November to March, subsequently gradually decreased and the minimal values occurred in June or July. Since July and August it increased again. The course of specific conductivity and conductivity values in the Mosoni Danube at Čunovo sampling site were similar to that in the Danube water. The situation differed at Vének profile. In comparison with the other sampling sites the dissolved solids content was higher, due to the loads coming from the wastewater. The conductivity values fluctuated in the range from 37.4 to 63.6 mS.m-1. The dissolved solids content in seepage canals was stable. The electric conductivity values, similar to the previous years, fluctuated in the range from 37.3 to 47.8 mS.m-1. The specific electric conductivity at selected sampling sites is documented in Fig. 2-3. Suspended solids The suspended solids content is closely related to the flow rate. It increases at flood waves. Their mutual dependence is particularly evident at Bratislava sampling site (No. 109), where the suspended solids content fluctuated from 6 to 422 mgl-1. The highest values (422 mgl-1, 130 mgl-1, and 86.5 mgl-1) occurred during floods on the Danube – Fig. 2-4. The suspended solids content fluctuation during the hydrological year 2005 in the whole Danube stretch downstream of Čunovo follows the suspended solids content fluctuation in the Danube at Bratislava. The observed values fluctuated in the range from 2 to app. 70 mg.l-1. Increased values of suspended solids in February, March, May, July and August are connected to higher discharges in the Danube in these months. The highest maximal value was measured at sampling site No. 4025 in February – 111 mgl-1. When analysing the changes in the suspended solids content in the main riverbed it can be stated that the suspended solids content downstream of the reservoir (sampling sites No. 112 and 1806) is lower than in the Danube at Bratislava, which shows the settling effect of the reservoir. The suspended solids content in the reservoir in hydrological year 2005 reached values up to 54 mgl-1, except one value at sampling site No. 307 in February 2005, when it reached 174 mgl-1. The suspended solids content in the seepage canals, regarding the origin of water, was low and in 2005 it fluctuated from 2 to 17 mgl-1. However, in the left side seepage canal at sampling site No. 317 two higher values occurred: 52 mgl-1 in February 2005 and 33 mgl-1 in July. The suspended solids in the river branch system fluctuated between 2-74 mg.l-1, except one value of 103 mgl-1 at Helena sampling site. In the Mosoni Danube the content of suspended solids fluctuated from 5 to 68.5 mg.l-1. Basic physical and chemical parameters - summary The basic physical and chemical parameters in the Danube and in the river branch system connected to the Danube main riverbed show seasonal variations and some of them predominantly depend on the flow rate. The fluctuation of basic physical and chemical parameters in the Mosoni Danube and in the seepage canal reflects the different characteristics of these water bodies. The water quality in the Mosoni Danube is influenced by the Danube water and at Vének sampling site by its affluents and wastewater from Győr. The water in the seepage canal is influenced mainly by the leaking ground water. No significant changes in the water quality were recorded in the hydrological year 2005 in comparison with the previous year. However, suspended solids content in comparison with the previous year reached higher values, which were connected to higher flow rates in hydrological year 2005 in comparison with 2004. 2.3. Cations and AnionsThe quantitative ratio of the surface water ionic composition throughout the hydrological year 2005 showed high stability, just as in previous years. The seasonal fluctuation of individual ions content followed the changes in salinity. Changes of the dissolved solids content are related to the flow rate fluctuations in the Danube. Compared to the long-term measurements the values of basic cations and anions have not changed. The most stable ionic content was characteristic for the seepage water. Higher content of dissolved solids was recorded in the Mosoni Danube downstream of Győr. It is related to higher concentrations of sodium, potassium, chloride and sulphate ions. 2.4. NutrientsNitrates Nitrate concentrations in the hydrological year 2005 at all monitoring sites in the Danube, Mosoni Danube as well as in the right-side river branch system showed a seasonal fluctuation. Compared to the year 2004 a slight decrease of maximal values was observed. Nitrate values mainly fluctuated in the range from 1.5 to 15.8 mg.l-1. One value of 17.9 mg.l-1 was recorded in September at sampling site No. 309 in the reservoir. The lowest nitrate concentrations were characteristic for the seepage water, where nitrate content varied from 3.1 to 10.0 mgl-1. Mosoni Danube nitrate pollution at Vének decreased in comparison with previous years; nitrates content fluctuated from 3.3 to 11.7 mgl-1, and even it was lower than in the Danube (Fig. 2-5). Ammonium ion The ammonium content in 2005 varied a lot. The highest concentrations in the Danube were recorded at Bratislava sampling site (profile No. 109), where they varied in the range from 0.02 to 0.68 mgl-1, and in the Mosoni Danube at Vének (profile No. 0012), where they varied from 0.05 to 0.56 mgl-1. Compared to previous years the ammonium pollution at Vének decreases. At others sampling sites on the Danube the ammonium concentrations fluctuated from 0.01 to 0.21 mgl-1. Higher values on one occasion were recorded at sampling site No. 4025 (Dobrohošť) – 0.37 mgl-1, at sampling site No. 4016 – 0.42 mgl-1, and at sampling site No. 1842 (Dunakiliti) – 0.37 mgl-1. Ammonium ion concentrations in the reservoir were lower and varied maximally up to 0.3 mgl-1. The lowest ammonium concentration was in seepage canals, where it fluctuated from 0.02 to 0.18 mgl-1. Nitrites The nitrite ion concentrations are considered as a temporary product of nitrification and denitrification processes. Their concentrations in the Danube, in Mosoni Danube at Čunovo and in the river branch system showed a seasonal variation. They varied in the range from 0.01 to 0.13 mg.l-1, on one occasion at Bratislava sampling site in July 0.15 mgl-1 was recorded. The lowest nitrite concentrations were observed in the seepage canal and they mainly varied between 0.02 and 0.07 mg.l-1. The highest nitrite contents in the hydrological year 2005 occurred at Vének sampling point on the Mosoni Danube (0.06-0.15 mg.l-1) and they course had not a seasonal character. Total nitrogen The total nitrogen content is predominantly affected by the fluctuation of the nitrate-nitrogen and organic-nitrogen concentrations, which results from the quantitative ratio of nitrogen forms. The tendency of fluctuations of the total nitrogen in 2005 in the Danube, Mosoni Danube and in the right side river branch system was similar at all sampling sites – Fig. 2-6. In comparison to the Danube water was the total nitrogen content in the Mosoni Danube at Vének profile slightly higher. The maximal concentrations were registered in March and compared to the previous year they were slightly lower. The total nitrogen concentrations in the Danube fluctuated from 1.21 to 4.13 mg.l-1, in the reservoir from 1.16 to 4.37 mgl-1; on one occasion in February it reached a value of 5.68 mgl-1 at sampling site No. 307. In the right side river branch system and on the Mosoni Danube at Čunovo and Vének profiles the total nitrogen content varied from 1.16 to 4.2 mg.l-1. The lowest amount of total nitrogen was found in the seepage water, where the concentrations varied from 0.9 to 2.7 mg.l-1. Phosphates In hydrological year 2005 no changes were detected at observed sampling sites in comparison with the previous year. The phosphate concentrations in the Danube fluctuated from 0.03 to 0.28 mgl-1. One July value at sampling site No. 1845 upstream of the bottom weir reached 0.52 mg.l-1. The phosphate concentrations in the right side river branch system varied from 0.02 to 0.25 mg.l-1. The situation in the reservoir was similar to that in the previous year and the phosphate concentrations fluctuated from 0.03 to 0.22 mgl-1, except one February value of 0.34 mgl-1 at sampling site No. 307. The phosphate content in the Mosoni Danube at Čunovo sampling site fluctuated in the range from 0.07 to 0.22 mg.l-1. At the Vének profile the phosphates content was higher in comparison to the Danube water and varied from 0.16 to 0.56 mg.l-1. Compared to the year 2004 the phosphate pollution decreased at this sampling site. The lowest phosphate concentrations occurred in the seepage canals (from 0.03 to 0.12 mg.l-1). In general higher values of orthophosphates concentrations occur in the winter period, lower values are characteristic for the vegetation period. Total phosphorus Concentration changes of the total phosphorus followed the concentration changes of phosphates. The maximal values in hydrological year 2005 were higher than in 2004. They occurred mainly during flood waves (in February, March, April and July), because the phosphorus fixed to the suspended solids increases its concentration in the water. The total phosphorus content in the Danube mainly varied in the range from 0.05 to 0.36 mgl-1. Only on one occasion it reached the value of 0.42 mgl-1 at Dunakiliti sampling site, downstream of the bottom weir (profile No. 1842). In February one high value occurred in the reservoir as well, when it reached 0.44 mgl-1 at sampling site No. 307. The other values fluctuated from 0.03 to 0.18 mg.l-1. The total phosphorus concentration in the river branch system varied from 0.05 to 0.35 mg.l-1. In the seepage canals the total phosphorus content in the hydrological year 2005 were balanced and low: 0.02 to 0.07 mg.l-1, on one occasion in the right side seepage canal it reached 0.13 mgl-1 in April. The highest concentrations of the total phosphorus, similarly as phosphates, were reached on the Mosoni Danube at Vének, they ranged from 0.17 to 0.42. Nutrients - summary The individual nitrate forms show a seasonal fluctuation. In the hydrological year 2005 it is not valid for ammonium ion, which fluctuated a lot throughout the year at most of the sampled profiles. Seasonal fluctuation of individual parameters results from biochemical processes in the water, which are temperature dependent. Generally, decreasing tendency of pollution continues, particularly at the most polluted sampling site at Vének on the Mosoni Danube. The lowest and the most balanced nutrient values can be found in the seepage water, which results from its groundwater origin. Compared to the hydrological year 2004 no significant changes were observed in parameters from among the individual nitrate forms. The nutrient content in the Danube water is potentially sufficient for development of eutrophic processes under other suitable conditions. 2.5. Oxygen regime parametersDissolved oxygen The dissolved oxygen content proportionally decreases with increasing water temperature in the Danube. The highest values mainly occur in February and March. Besides this the dissolved oxygen content depends on the assimilation activity of phytoplankton. In the hydrological year 2005 the dissolved oxygen content at most of the monitored sites showed a seasonal character. In the river branch system and in the reservoir its content varied throughout the year. The dissolved oxygen concentrations in the Danube water varied mainly from 7.1 to 14.1 mg.l-1. Lower values were registered in July 2005 at sampling sites near Dunakiliti – 6.26 mg.l-1 (downstream of the bottom weir) and at Dunaremete – 6.15 mg.l-1. The fluctuation of dissolved oxygen is shown on Fig. 2-7. The oxygen content in the Mosoni Danube at Čunovo intake structure fluctuated from 8.3 to 14.12 mg.l-1. At Vének sampling site it varied from 7.2 to 14.8 mg.l-1, except two occasions in July and September, when the oxygen concentration reached 6.6 and 3.2 mg.l-1 respectively. The oxygen content in the reservoir varied from 8.5 to 14.4 mg.l-1, in the river branch system from 7.2 to 19.6 mg.l-1. The oxygen content in the seepage canals fluctuated from 7.2 to 13.1 mg.l-1, with one lower value of 6.28 mgl-1 in September. CODMn and BOD5 CODMn and BOD5 parameters are used for expressing the organic contamination of the water, they indicate the chemically and biologically degradable organic matter content. Higher values of CODMn and BOD5 usually occur at periods with higher flow rates in the Danube, when the water contains higher amount of natural organic matter. In the hydrological year 2005 the CODMn values at all measured profiles on the Danube and in the river branch system mainly fluctuated in the range from 1.3 to 4.8 mg.l-1. Higher values were recorded in February at three sampling sites. The maximal value 9.1 mgl-1 of CODMn was recorded at Bratislava at sampling site No. 109, at sampling site No. 4025 it was 6.2 mgl-1, and at sampling site No. 1825 it reached 5.1 mgl-1. At the same time maximal value of CODMn was recorded at sampling site No. 307 in the reservoir. The other values of CODMn content fluctuated from 1.7 to 4.0 mgl-1. The CODMn values in the Mosoni Danube at Čunovo varied from 2.2 to 3.8 mgl-1. At the Vének profile were the CODMn values higher in comparison to the other observed sites and varied in the range from 3.1 to 5.5 mg.l-1. Compared to the hydrological year 2004 the pollution at this sampling site slightly decreased. The organic matter content in the seepage canal is low in long term and in 2005 fluctuated from 0.8 to 2.1 mg.l-1 – Fig. 2-8. The BOD5 values at the Danube sampling sites varied in the range from 0.1 to 6.9 mgl-1, while there were significant differences between values measured by the Slovak and Hungarian Party – Fig. 2-9. Taking into consideration the agreed data and the data of the Slovak party the values range from 0.1 to 3.5 mgl-1. The other higher values were measured at sampling sites observed by the Hungarian Party. High values of BOD5 were measured in the right side river branch system (Hungarian territory), ranging from 0.3 to 12.0 mgl-1, while in the left side river branch system the BOD5 ranged from 0.9 to 2.5 mgl-1. The BOD5 values in the reservoir fluctuated in the range from 0.9 to 3.4 mg.l-1; in the seepage canals they ranged from 0.9 to 2.5 mgl-1. In the Mosoni Danube at Čunovo sampling site one value of 3.3 mgl-1 was detected in June, the other values varied from 1.0 to 2.8 mgl-1. The highest organic pollution throughout the year is characteristic for the Mosoni Danube at Vének, where the BOD5 values fluctuated from 0.3 to 6.0 mg.l-1. Oxygen regime parameters - summary The dissolved oxygen content remained preserved on the level of previous years. A slight increase was connected with the winter floods. After a temporary slight increase in 2001-2002 the CODMn values decreased and in the years 2003-2005 fluctuates below the long-term average. Compared to the previous hydrological year 2004 the maximal values of BOD5 at several sampling sites in 2005 in the right side river branch system and at sampling sites on the Danube, observed by the Hungarian Party, increased. Considering this parameter there are significant differences between Slovak and Hungarian values at jointly observed sampling sites as well. The oxygen related parameters in the Danube reflect the seasonal assimilation activity of the phytoplankton and organic carbon oxidation processes. The measured data (1992-2005) indicate decreasing tendency of organic load at the Bratislava section of the Danube, which is related to the substantial wastewater treatment improvement in the upstream Danubian countries. From the organic pollution point of view the less polluted water is the seepage water. The most polluted is the sampling site on the Mosoni Danube at Vének, due to local pollution originating from city Győr together with hydrological conditions at confluence with the Danube. Compared to the previous year the water quality at this sampling site improved. 2.6. MetalsIron The amount of suspended solids influences the iron content in the surface water. The mutual coherence of iron concentrations and suspended solids content in surface water is documented by the highest concentrations of iron measured at the time of highest suspended solids content – Fig. 2-10. The suspended solids content follows the flow rates therefore higher iron content occurred in samples taken during flood waves. The iron concentrations in hydrological year 2005 in the Danube mostly fluctuated in the range from 0.01 to 0.57 mgl-1. Several higher values were recorded during higher flow rates. At Bratislava (sampling site No. 109) they occurred in February with a maximum value of 2.26 mgl-1, in July 0.98 mgl-1 and in September 0.82 mgl-1. In the right side river branch system the iron concentrations fluctuated in the range from 0.01 to 0.94 mgl-1. In the reservoir the iron content varied from 0.08 to 0.56 mgl-1, however similarly to the sampling sites on the Danube higher values occurred in February, when they increased up to 2.0 mgl-1. In Mosoni Danube at Čunovo and Vének sampling sites the iron concentrations fluctuated from 0.17 to 1.15 mg.l-1. Compared to the previous year the iron content at Vének decreased. The lowest iron concentrations were characteristic in the seepage water, where they fluctuated from 0.04 to 0.32 mg.l-1. Manganese Manganese occurs in surface water mainly in a solid phase. The manganese content, similarly to iron, increased during flood waves, corresponding with higher amount of suspended solids. The manganese concentrations in the Danube mostly fluctuated in the range from 0.02 to 0.21 mg.l-1. The manganese concentrations in the Mosoni Danube at Čunovo and Vének sampling site reached values up to 0.14 mg.l-1. In the right side river branch system the manganese content in 2005 varied from 0.02 to 0.12 mg.l-1; in the left side river branch system it fluctuated up to 0.06 mgl-1. The manganese content in seepage canals varied in the range from 0.01 to 0.14 mg.l-1. Heavy metals The joint monitoring from among metals includes zinc, mercury, arsenic, copper, chromium, cadmium and nickel. The courses of heavy metal concentrations in the hydrological year 2005 were similar as in previous years. Since the quality limits for water quality classification were changed the evaluation compared with the previous years is more unfavourable. Limits were approximately lowered by an order. The concentration of most of the observed heavy metals in previous years corresponded to the I. class of surface water quality. An exception was the mercury, where the detection limit on the Slovak and on the Hungarian side as well corresponded to the II. and III. classes of surface water quality. Since the new quality limits were introduced the same situation came up for every heavy metal. The detection limits often correspond to the II. and III. classes of surface water quality, in case of zinc to the IV. quality class. 2.7. Biological and microbiological parametersColiform bacteria The number of Coliform bacteria can determine the surface water bacteriological pollution. In the hydrological year 2005 continued a slight decrease of number of Coliform bacteria, which was observed in 2004. The number of Coliform bacteria in the Danube mainly varied up to 92 NrC.ml-1. Throughout the year higher values were recorded at some of the sampling places. The highest value of 452.5 NrC.ml-1 was recorded at Komárno in August, at Bratislava it was 145 NrC.ml-1 in February and 290 NrC.m-1 in June, and at Dunakiliti, upstream of the bottom weir it was 160 NrC.ml-1 in July. In the reservoir the number of Coliform bacteria varied from 1 to 44 NrC.ml-1. The situation in the Mosoni Danube at the Čunovo sampling site is similar to that in the Danube. The bacteriological pollution of the river branch system is lower and varied in the range from 1 to 32 NrC.ml-1. Higher values were detected at Helena sampling site, where 56 NrC.ml-1 was recorded in May, 70 NrC.ml-1 in June, and 140 NrC.ml-1 was recorded in September. Similarly to the previous year further improvement was observed in microbiological parameters along the flow path in the right side river branch system downstream of influent section. The seepage canals were found as the cleanest from the bacteriological point of view, the number of bacteria ranged up to 5 NrC.ml-1, except one value of 13.5 NrC.ml-1 in the right side seepage canal. The Vének sampling site on the Mosoni Danube was found as the most polluted one, resulting from the partially cleaned wastewater from Győr. The number of Coliform bacteria varied from 19 to 5000 NrC.ml-1. Chlorophyll-a The chlorophyll-a concentrations refer to the quantity of phytoplankton and provide information about the eutrophic state of water. The growth of algae on the respective section of the river is represented by the relative increase of chlorophyll-a concentration between two compared profiles. In the hydrological year 2005 the maximal values of chlorophyll-a decreased in the Danube water. The spring algae growth occurred from February to June and the maximal value reached 47.7 mg.m-3. Since then the chlorophyll-a concentration gradually decreased and higher values were recorded again in October - Fig. 2-11. The situation in the reservoir differs from the sampling sites on the Danube. The variability of mass development of phytoplankton and the culmination of chlorophyll-a content at individual sampling points in the reservoir is related to the local hydrological and climatic conditions. The chlorophyll-a content in the reservoir varied up to 55 mg.m-3 and during the year three waves of culmination occurred – May-June, August and October. However, local maximums occurred on individual sampling points during other months as well. In the river branch system three waves of culmination occurred as well (March, June and October). However at Helena sampling point they were not so noticeable. The chlorophyll-a concentrations were higher in comparison with the Danube water and varied in the range from 2 to 71 mg.m-3. Increase of maximums was recorded especially in October – 111.3 mg.m-3 in the Ásványi river arm and 145.6 mg.m-3 at the Szigeti river arm. The amount of chlorophyll-a in the Mosoni Danube at the Vének profile was higher than in the Danube. Values varied from 2.4 to 97.1 mg.m-3. The chlorophyll-a concentration in the seepage water remained low and fluctuated from 0.6 to 13.1 mg.m-3, however one higher value of 25 mg.m-3 was recorded in September in the right side seepage canal. Saprobic index of biosestone The saprobic index represents the self-purification ability of water, the ability to degrade organic pollution. The saprobic index in relation to the respective stretch of river also represents the water quality in the river. The saprobic index of biosestone in the hydrological year 2005 in the Danube, Mosoni Danube, and the reservoir varied in the range from 1.9 to 2.4; in seepage canals it fluctuated from 1.6 to 2.4, which correspond to beta-mezosaprobic state. The self-purification processes, at this level of the saprobic index, run mainly as oxidising processes. Higher values, which represent alpha-beta-mezosaprobic state, were recorded on the Mosoni Danube at Vének (2.4-2.8) and in the right side river branch system (2.2-2.7). Contrary to this in the left side river branch system the saprobic index varied in the range from 2.0 to 2.3. Time series data of saprobic index indicated slightly decreasing tendency approximately till the year 2000. In last five years was the course of saprobic index values balanced. The saprobic index at selected sampling sites is documented in Fig. 2-12. Other biological parameters Phytoplankton Low values of the phytoplankton abundance occurred in January – minimum of 130 NrC.ml-1 was recorded at Komárno sampling site (No. 1205). Contrary to the year 2004 high values were recorded only in June – maximum of 13792 NrC.ml-1 at Rajka. After heavy rains and temperature dropping in July significant decrease of phytoplankton abundance was observed. Next increase came up in autumn, when sunny and warm weather remained, and the abundance reached 18925 NrC.ml-1 at Rajka. The situation in the reservoir was similar to the situation on the Danube. The highest value of 20378 NrC.ml-1 was recorded at sampling site No. 308. The amount of phytoplankton in Mosoni Danube followed the changes in the Danube. The highest values of phytoplankton abundance were observed at Vének, where they ranged from 1903 to 21870 NrC.ml-1. The algae growth at this sampling place was partly influenced by the hydro-morphological characteristic, which differ from those of the upper section, and partly by nutrients delivered by the partially treated wastewater from the city of Győr. Significant algae growth in the right side river branch system was detected in October, when the maximal value at the Szigeti river arm reached 19113 Nr.Cml-1. Low abundance of phytoplankton was characteristic for the seepage water throughout the year, where it ranged from 160 to 3006 NrC.ml-1. Higher values were recorded in May, when it reached 10833 NrC.ml-1. The diatoms of Bacillariophycea-Centrales represented the dominant group of the phytoplankton in the Danube water in 2005 (Aulacoseira, Cyclotella, Skeletonema, Cyclostephanos, Stephanodiscus families). From among the Bacillariophycea-Pennales the Cymbella, Diatoma, Gomphonema, Fragilaria, Navicula and Nitzschia families, and from among the green algae group (Chlorophyta) the Actinastrum, Coelastrum, Dictyosphaerium, Micractinium, Monoraphidium, Pediastrum, Scenedesmus and Chroomonas families. In the reservoir the Cyclotella, Stephanodiscus, Skeletonema, Nitzschia and Scenedesmus families were dominant. The composition of phytoplankton in the river branch system was similar to the composition found in the Danube, however, higher species diversity was characteristic. In the Mosoni Danube in the stretch downstream of Győr eutrophic species were more abundant. The species composition in seepage canals was the poorest in species diversity and in abundance as well. Zooplankton The total number of zooplankton individuals in the Danube varied in the range from 36 to 890 individuals in 100 litres (In/100 l). The highest abundance was found at Dunaremete (sampling site No. 1825). Maximal abundance at all sampling sites occurred in June, except the sampling site at Rajka, where it occurred in May. The zooplankton abundance was significantly lower in comparison to the previous years, however the tendency of continuous increase on the stretch from Bratislava to Komárno remained. The zooplankton abundance in the seepage canal varied from 52 to 552 In/100 l. Maximal values occurred in June and in September it exceeded the species abundance in the Danube. The abundance in the Mosoni Danube at Čunovo varied from 16 to 387 In/100 l, at Vének was little bit higher and varied from 170 to 656 In/100 l. Compared to the previous two years the abundance in seepage canals and in the Mosoni Danube was lower, similarly to the abundance in the Danube. The zooplankton abundance at selected sampling sites is shown on Fig. 2-13. The zooplankton species diversity in the Danube increases downstream from Bratislava to Komárno. From among the Rotatoria group the Brachionus angularis, Brachionus calyciflorus, Brachionus surceolaris, Keratella cochlearis, Keratella cochlearis var. tecta, Keratella quadrata, Notholca squamula and Polyarthra vulgaris were found at the observed river stretch. From among the Cladocera group the species Bosmina longirostris and Chydorus sphaericus, and from among the Copepoda group the species Acanhtocyclops robustus occurred. The total number of individuals in the right side river branch system varied in the following ranges: At Helena sampling site from 162 to 320 In/100 l, at the Szigeti river branch from 196 to 644 In/100 l, and at the Ásványi river branch from 430 to 1406 In/100 l. The zooplankton species composition and abundance was similar to that in previous two years. In the species composition of the river branch system the Keratella cochlearis tecta, Keratella cochlearis, Polyarthra vulgaris, Brachionus budapestinensis species from among the Rotatoria group, the Bosmina longirostris, Chydorus sphaericus species from among the Cladocera group and Acanthocyclops robustus species from among the Copepoda group dominated. The zooplankton abundance in the reservoir reached the highest values, and varied in the range from 50 to 9315 In/100 l. Maximal values were recorded in June. The species of the Rotatoria group (mainly the Keratella, Brachionus, Polyartha, Filinia, Asplanchna species), less the Copepoda group (juveniles) and Cladocera group(Bosmina longirostris, Daphnia cucullata and Alona species) were dominant. Macrozoobenthos The faunistic results of aquatic macroinvertebrate communities of the Danube and reservoir remained very similar to those of previous years. At most of the monitored sampling sites mainly Danube species of aquatic molluscs occurred in the evaluated year – Mollusca (Corbicula fluminea, Dreissena polymorpha), Malakostraca (Corophium curvispinum, Dikerogammarus bispinosus, Jaera istri, Obesogammarus obesus), Chironomidae, Annelida (Dina punctata, Hypania invalida, Limnodrilus hoffmeisteri) and Trichoptera (Brachycentrus subnubilus). The water supply into the right side river branch system has stabilised since 1995, which was reflected in increase of species diversity. The results show that in the inspected water bodies a decrease of taxons typical for stagnant water is characteristic, while evident spreading of rheophile taxons is observed. The most abundant species in the river branch system were Dikerogammarus villosus, Corophium curvispinum, Limnonysis benedeni, Obesogammarus obesus, Chironomidae gen. sp. The saprobic index values in the Danube in the longitudinal profile from Bratislava to Komárno correspond to beta-mezosaprobic state, which is typical for this stretch of the river. The average saprobic index values in 2005 varied from 2.02 (at Dobrohošť) to 2.56 (at Medveďov). Contrary to the previous year worsening of saprobic index values were recorded at Bratislava and Medveďov sampling sites in October, which corresponded to alpha-mezosaprobic state. The saprobic index in the reservoir varied in the range from 2.07 to 2.72. The saprobic index at sampling sites No. 307 and 308 correspond to beta-mezosaprobic state, at sampling sites No. 309 and 311 it reaches alpha-beta-mezosaprobic state. Compared to the previous hydrological year a slight improving of saprobic index of macrozoobenthos was observed in the reservoir. The other aspects of development of macrozoobenthos communities are evaluated in Part 7 – Biological monitoring (Cladocera, Copepoda, Mollusca, Odonata, Ephemeroptera, Trichoptera). Periphyton Samples were taken three times during the hydrological year. Particularly the algae part of the periphyton was observed. Based on the obtained results it can be stated that the saprobic indexes of periphyton on every sampling site in long term, and in 2005 too, varied in the range of beta-mezosaprobic state. In the periphyton communities the diatoms dominate (Navicula, Nitzschia, Fragilaria, Cymbella, Gomphonema, Achnanthes, Amphora species, etc.). 2.8. Quality of sedimentsIn the hydrological year 2005 the Slovak and Hungarian Parties have realized unified evaluation of sediment quality for the first time. At the negotiation held in Győr on May 18, 2005 the experts of both Parties have agreed, that until harmonization of legislation in EU the “Canadian Sediment Quality Guideline for Protection of Aquatic Life” (CSQG) published in 1999, revised in 2002 will be used for sediment quality evaluation. The sediment sampling in the frame of the Joint Monitoring by the Slovak Party was carried out in September and October 2005. The Hungarian Party sampled the sediments twice, in April and in September. The situation of sampling sites is shown on Fig. 2-2. Besides the inorganic and organic micro components the total phosphorus and total nitrate content were analysed. From among the inorganic micropollutants seven heavy metal were analysed: zinc, mercury, cadmium, chromium, lead, copper, arsenic (only by the Slovak party), nickel (only by the Hungarian Party). According to the “Canadian Sediment Quality Guideline for Protection of Aquatic Life” the content of heavy metals in sediments at observed sampling sites on the Slovak territory did not exceeded the limits of Probable Effect Level (PEL) in any case. When the content of some parameter exceeds the PEL level, unfavourable impact on biological life (more than 50%) can by expected frequently. The sediments on the Hungarian territory were taken in the spring and in autumn. The result in the case of spring samples corresponded to the result obtained on the Slovak side. In the case of autumn samples most of the obtained values were lower than the Threshold Effect Level (TEL). TEL represents a concentration, when the unfavourable influence on biological life is not expected, it occur rarely at les than 25% and correspond to an uncontaminated natural environment. However, in case of mercury (at sampling sites on the Danube at Medve, on the Mosoni Danube at Vének and in the Ásványi river branch) and in case of zinc (at sampling sites on the Danube at Rajka, Dunaremete and Medve, on the Mosoni Danube at Lock No. I) the obtained results exceeded the Probable Effect Level. From among the organic micropollutants the fluorine, dibenzo(a,h)anthracene, naphthalene, pyrene, acenaphtylene, phenanthrene, anthracene, fluoranthene, benzo(a)anthracene, chrysene, benzo(a)pyrene were analysed on both sides. Moreover the lindan, heptachlorine, endrine and dieldrine were analysed on the Slovak side. The benzo(b+k)fluoranthene, indeno(1,2.3)pyrene and benzo(ghi)perylene were analysed on the Hungarian side, however these components have no TEL and PEL values specified in the CSQG. In case of the organic micro pollutants the sediments on the Slovak and Hungarian sides in hydrological year 2005 did not exceeded the PEL level in any case. The recorded concentrations in most cases varied below the TEL level, when no unfavourable influences on the biological life are expected. There were recorded concentrations slightly exceeding this level in some cases, which represented the potential possibility of ecotoxicological impacts. On the Hungarian side the total phosphorus and total nitrate content in sediments was analysed as well. The total phosphorus content varied from 217 to 1514 mg.kg-1, and the highest value was measured at the Ásványi river branch. The total nitrogen content reached values up to 4710 mg.kg-1. The highest values were measured in the spring sample at Ásványi river branch and in the autumn sample on the Mosoni Danube at Vének. 2.9. Differences in the data measured by the Slovak and Hungarian PartiesThis chapter is dealing with differences between Slovak and Hungarian data in surface water quality parameters at jointly monitored sampling sites and with results reached in elimination of these differences. In hydrological year 2005 the common dates of sampling were not kept at Rajka and Medveďov in March, July, and August, in case of Medveďov sampling site in September as well, so the obtained data were not included to comparison. In the evaluation of the previous hydrological year a good concordance was reached in a major part of examined parameters. However, there still existed parameters where the individual values measured by one of the Parties were different. Based on the results achieved in the year 2005 it can be stated that at sampling sites, which were sampled at the same time and at the same place, no changes were found compared to the previous year. Continually persist differences where the individual values of parameters measured by one of the Parties are higher or lower than values determined by the other Party (e.g. pH, manganese, iron, phosphates, BOD5). In case of other parameters, like saprobic index, specific electric conductivity, ammonium, sulphates, chlorides, CODMn and Coliform bacteria, the course is similar, but the values are either higher or lower at one of the Parties. Samples are shown on Figs. 2-9 and 2-12. Separate group are the heavy metals where either the detection limit significantly differs (e.g. Cd, Cr, Zn) or there are differences in measured values (e.g. Cu, Ni. Hg, As). 2.10. ConclusionsBased on the long-term evaluation it can be stated, that the Danube water quality generally improved. Improvement of surface water quality was already observed at Bratislava profile (109), which represents the entering water quality. The better surface water quality consequently influences the water quality in the territory influenced by temporary measures, realised according to the Agreement. Compared to the previous period no significant changes in surface water quality were detected in the hydrological year 2005. Increased values of some parameters in the Danube were related to higher flow rates in the Danube occurring during flood waves. The fluctuation of water quality parameters in the right side river branch system follows their fluctuation in the Danube since introducing the water supply in 1995. The tributaries and local pollution of settlements, besides the water supply influence, form the water quality in Mosoni Danube. Before the confluence with the Danube the water quality state is variable in time, which is proved by unfavourable values of some parameters (electric conductivity, dissolved solids, Coliform bacteria, chlorophyll-a, CODMn, BOD5, nutrients and saprobic index). Compared to the previous years the water quality improved, thanks to investments realized in the water treatment plant. The cleanest water was found in the seepage canals, which results from its groundwater origin. In the following table Tab. 2-3, orientational classification of selected sampling sites into the quality groups was done. The classification was done according to new trans-boundary water quality criteria are given in “Surface water quality observation directive for Slovak-Hungarian boundary waters and for extended water quality monitoring on the Danube”. Table 2-3: Orientational classification of parameters or group of parameters according to the agreed limits for surface water quality classification
* all the data below the detection limit ** most of the data below the detection limit The quality classes are determined according to the 90 % durability of measured values (C90). This classification does not differentiate according to the specific conditions when the respective values were recorded (e.g. hydrological conditions – floods, high or extremely low flow rates, oscillation of parameters). The given orientational classification gives only a comparison of the water quality inflowing to the influenced area (sampling site at Bratislava) and the water quality leaving the influenced region (sampling site at Medveďov). The classification of the sampling sites in the Danube old riverbed and sampling sites on the Mosoni Danube, right side river branch system and in the seepage canal were done in a similar way. Part of the observed parameters shows a seasonal fluctuation, which consequently influences the categorisation into a water quality class. In case that a range of classes are given (e.g. I-II) it represents natural seasonal fluctuation of individual parameters or dependence on climatic conditions. The water quality class in brackets means that measured value of the respective parameter reached the given water quality class, but it occurred once, maximally two times in a hydrological year or during flood events. From the above given table is clear, that the quality of water entering the hydropower system and the quality of water leaving the system is very similar or even slightly better
|
|||||||||||||||||||||||||||||||||||||||||||||||||||||||||||||||||||||||||||||||||||||||||||||||||||||||||||||||||||||||||||||||||||||||||||||||||||||||||||||||||||||||||||||||||||||||||||||||||||||||||||||||||||||||||||||||||||||||||||||||||||||||||||||||||||||||||||||||||||||||||||||||||||||||||||||||||||||||||||||||||||||||||||||||||||||||||||||||||||||||||||||||||||||||||||||||||||||||||||||||||||||||||||||||||||||||||||||||||||||||||||||||||||||||||||||||||||||||||||||||||||||||||||||||||||||||||||||||||||||||||||||||||||||||||||||||||||||||||||||||||||||||||||||||||||||||||||||||||||||||||||||||||||||||||||||||||||||||||||||||||||||||||||||||||||||||