PART 5
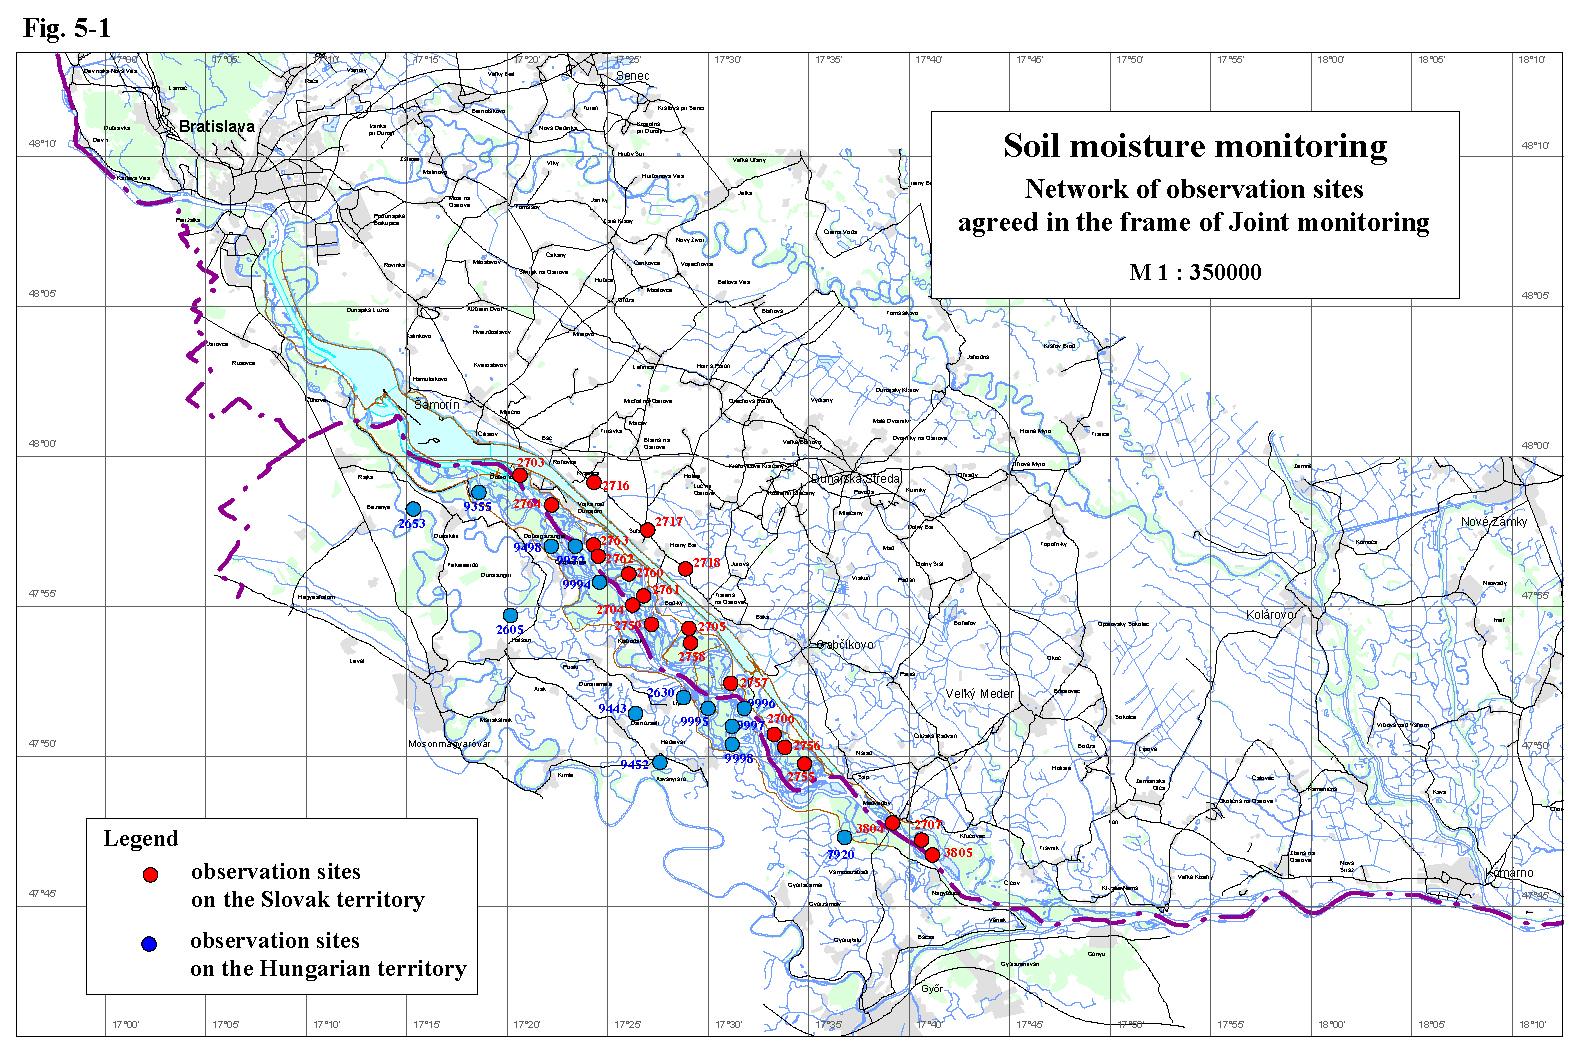
Soil Moisture Monitoring5.1. Data collection methodsThere were no changes in the soil moisture monitoring in the hydrological year 2004 and it was performed according to the intergovernmental Agreement. The measurements on both sides were done in the same way as in the previous years. The Slovak side measures the soil moisture by a neutron probe. The measurements are performed down to a prescribed depth or to the depth of the ground water level. The Hungarian side carried out the measurements with a capacity probe to the depth of 2 m. The soil moisture on both sides is expressed by the total soil moisture content in volume percentage recorded in 10 cm depth interval for each measurement during the year. Measurements on the Slovak side were performed on 12 forest monitoring areas, on 5 biological monitoring areas and on 3 agricultural areas – Tab. 5-1. Measurements on the Hungarian side were performed on 9 forest monitoring areas and 5 agricultural areas - Tab. 5-2. The situation of observation objects is shown on Fig. 5-1. Table 5-1: List of monitoring stations on the Slovak side
Table 5-2: List of monitoring stations on the Hungarian side
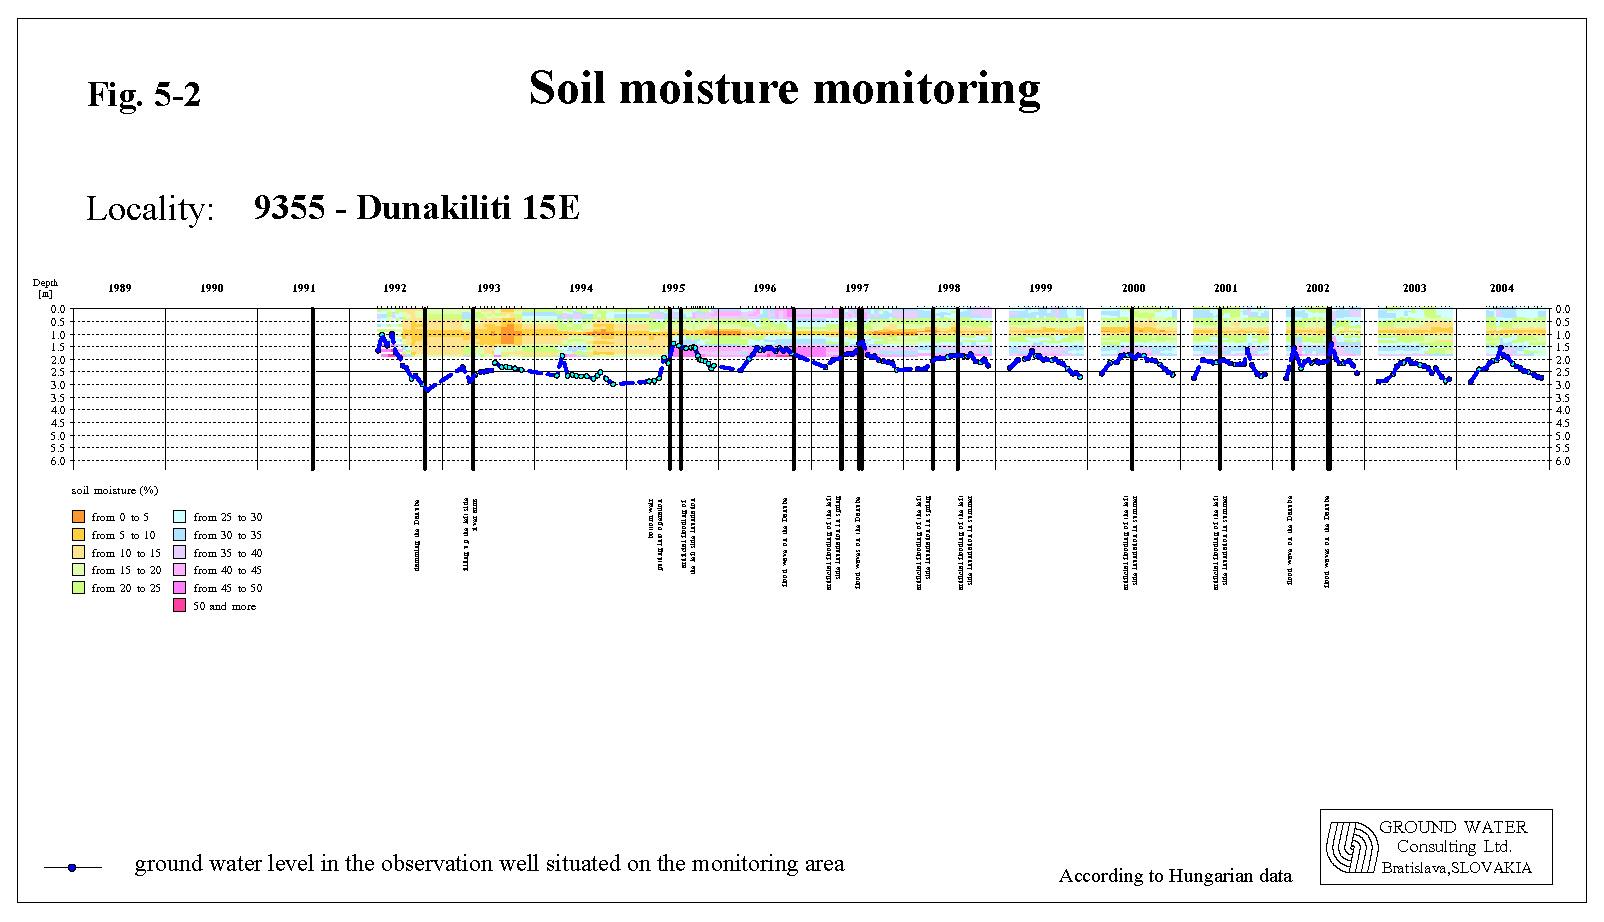
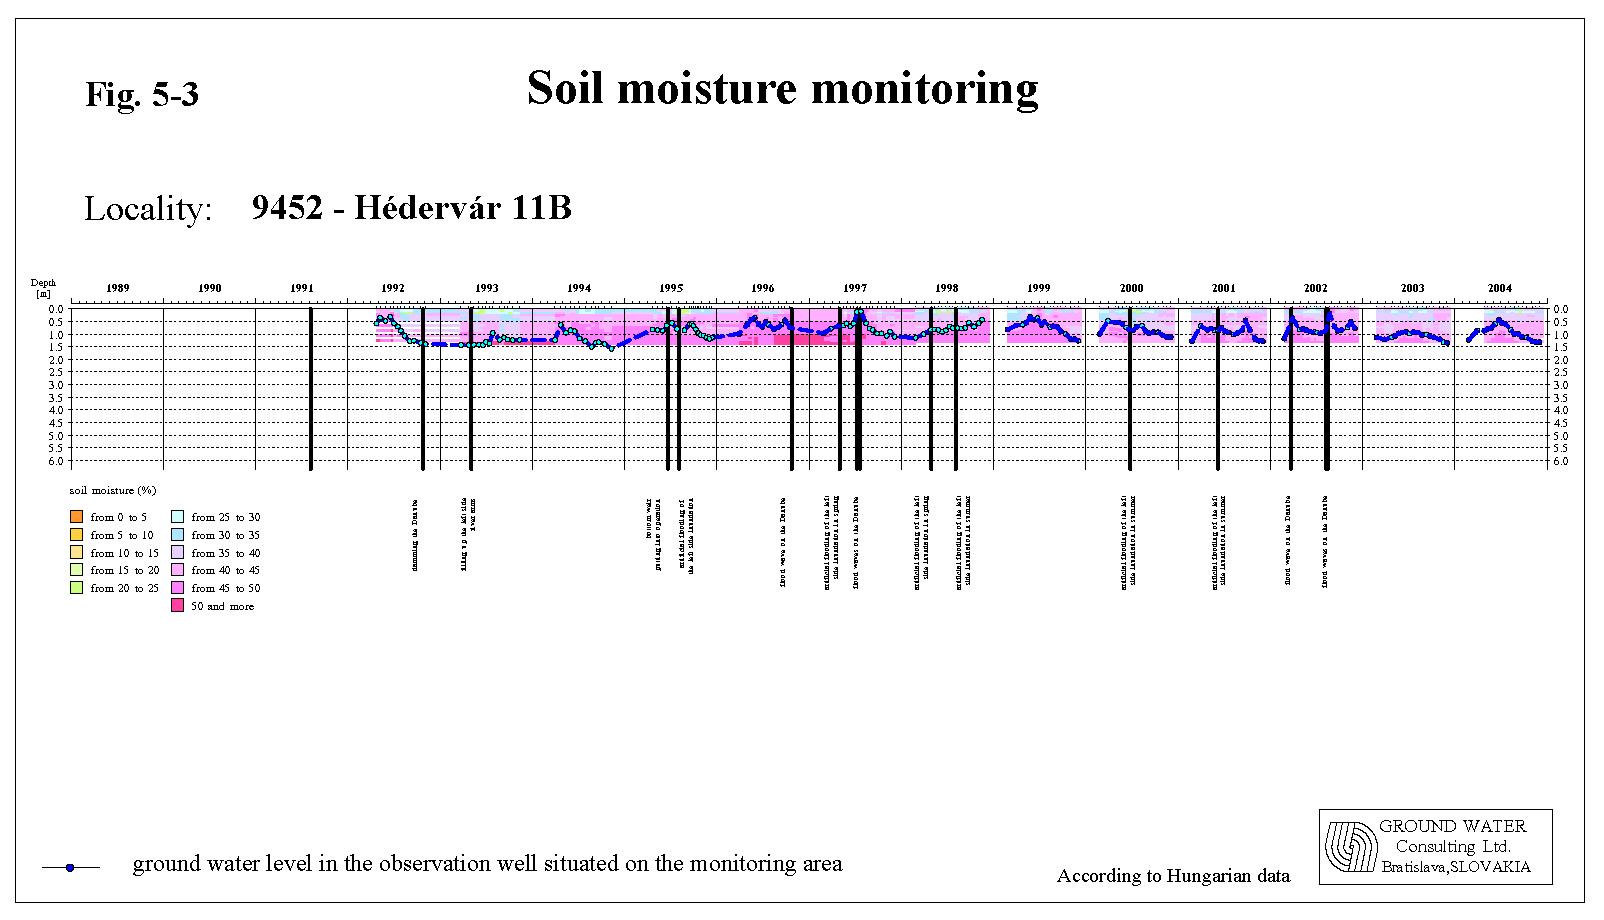
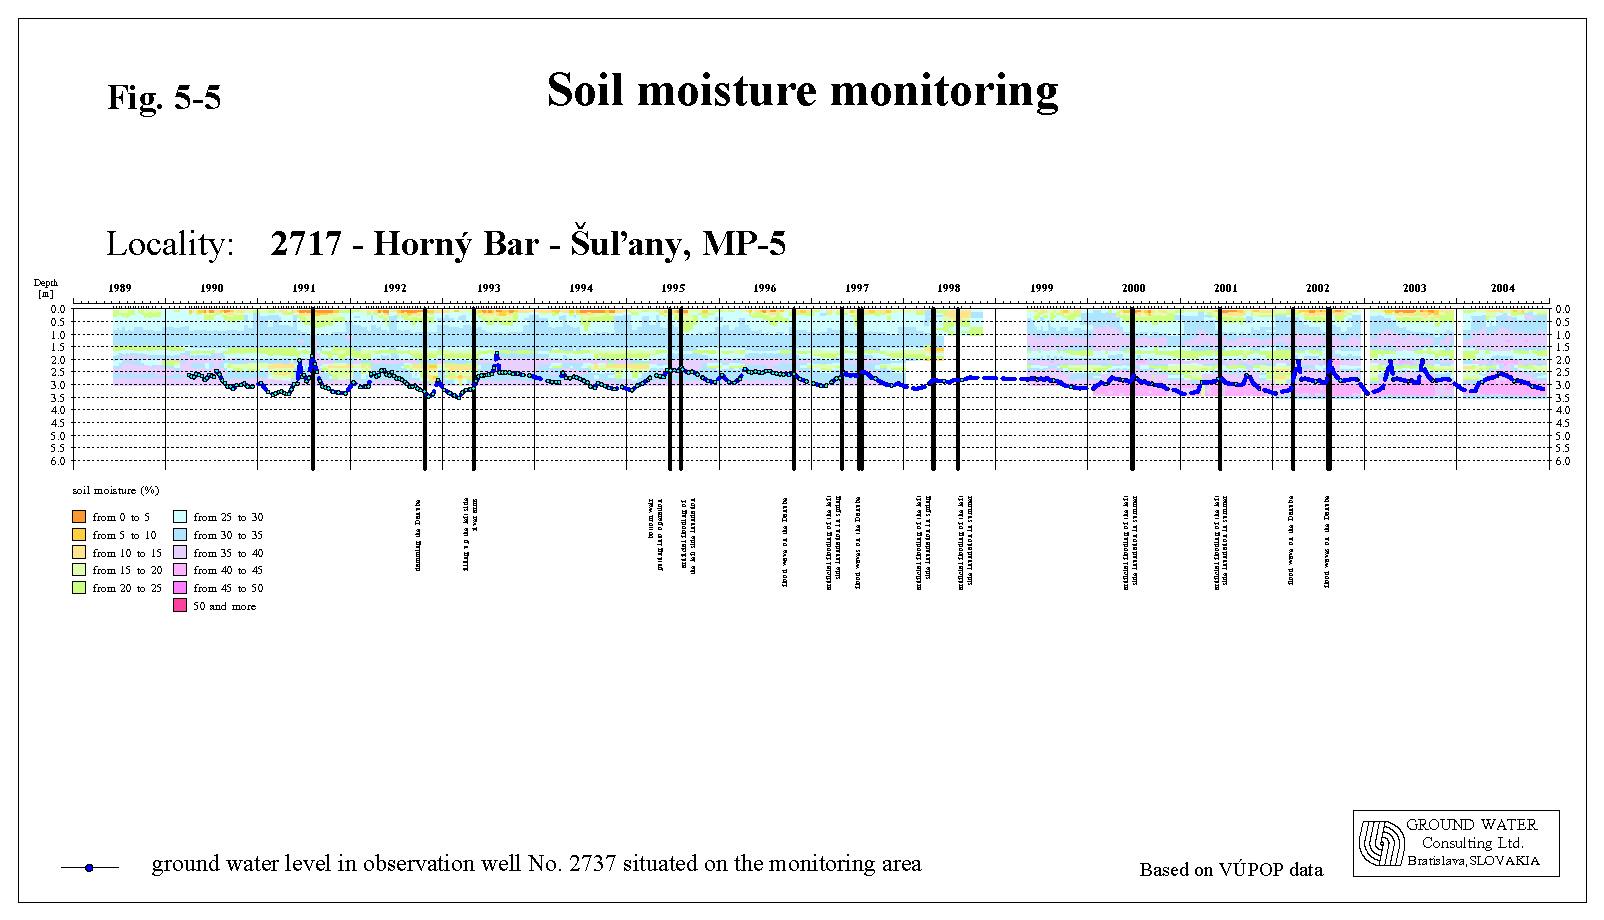
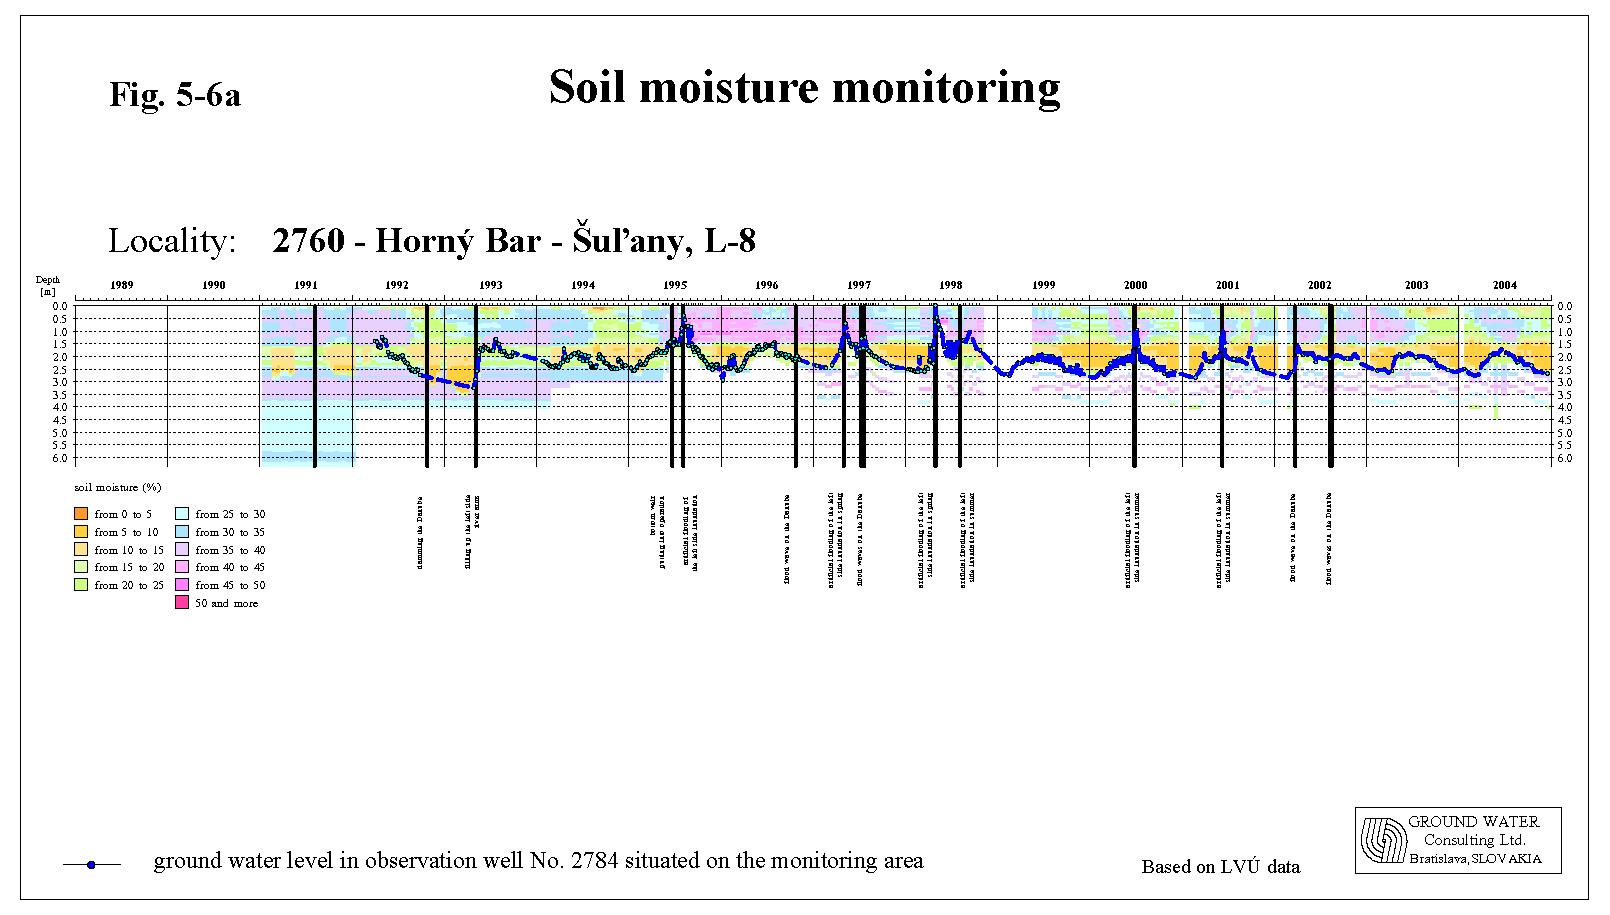
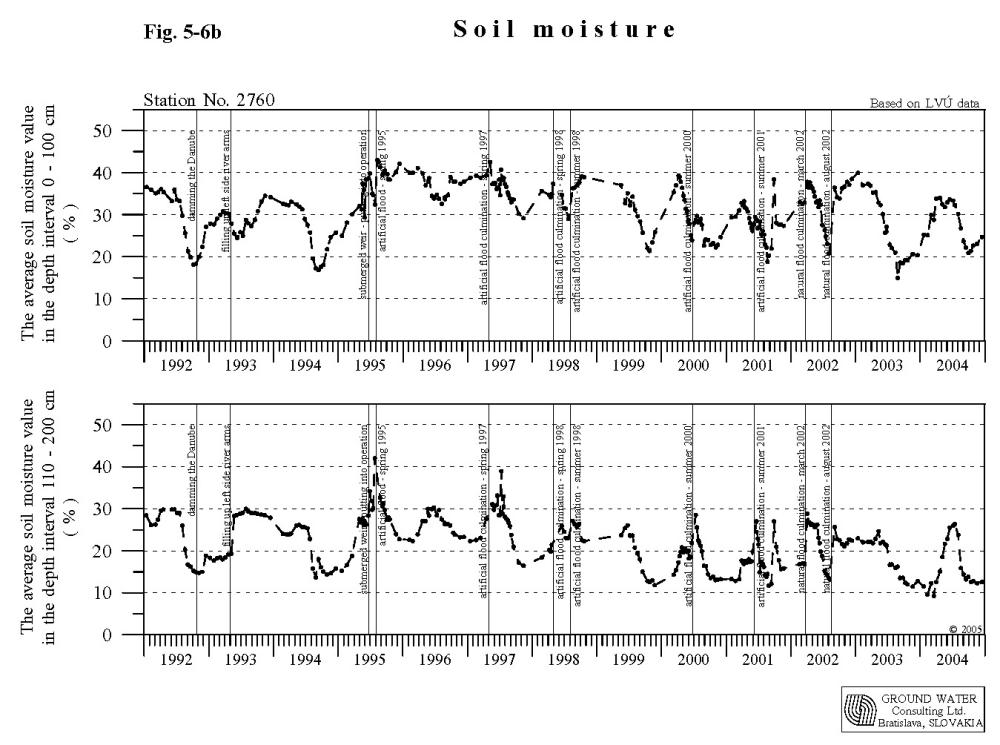
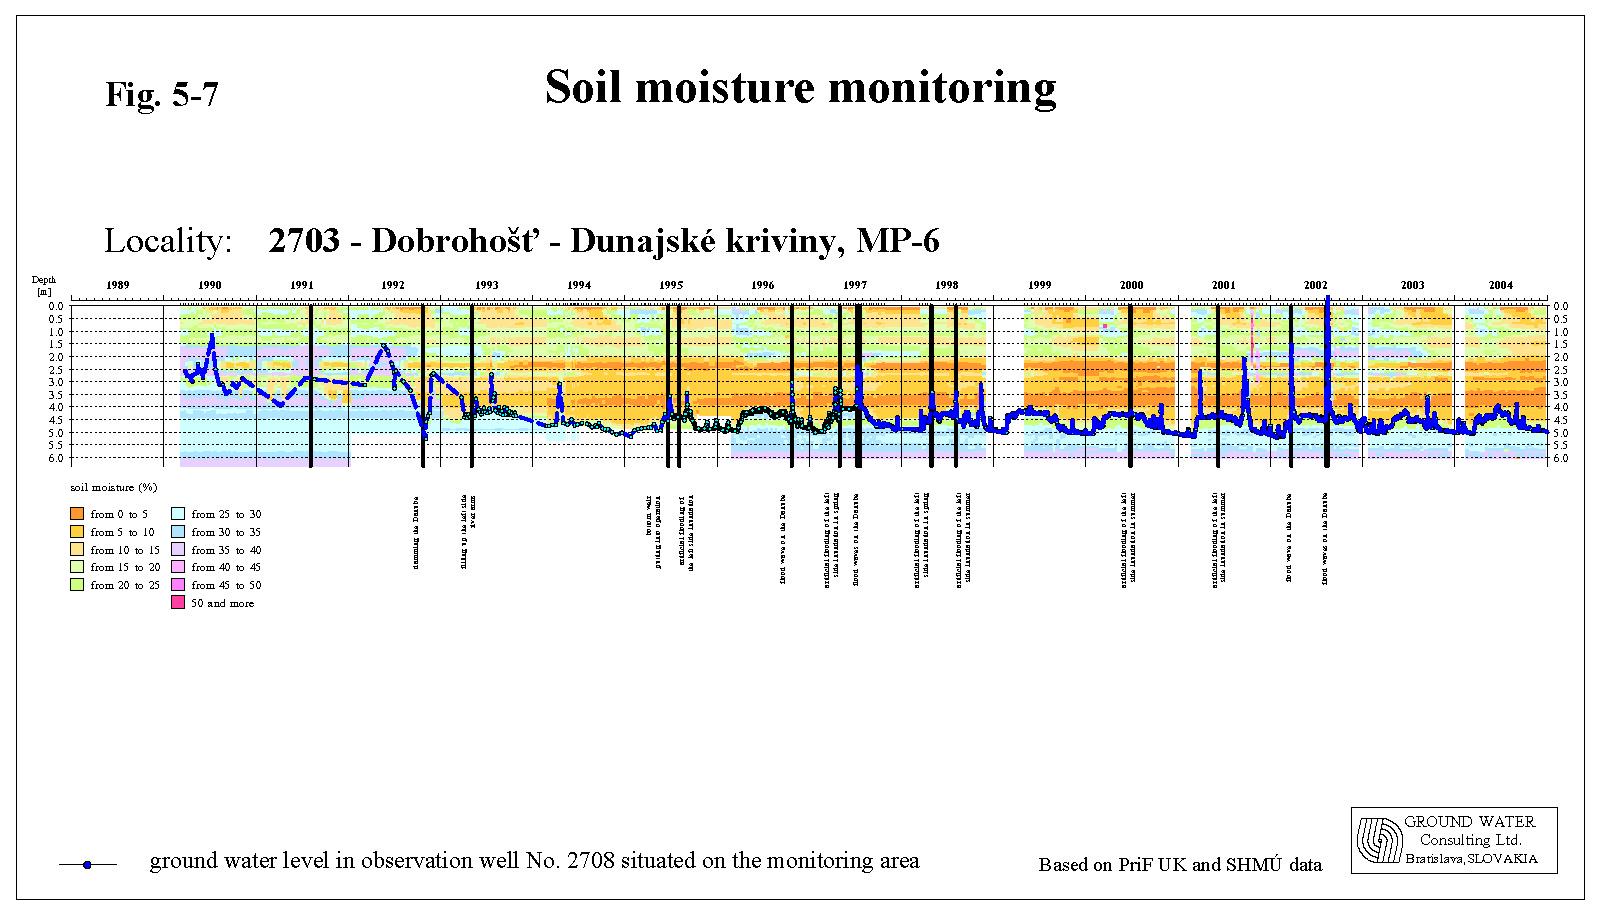
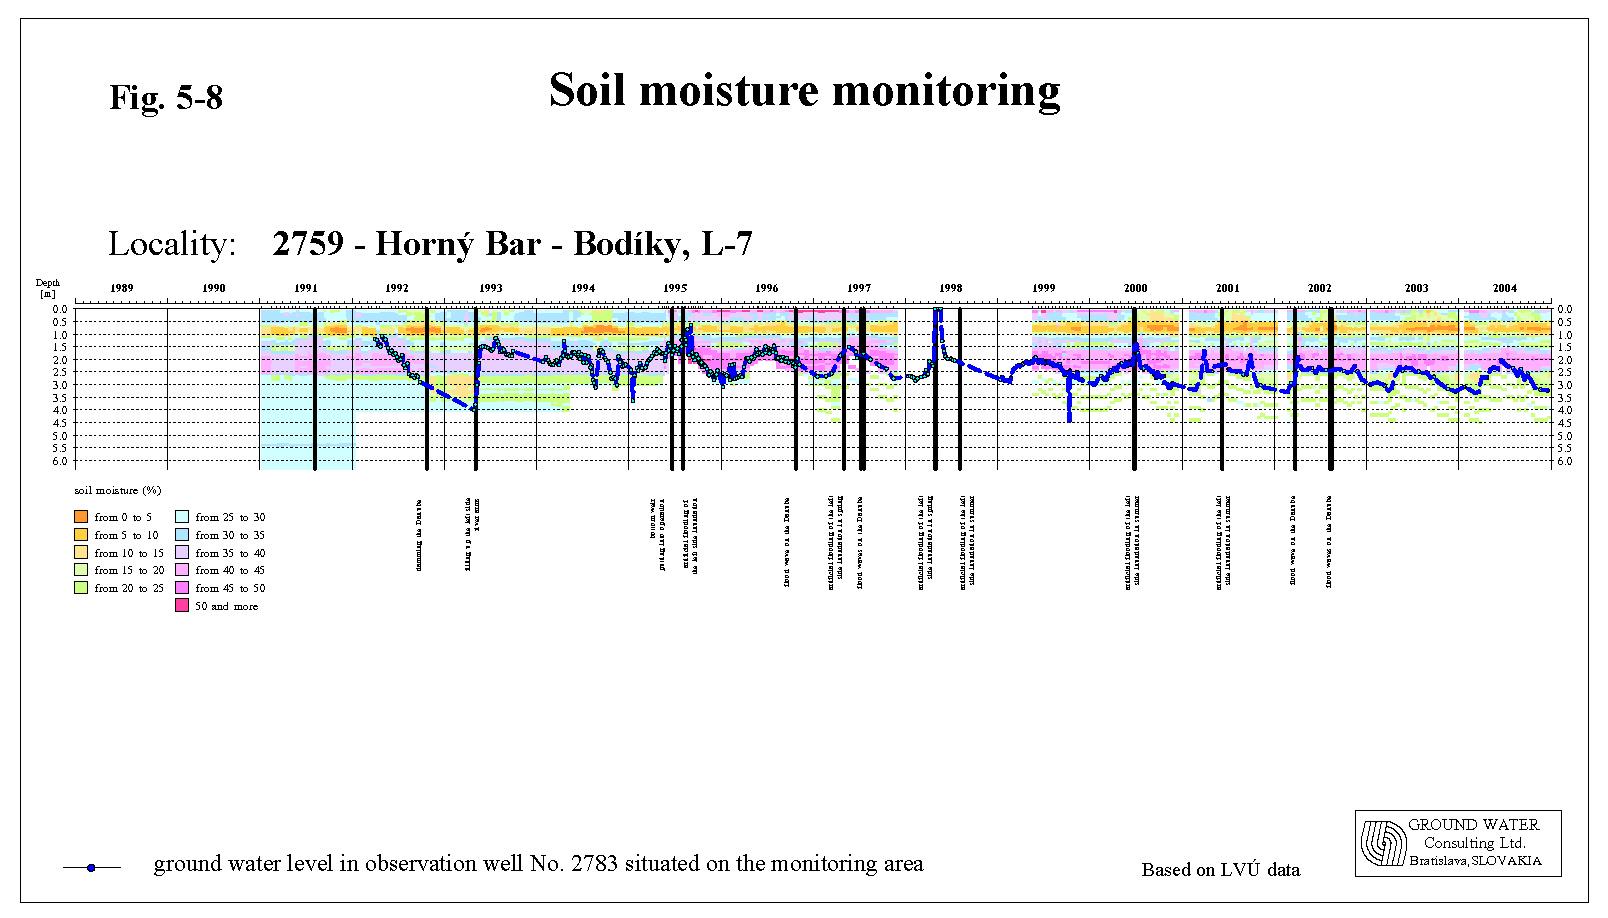
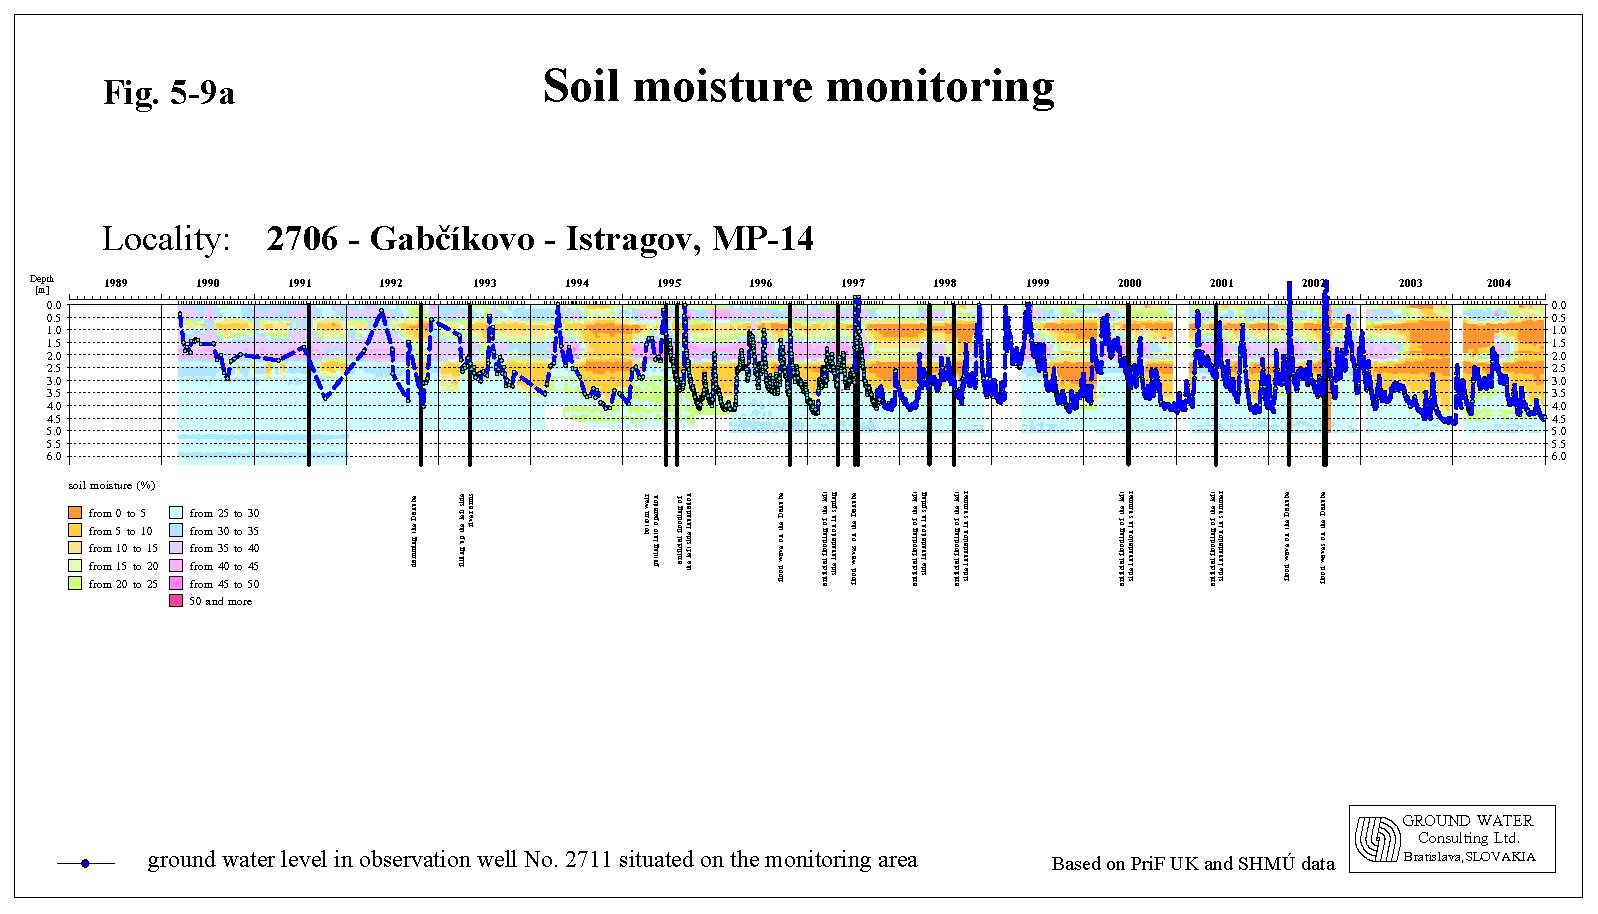
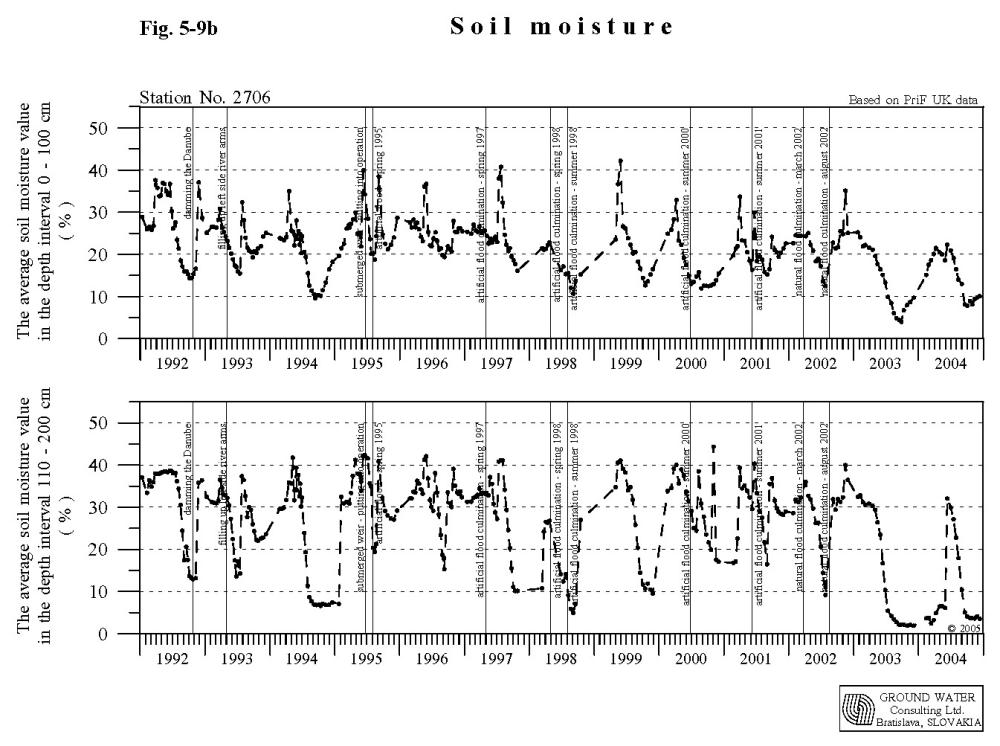
5.2. Data presentation methodsBoth Parties presents the soil moisture in figures showing the average soil moisture content in volume percentage for the depth interval from 0 to 100 cm and from 110 to 200 cm. A small difference can occur in Hungarian data, where the value for depth interval under the 110 cm represents the average value for the rest of total measured depth (the average value can be calculated from less than 10 measured values). On colour figures the soil moisture time distribution for the whole measured depth is presented. The graphical presentation of the whole set of measured data is given in the Slovak and Hungarian National Annual Reports. 5.3. Evaluation of results on the Hungarian sideThe soil moisture measurements on the Hungarian side in 2004 continued at forestry monitoring sites in the floodplain area as well as at agricultural monitoring sites in the flood-protected area (Fig. 5-1). The moisture conditions of soils are essentially influenced by the rainfall conditions, by the soil layer thickness and composition, as well as by the ground water level position. The observed soil moisture values in 2004 were influenced by rainfall distribution. The total amount of rainfall at the beginning of the year was slightly higher comparing to the long-term average. The soil saturation by water reached 85-95% at the beginning of the vegetation period. Higher amount of rainfall occurred in April, May and June. This induced soil moisture content. In July decrease of soil moisture content started in the upper soil layer, which continued in August as well. The amount of rainfall in September was little again; the moisture content in the upper soil layer further decreased and reached the lowest values. The soil moisture in the Szigetköz region was adversely influenced by the low flow rate at the beginning of the hydrological year 2004 (November 2003 - January 2004). The first significant discharge wave occurred in the middle of January. The soil moisture was positively influenced in the second half of March, when the average daily discharge continuously exceeded 2400 m3s-1 for three weeks. In April and May mid water conditions were characteristic in the Danube. The discharge wave at the beginning of June positively influenced the ground water level and the decreasing soil moisture content was partially restored. Since end of July continuous decrease of soil moisture content was recorded. An artificial flooding in June positively influenced the soil moisture content in the inundation area. The amount of water discharged into the river branch system induced situations characteristic for natural floods. The average ground water level during the vegetation period 2004 was from 6 to 29 cm higher comparing the average ground water level in 2003. The soil moisture on forestry monitoring sites For all soil moisture monitoring sites on forestry areas it was characteristic that in the soil layers up to 1 m depth the maximum and average values of the soil moisture content were higher in comparison with the previous year. The minimal values, except two sites, were higher than in 2003 as well. On areas situated in the inundation area the highest average soil moisture content was recorded in June. It reflected the increased water amount discharged into the Danube old riverbed during a discharge wave on the Danube (monitoring sites No. 9996, 9997 and 9998) or the artificial flooding the right side inundation area (monitoring sites No. 9355, 9452, 9994, 9995) – Fig. 5-2, Fig. 5-3, Fig. 5-4 and Fig. 5-5. No effect of the discharge wave or artificial inundation was observed at monitoring site No. 9972 situated just near the Danube old riverbed. Since June the average soil moisture content continuously decreased and the minimal values were mostly recorded at the end of the year. Similar situation occurred in the depth below 1 m, however the minimal average soil moisture values were recorded in February. According to the evaluation of the soil moisture monitoring, it can be stated that the soil moisture content in the layer down to 1 m depth on most areas depend on precipitation. The positive influence of the water supply can be clearly observed on monitoring sites No. 9355, 9994 and 9995, where the ground water moisturised the soil in different depths (Fig. 5-2, Fig. 5-4). Due to the drainage effect of the Danube old riverbed limited influence of the water supply is observed on monitoring sites No. 9498, 9996 and 9997, which are situated closer to the Danube old riverbed. No influence of the realized water supply was recorded on monitoring sites No. 9452 (Fig. 5-3) and 9998, however the water supply system in the area of the latter one is not built yet. In general the soil moisture conditions were better in comparison to the previous year, however they did not reached the good moisture conditions from 1997 due to the less favourable distribution of precipitation in the time. The soil moisture on agricultural monitoring sites on the flood protected side The soil moisture at monitoring sites No. 2630 and 2653 in the hydrological year 2004 was influenced by the precipitation only due to the deeply situated ground water level. Maximum soil moisture values in the layer down to 1 m depth were recorded at the beginning of vegetation period, in March 2004. In the layer below 1 m depth the maximal values were recorded in June and July 2004, influenced by the higher ground water levels. The soil moisture content at the monitoring site No. 2653 was balanced and in both layers (down to 1 m depth and below it) showed only very slight decrease. Monitoring sites No. 2605 and 9443 are situated in areas with thick covering layer. At the monitoring site No. 2605 the ground water moisturised the bottom of soil layer during the whole vegetation period, at the monitoring site No. 9443 in June and July 2004. The rainfall influenced upper layers only. The monitoring site No. 7920 is situated in the area where the drainage effect strongly influencing the ground water level. However, the ground water level moisturized the thick soil layer during the whole year. The average soil moisture content on each agricultural monitoring site was slightly higher in comparison with the previous year, except the monitoring site No. 2630, situated near the Danube at Dunaremete, where the drainage effect dominates. 5.4. Evaluation of results on the Slovak sideMonitoring sites on the Slovak side are situated in the inundation area and flood-protected agricultural area (Fig. 5-1). According to the soil moisture observation at monitoring sites situated in the agricultural area (sites No. 2716, 2717, 2718) it can be stated again that the soil moisture content during the whole observed period remained unchanged (Fig. 5-5). Only at the monitoring site No. 2718 the soil moisture content in 2004 decreased significantly due to unfavourable climatic conditions. The position and fluctuation of ground water level remained unchanged as well. In the year 2004 the ground water level at the monitoring site No. 2716 fluctuated in the depth of 3-4 m, at site No. 2717 in the depth of 2.5-3.5 m and at site No. 2718 in the depth of 2-3 m. The fluctuation of soil moisture content in the depth interval from 0 to 1 m mostly depends on climatic conditions. In the depth from 1 to 2 m the soil moisture fluctuation, except the monitoring area No. 2716, is partly influenced by the ground water level. The soil moisture content in the depth down to 1 m mostly in the year 2004 fluctuated in the range from 9 to 21 % on the monitoring site No. 2716 and in the range from 22 to 32 % on the monitoring sites No. 2717 and 2718. In the depth between 1 and 2 m the soil moisture content mainly varied from 12 to 20 % on monitoring site No. 2716, in the range from 29 to 36 % on monitoring site No. 2717 and in the range from 12 to 23 % on monitoring site No.2718. The situation in the inundation area is more complex. Changes of the soil moisture content depend mainly on the location of the monitoring site in respect to the Danube, in respect to the river branch water supply and on the soil profile thickness. The soil moisture is besides the ground water level and precipitation highly dependent on natural or artificial floods. In hydrological year 2004 there were no flood, natural or artificial, in the area. The soil moisture content at the beginning of vegetation period was unfavourable influenced by low flow rate in the Danube in the second half of the hydrological year 2003 and at the beginning of hydrological year 2004. The soil moisture content in the upper layer (down to 1 m depth) reached 80-95 %, which was influenced by the precipitation. The soil moisture storage at the end of the winter period in layers below 1 m reached only 60-70 % of the values from previous years. In February minimal values were measured, close to the lowest values observed during the whole observation period. Hydrological and climatic conditions became rather favourable from March to June 2004. The maximal values of the soil moisture in the layer down do 1 m depth were recorded during March, thanks to higher amount of precipitation. In the layer below 1 m depth the maximum values were reached in June, when a discharge wave occurred in the Danube. From June till end of the vegetation period the soil moisture content continuously decreased. In the inundation area around Dobrohošť and Bodíky villages is the thickness of the soil profile, similarly to the Hungarian side, low - monitoring sites No. 2703, 2764, 2763, 2762 and 2761. The ground water level at these places fluctuates only in the gravel layer. The ground water level on the area No. 2703 fluctuated from 3.8 to 5 m, on the areas No. 2764, 2763, 2762 and 2761 changed from 1.8-4.6 m. The average values of the soil moisture content in the depth to 1 m significantly fluctuated and they were highly dependent on the climatic conditions (Fig. 5-7). Maximal average soil moisture contents occurred during March and April 2004. During the vegetation period the soil moisture content significantly decreased and minimal values occurred in September and October 2004. The maximal values of soil moisture in the depth below 1 m occurred during at the time of releasing higher discharge into the Danube old riverbed in June; the minimal values occurred at the end of vegetation period. The thickness of the soil profile in the middle part of the inundation area is higher. In general the ground water regime in this region is influenced by the water supply of the river branch system, introduced in May 1993. Moreover, the natural or artificial floods are with high influence on the ground water level. The ground water level usually fluctuates above the boundary between the soil profile and gravel layers - monitoring sites No. 2704, 2705, 2758, 2759, 2760 (Fig. 5-6a, Fig. 5-6b, Fig. 5-8). Except the monitoring site No. 2705 the ground water supply the soil profile in the depth below 1 m. The maximal values of average soil moisture content in the layer to 1 m depth were reached in March-April 2004, minimal values mostly occurred at the end of the vegetation period. In the layer below 1 m depth the maximal values occurred in June-July 2004 and the minimal values at the beginning of the years 2004. In the lower part of the inundation area, downstream of the confluence of river branch system and the Danube (monitoring sites No. 2706, 2756, 2755), the ground water level usually fluctuates around the boundary between the soil profile and the gravel layer. During higher discharges in 2004 the groundwater level moisturized the soil profile in both depth interval. However, due to riverbed erosion downstream of the confluence of the tailrace canal and the Danube old riverbed decrease of groundwater level was registered, especially at low flow rates in the Danube. The average values of the soil moisture significantly fluctuate, and are strongly dependent on the ground water level fluctuation. The minimum and maximum values are related to the minimum and maximum ground water levels respectively. Minimal average values of soil moisture occurred at the end of vegetation period and in the layer below 1 m depth remained low till the end of the year. The maximal average values of soil moisture were reached during the discharge wave in June 2004 (Fig. 5-9a, Fig. 5-9b). The soil moisture contents at monitoring sites No. 2707, 3804, 3805, located in the inundation below the confluence of the tailrace canal and the Danube old riverbed, are highly influenced by the flow rate regime in the Danube. The maximum values in the year 2004, in the depth down to 1 m and between 1 and 2 m, occurred in June, while the minimum values occurred at the end of vegetation period. The ground water level at monitoring site No. 2707 and 3804 fluctuated mostly in the depth 1-4 m, at monitoring site No. 3805 in the depth 1-3.5 m. The riverbed erosion negatively influences these monitoring areas. During low flow rates in the Danube the ground water level does not supply the soil profiles sufficiently.
|