PART 2
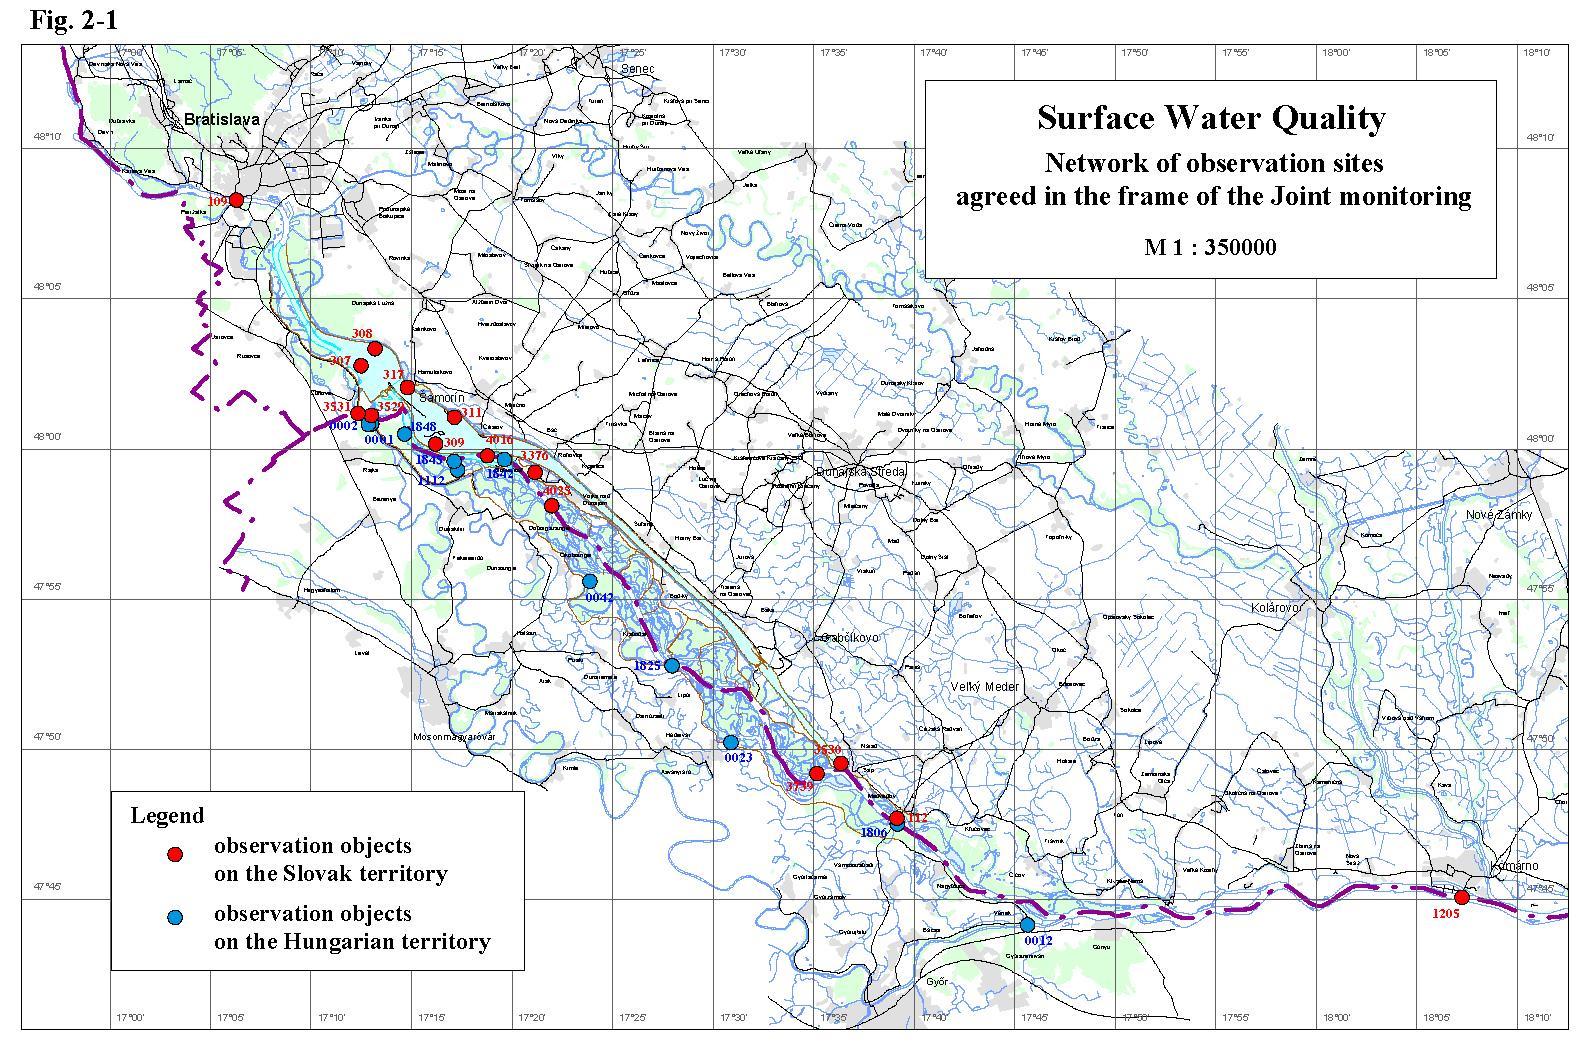
Surface Water QualitySurface water quality measurements in 2004, according to the Agreement, were carried out at 11 monitoring sites on the Hungarian territory and at 15 monitoring sites on the Slovak territory - Table 2-1, Fig. 2-1. At all of monitoring sites the influence of the measures, described in the Agreement, on the surface water quality was observed. Main factors, which could influence the water quality, are: the backwater effect upstream of the bottom weir, the increased discharges into the Danube downstream of the Čunovo dam and into the Mosoni branch of the Danube, the water supply into the right side river arm system, and morphological changes in the riverbed. Sampling and analysing were mainly performed according to methods agreed by the Sub-commission for Water Quality Protection of the Slovak-Hungarian Trans-boundary Water Commission. Table 2-1: List of monitoring sites
Surface water quality and sediment quality data for agreed monitoring sites and time series diagrams for the respective parameters of the surface water quality are given in the Annexes to the Slovak and Hungarian National Reports on the Environment Monitoring in 2004. Figures in this report present the data of selected parameters. In the evaluation new limit values for surface water quality, agreed on 78th session of the Slovak-Hungarian Trans-boundary Water Commission (2003), were used - Table. 2-2. Table 2-2: Agreed limits for surface water quality classification
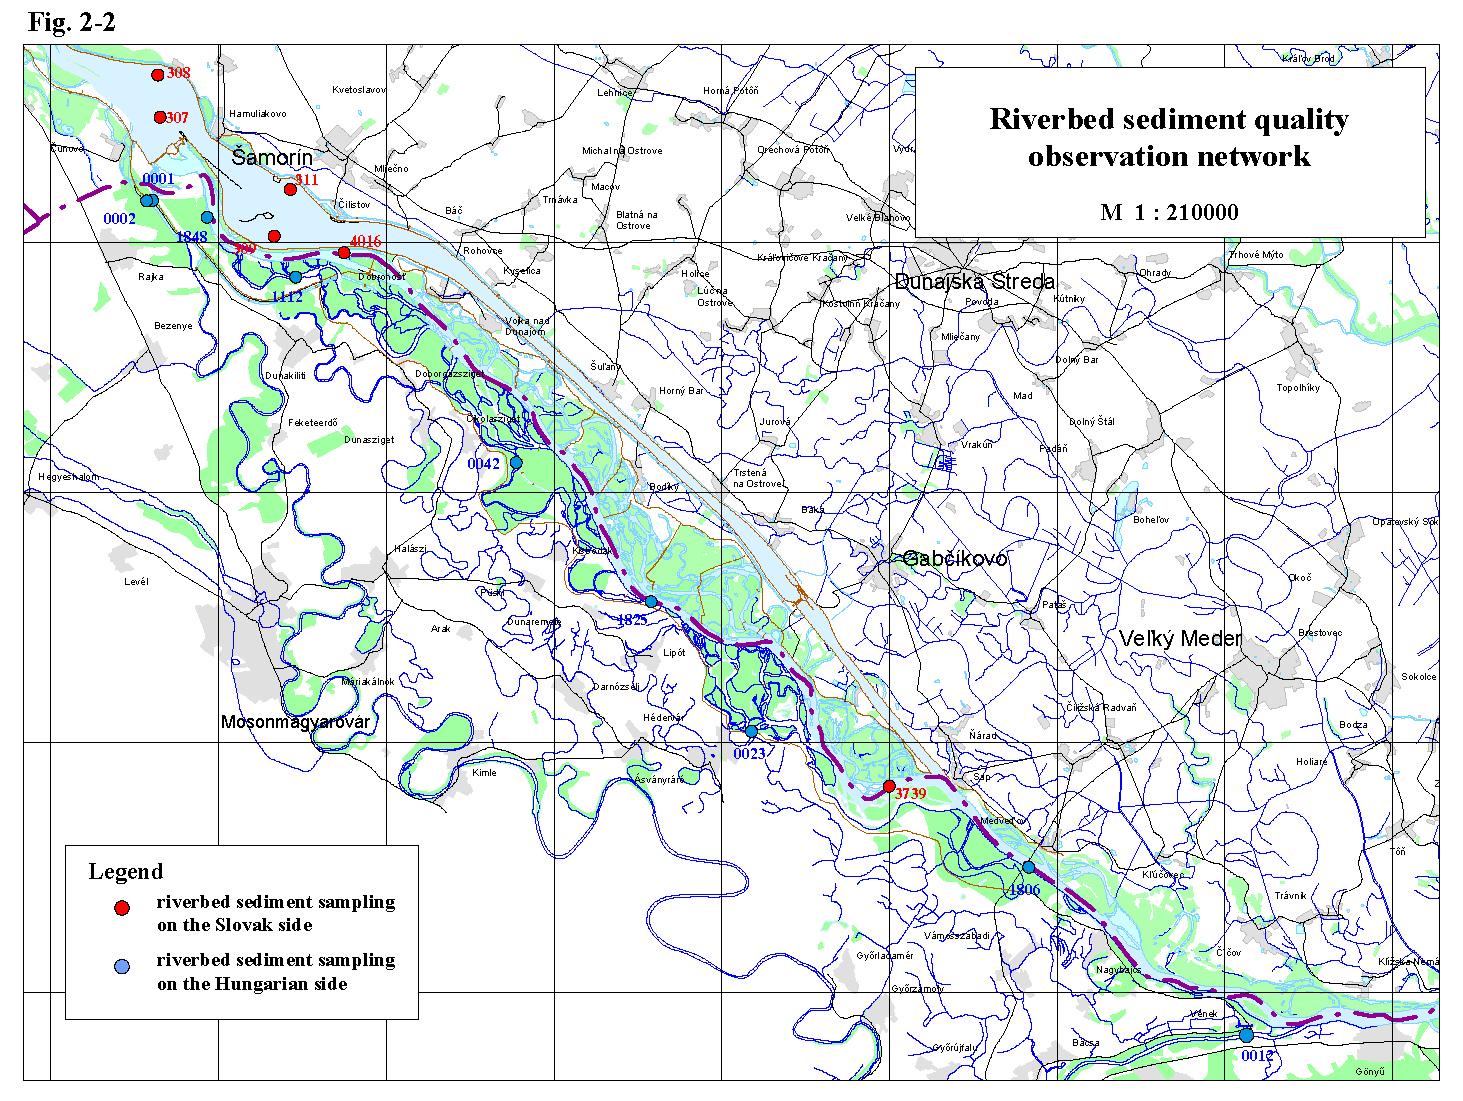
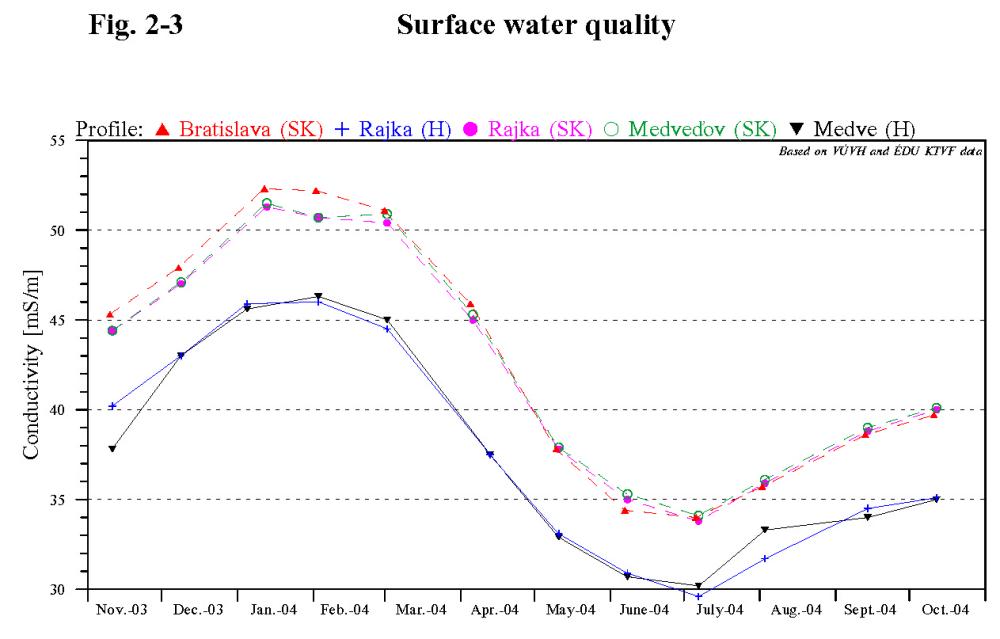
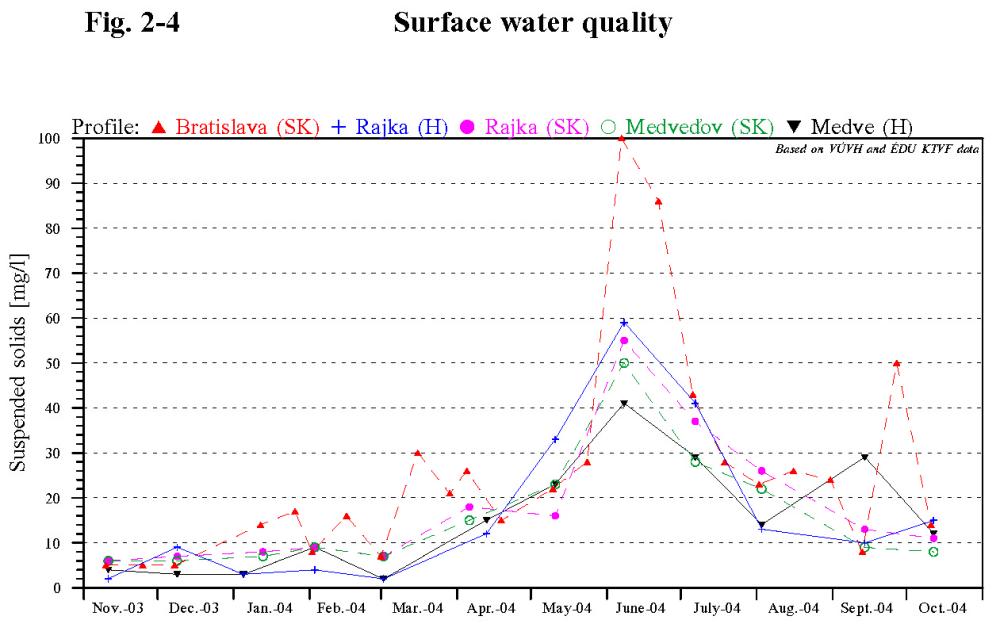
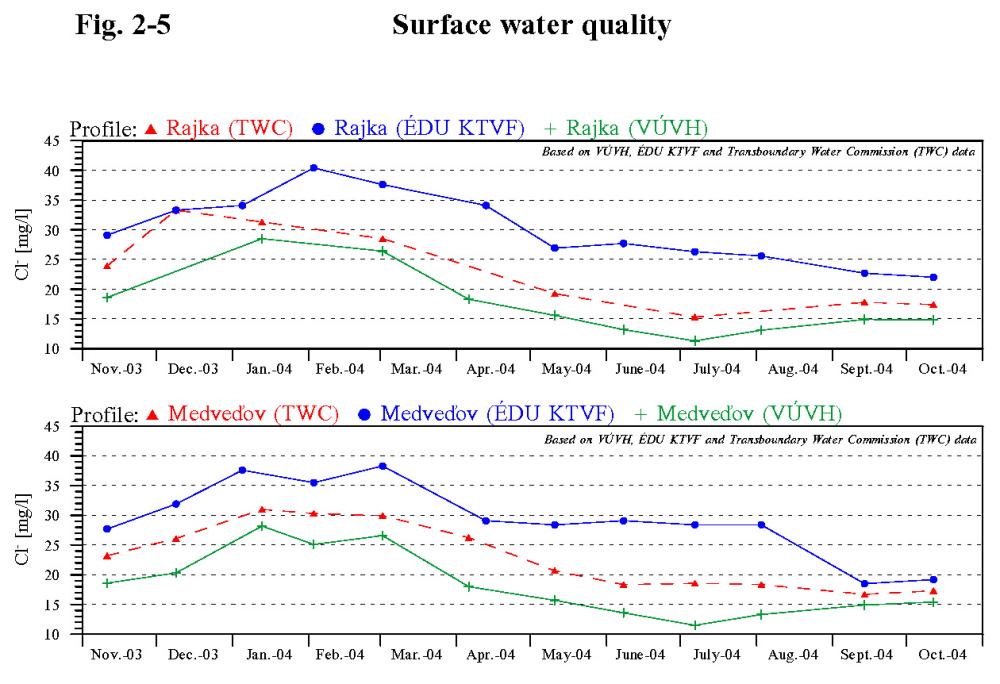
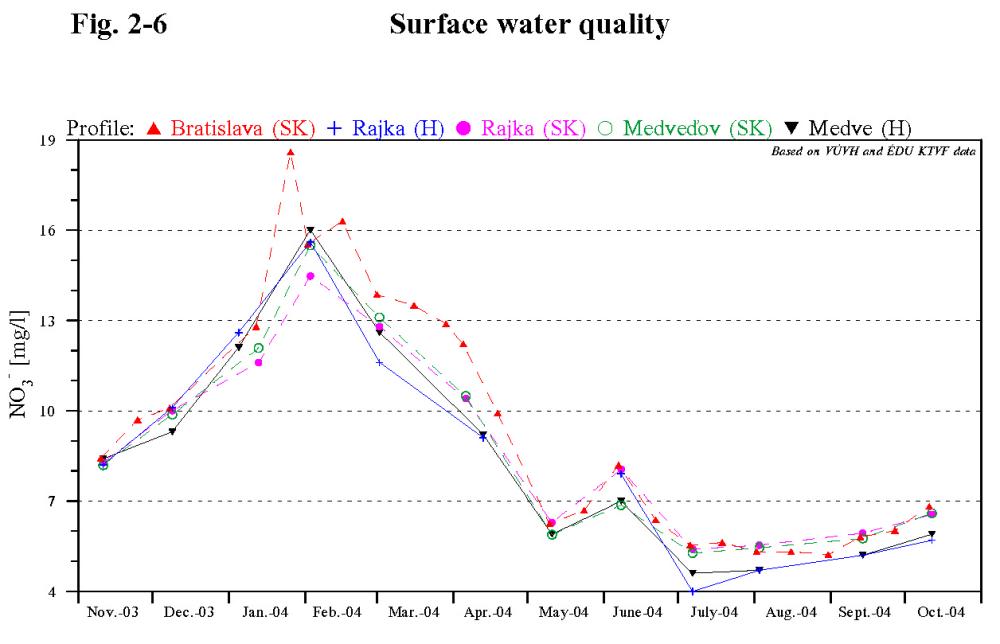
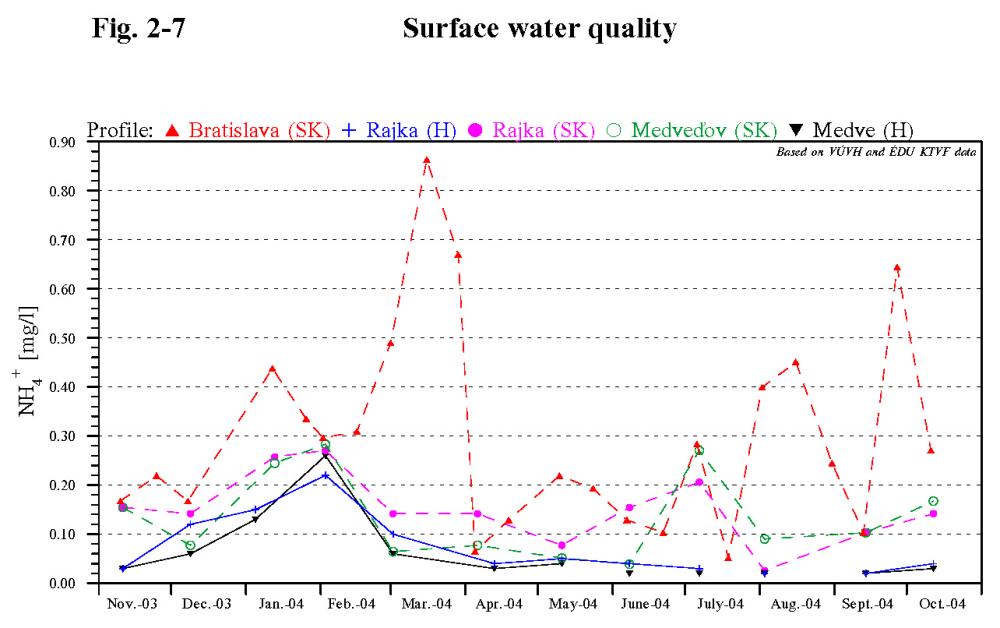
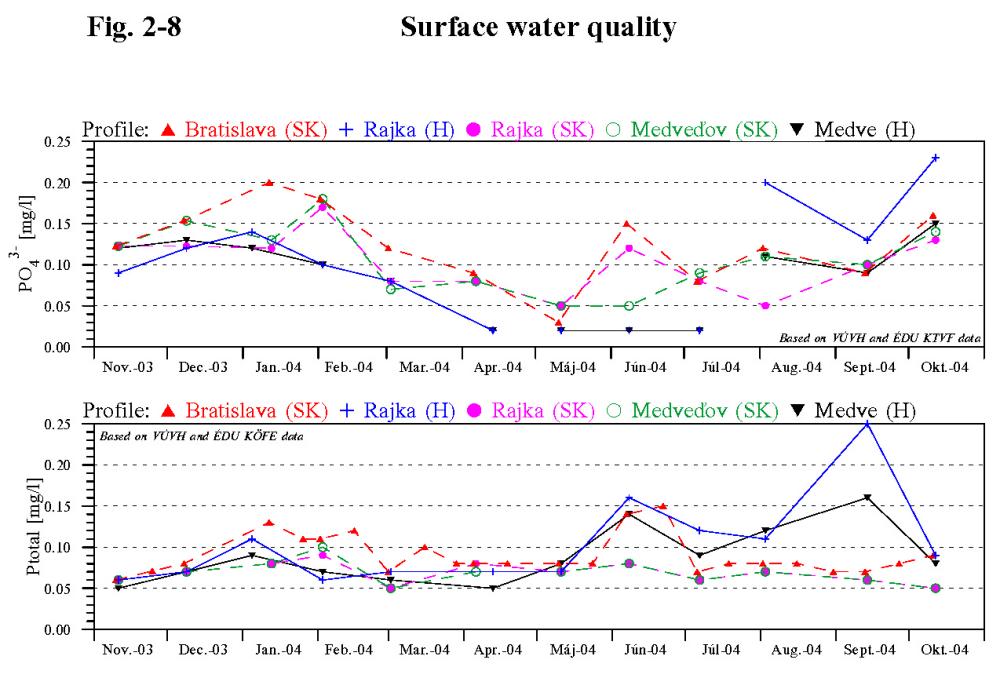
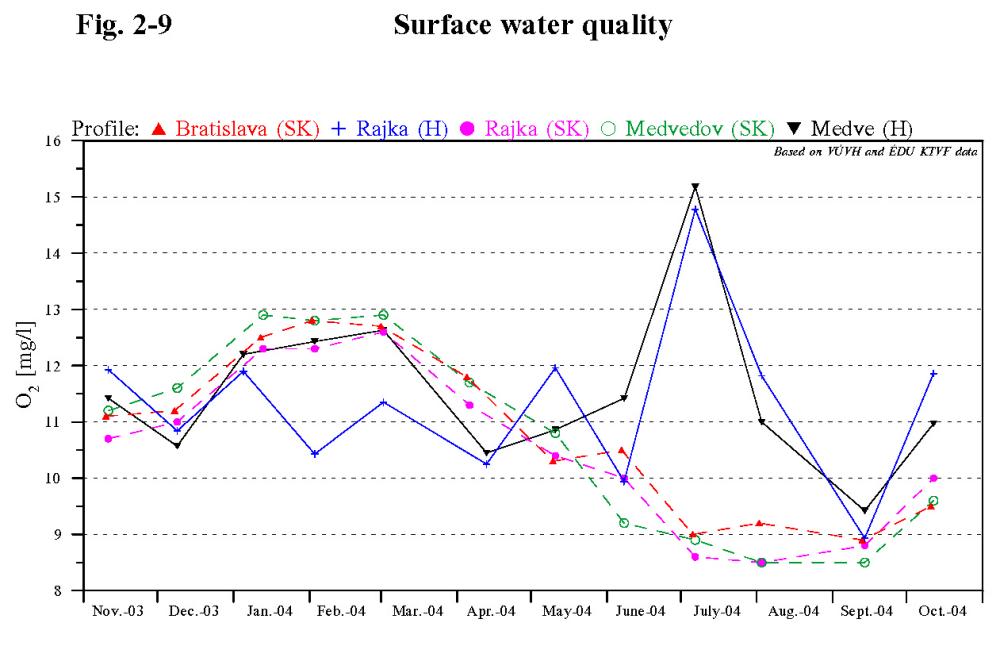
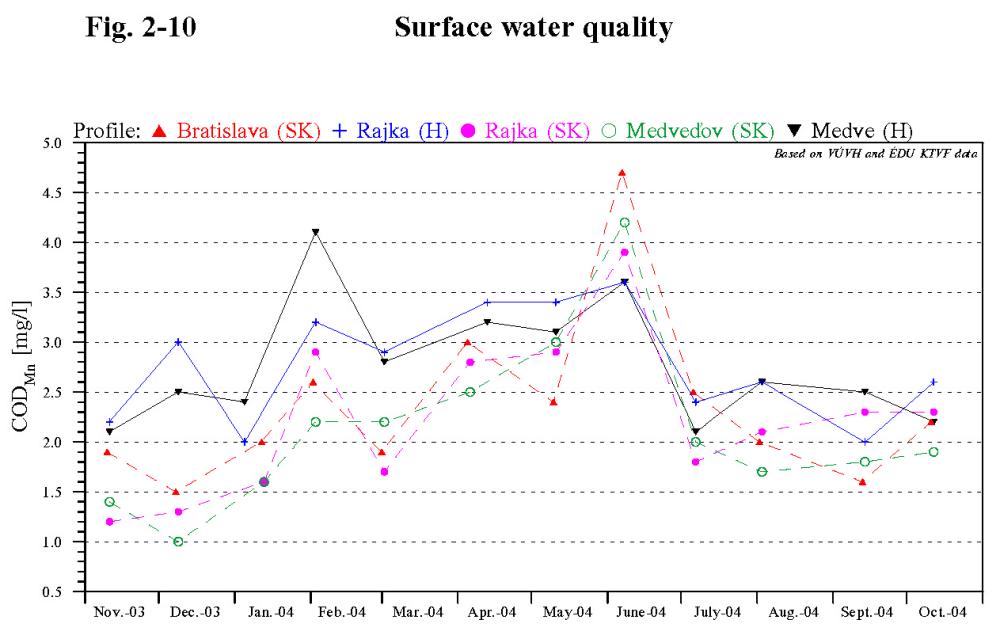
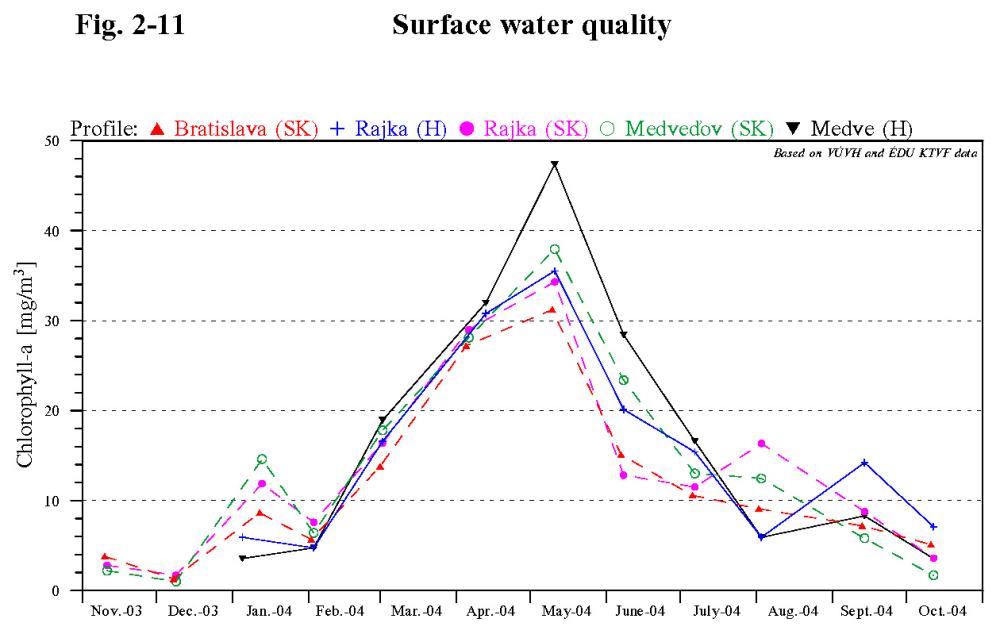
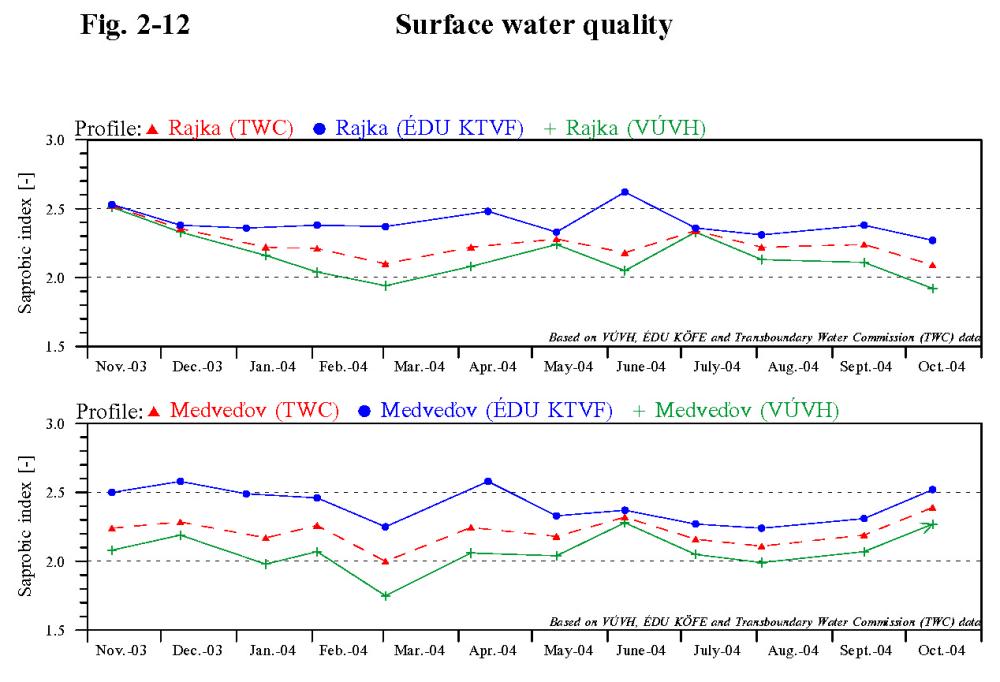
2.1. General evaluation of the actual hydrological yearThe year 2004 was subnormal from the average flow rate point of view. In the winter period flow rates oscillate around and below 1000 m3s-1 for several weeks. In January and February two more significant discharge waves occurred. Since March to end of July flow rates exceeded 2000 m3s-1, and in March and June they exceeded 3000 or 4000 m3s-1 respectively. Two lower discharge waves occurred at the end of vegetation period as well. When comparing the hydrological year 2004 and the previous year it can be stated that from February to September higher flow rates occurred in 2004 in average than in the same period in the hydrological year 2003. 2.2. Basic physical and chemical parametersWater temperature The water temperature fluctuation in the whole Danube stretch downstream of Čunovo follows the water temperature course observed in the Danube at Bratislava (sampling site No. 109). In the actual year the water temperature fluctuated in the range from 1 to 22 °C, in the reservoir up to 23 °C. Maximal values occurred in July and August and minimal values in January and February. The water temperature in the seepage canal was different, just as in the previous years. In the winter period it was warmer (by 2-4 °C) and in the summer period cooler (by 2-4 °C), because the seepage canal is supplied by the ground water. The water temperature in the Mosoni Danube at Čunovo sampling site was similar to the water temperature in the Danube and fluctuated from 2 to 19 °C, at the Vének sampling site it fluctuated from 1 to 23 °C. The water temperature in the right side river branch system in the winter period was cooler comparing to the Danube water, in the summer were slightly higher that in the Danube water. pH Higher values of pH occur in seasons corresponding with periods of increased assimilation activity of phytoplankton. Resulting from the decreased assimilation activity in winter period the pH values were lower than in summer period. The Danube water pH values in the hydrological year 2004 fluctuated in the range from 7.6 to 8.5. Higher values occurred particularly during the algae growth (April-May). The pH values in the reservoir fluctuated between 7.3-8.7. The pH values in the river branch system fluctuated from 7.4 to 8.45 and in the seepage canal varied from 7.68 to 8.25. The pH values in the Mosoni Danube downstream of the intake structure at Čunovo fluctuated between 8 and 8.45 and upstream of the confluence with the Danube at Vének fluctuated between 7.7-8.35. Specific electric conductivity The specific electric conductivity of the surface water refers to the dissolved salts content of mineral origin. The conductivity values in the Danube and in the right-side river branch system in 2004 in principle follow the conductivity values at the Bratislava profile (No. 109) and fluctuated between 29 and 54 mS.m-1. Salinity increases from November to February, subsequently gradually decreases and the minimal values occur in June or July. Since August it increases again. The conductivity values in the Mosoni Danube at Čunovo sampling site are similar to that in the Danube water. The conductivity at the Vének profile is higher comparing to the other water bodies (it is affected by the impact of the affluents and also due to the loads coming from the wastewater). The conductivity values fluctuated in the range from 40 to 62 mS.m-1. The electric conductivity values in the seepage canal, similarly to the previous years, fluctuated in the range from 37 to 48 mS.m-1, while during the period from April to August were higher than in the Danube water (Bratislava sampling site). The specific electric conductivity at selected sampling sites for hydrological year 2004 is documented in Fig. 2-3. Suspended solids The suspended solids content is closely related to the flow rate. The suspended solids content fluctuation during the hydrological year 2004 in the whole Danube stretch downstream of Čunovo follows the suspended solids content fluctuation in the Danube at Bratislava (No. 109) – Fig. 2-4. The suspended solids content mainly fluctuated in the range from 2 to 60 mg.l-1. One sample taken at Bratislava sampling site (No. 109) reached 100 mg.l-1, which was related to higher discharge in the Danube. The suspended solid content in the reservoir fluctuated up to 53 mg.l-1 in the hydrological year 2004, while at June at sampling site No. 307 (Kalinkovo-navigation line) two high values occurred (123 and 84 mg.l-1), which is related to the higher flow rates in this period. When analysing the changes in the suspended solids content in the main riverbed it can be stated that the suspended solids content downstream of reservoir (Medveďov sampling site) is lower than in the Danube at Bratislava, which shows the settling effect of the reservoir. In the seepage canal the content of suspended solids fluctuated between 1-27 mg.l-1. The suspended solids content along the longitudinal profile of the right side river branch system, similarly to previous years, fluctuated between 4-67 mg.l-1. In the Mosoni Danube at Čunovo the content of suspended solids fluctuated from 2 to 55 mg.l-1. At the Vének profile it fluctuated from 1 mg.l-1 to 57 mg.l-1, while two values, in June and July, reached 113 and 124 mg.l-1. Basic physical and chemical parameters - summary Basic physical and chemical parameters in the Danube and in the river branch system connected to the Danube main riverbed show seasonal variations and some of them predominantly depend on the flow rate. The fluctuation of basic physical and chemical parameters in the Mosoni Danube and in the seepage canal reflects the different characteristics of these water bodies. The water quality in the Mosoni Danube is influenced by its affluents and wastewater from Győr; the water in the seepage canal is influenced mainly by the leaking ground water. No significant changes in the water quality were recorded in the hydrological year 2004 in comparison to the previous year. 2.3. Cations and AnionsThe ionic composition of the Danube water during the hydrological year 2004 showed high stability, just as in previous years. The seasonal fluctuation of individual ion content followed the changes in salinity (first of all changes of magnesium, calcium, sodium, chloride and hydrogen-carbonate ions content) related to the flow rate fluctuations in the Danube. Comparing to the long-term measurements the values of basic cations and anions have not changed. The most stable ionic content was characteristic for the seepage water. The Fig. 2-5 presents fluctuation of chlorides at Rajka and Medveďov. Higher dissolved solids content in the Mosoni Danube downstream of Győr (Vének profile) occurred in relation with higher sodium, potassium, chloride and sulphate concentrations. 2.4. NutrientsNitrates Nitrates concentrations in the hydrological year 2004 at all monitoring sites in the Danube (Fig. 2-6), as well as in the right-side river branch system showed seasonal fluctuation. Values mainly fluctuated in the range from 1 to 17 mg.l-1, occasionally 19 or 21 mg.l-1. In the vegetation period the nitrates concentrations in the Mosoni Danube at Vének sampling site were slightly higher in comparison to the Danube water and fluctuated in the range from 5 to 16 mg.l-1. Nitrates in the seepage canal in the hydrological year 2004 fluctuated in the range from 1 to 9 mg.l-1. Ammonium ion In the hydrological year 2004 at all measured sites in the Danube and in the reservoir higher ammonium ion concentrations were reached. Significant increase in comparison to the previous six years was detected at the Bratislava sampling site already (No. 109), when values were fluctuating from 0.06 to 0.86 mg.l-1 – Fig. 2-7. The ammonium ion concentration at the other sampling sites on the Danube and on the Mosoni Danube were in general lower and fluctuated in the range from 0.02 to 0.36 mg.l-1. In general higher concentrations occur during the periods with lower water temperature due to the slower nitrification processes. Maximal concentrations were reached in January and February. The lowest ammonium ion concentration was in the seepage canal, where it varied from 0.02 to 0.31 mg.l-1. The ammonium ion concentration in the Mosoni Danube at Vének sampling site was two times higher than concentrations on other Hungarian monitoring sites. However, the values were lower again in comparison to the previous year, especially in the period March-October. The measured values fluctuated in the range from 0.07 to 0.7 mg.l-1, with one higher value (1 mg.l-1) recorded in December 2003). Nitrites The nitrite ions concentrations, considered as a temporary product of nitrification and denitrification processes, showed a seasonal variation in the Danube water and fluctuated in the range from 0.01 to 0.12 mg.l-1. The nitrites concentrations in the seepage canal were lower in comparison to the Danube water and mainly varied between 0.02 and 0.06 mg.l-1. The nitrite content at Čunovo sampling point on the Mosoni Danube was slightly higher (0.02-0.14 mg.l-1) than in the Danube water at Bratislava. At the Vének profile and in the right side river branch system the nitrite concentrations were slightly higher as well and varied from 0.02 to 0.14 mg.l-1. Total nitrogen The total nitrogen content is predominantly affected by the fluctuation of the nitrate-nitrogen and organic-nitrogen concentrations, which results from the quantitative ratio of nitrogen forms. The tendency of fluctuations of the total nitrogen in the Danube, Mosoni Danube and in the right side river branch system was similar to each other. In comparison to the Danube water was the total nitrogen content in the Mosoni Danube at Vének profile slightly higher. Comparing to the previous year the maximal concentrations in January and February were slightly higher in 2004. The total nitrogen concentrations in the Danube fluctuated from 1 to 5.6 mg.l-1 (sporadically up to 8.4 mg.l-1), in the reservoir from 1 to 5.4 mg.l-1. In the right side river branch system and on the Mosoni Danube at Čunovo and Vének profiles the total nitrogen content varied from 1.3 to 6.5 mg.l-1, two values in February reached 7.6 mg.l-1 (Szigeti arm) and 8.46 mg.l-1 (Vének). The lowest amount of total nitrogen was found in the seepage canal. It varied from 1 to 2.8 mg.l-1, however in January and February 3.8 and 4.9 mg.l-1 were measured. Phosphates In the hydrological year 2004 the fluctuation of phosphate concentrations in the Danube water was similar as in the previous year. The measured maximums were slightly lower, however values recorded during the vegetation period slightly increased in comparison with the previous year. Phosphates concentrations in the Danube water fluctuated from 0.02 to 0.23 mg.l-1 – Fig. 2-8, in the reservoir from 0.03 to 0.19 mg.l-1. The phosphate concentrations in the right side river branch system varied from 0.02 to 0.24 mg.l-1, however one value in August at Helena sampling site reached 0.48 mg.l-1. The phosphates content in the Mosoni Danube at Čunovo sampling site fluctuated in the range from 0.02 to 0.15 mg.l-1, with one value of 0.29 mg.l-1 in October 2004. At the Vének profile the phosphates content was higher in comparison to the Danube water and varied from 0.18 to 0.7 mg.l-1. The lowest phosphate concentrations occurred in the seepage water (from 0.01 to 0.15 mg.l-1). In general higher values of orthophosphates concentrations occur in the winter period, lower values are characteristic for the vegetation period. Total phosphorus Concentration changes of the total phosphorus followed the seasonal concentration changes of phosphates. The total phosphorus concentration on all profiles, except the profile at Vének, situated on Mosoni Danube, fluctuated in the range from 0.02 to 0.25 mg.l-1. The total phosphorus concentrations at Vének fluctuated in the range 0.12-0.5 mg.l-1. The total phosphorus content in the seepage canal fluctuated in a narrow range from 0.01 to 0.08 mg.l-1, with one value in September reaching 0.19 mg.l-1. Nutrients - summary Seasonal fluctuation of individual parameters depends on biochemical processes in the water, while the lowest values occur mainly during the vegetation period. The largest changes in comparison to the previous years have been observed at the Bratislava profile on the Danube (No. 109), where increase of ammonium ion concentration was recorded, reaching the concentration level of years 1996-1997. The ammonium ion concentration increase was reflected on the other Danube sampling sites as well, however in less extent. In case of the rest parameters, belonging to nutrients no substantial changes were recorded in the hydrological year 2004. The nutrients content in the Danube water is potentially sufficient for development of eutrophic processes under other suitable conditions. 2.5. Oxygen and organic carbon regime parametersDissolved oxygen The dissolved oxygen content proportionally decreases with increasing water temperature in the Danube. The highest values mainly occur in February and March. Besides this the dissolved oxygen content depends on the assimilation activity of phytoplankton. In the hydrological year 2004 the dissolved oxygen content in the Danube water varied from 8 to 13.4 mg.l-1, sporadically up to 16 mg.l-1. The fluctuation of dissolved oxygen at selected profiles is shown on Fig. 2-9. The oxygen content in the Mosoni Danube at Čunovo intake structure fluctuated from 8 to 14.2 mg.l-1, with one low value of 6.2 mg.l-1 in September. At Vének profile it varied from 9 to 12.4 mg.l-1, except two occasions in August and September when the oxygen concentration reached 4.33 and 5.3 mg.l-1 respectively. The oxygen content in the reservoir it varied from 7.6 to 17 mg.l-1; in the right-side river branch system from 6.4 to 16.7 mg.l-1. The oxygen content in the seepage canal fluctuated from 6.4 to 12.5 mg.l-1. CODMn and BOD5 COD and BOD parameters are used for expressing the organic contamination of the water, they indicate the chemically and biologically degradable organic matter content. Higher values of COD and BOD usually occur at periods with higher flow rates in the Danube, when the water contains higher amount of natural organic matter. In the hydrological year 2004 the COD values at all measured profiles on Danube and Mosoni Danube at Čunovo intake structure fluctuated from 1 to 4.8 mg.l-1. On the Mosoni Danube at Vének profile the COD values were higher in comparison to the other observed sites (due to partially treated waste water coming from city Győr – the same is valid for the BOD) and varied in the range from 3.5 to 9.1 mg.l-1. The organic matter content in the seepage canal is low in long term and in 2004 fluctuated from 0.4 to 2.6 mg.l-1. The fluctuation of dissolved oxygen at selected profiles is shown on Fig. 2-10. The BOD values of the Danube water, reservoir and at Čunovo sampling site on the Mosoni Danube fluctuated in the range from 0.2 to 5.8 mg.l-1. The BOD values in the right side river branch system and at Vének on Mosoni Danube varied from 0.2 to 5.6 mg.l-1, sporadically up to 7.8 mg.l-1. The BOD in the seepage canal varied from 0.2 to 3.2 mg.l-1, however on Hungarian side at sampling site No. 0002 there were recorded one value of 7.12 mg.l-1 in June. Oxygen and organic carbon regime parameters - summary Based on the comparison of the oxygen content in 2004 with the long-term data at Bratislava and Medveďov sampling sites it can be stated that maximal values of dissolved oxygen content remained preserved, however in comparison to the year 2003 the minimal values increased. Maximal values of BOD in 2004 remained similar to values in 2003. The COD values after a slight increase in 2001-2002 decreased and in 2003-2004 reaches values below the long-term average. The TOC values after an increase in period 1993-1997 started to decrease in 1998 and in the period 2000-2004 fluctuate in a stabile range. The oxygen and organic carbon related parameters in the Danube reflect the seasonal assimilation activity of the phytoplankton and organic carbon oxidation processes. The measured data (1992-2004) indicate decreasing tendency of organic load at the Bratislava section of the Danube, which is related to the substantial wastewater treatment improvement in the upstream Danubian countries. Higher values of oxygen regime parameters (CODMn, BOD5) occur in period of higher flow rates in the Danube. The oxygen regime parameters at Vének are influenced by local pollution (pollution originating from city Győr) together with hydrological conditions at confluence with the Danube. 2.6. MetalsIron The amount of suspended solids influences the total iron content in the surface water. The mutual coherence of iron concentrations and suspended solids content in surface water is documented by the highest concentrations of iron measured at the time of highest suspended solids content. In hydrological year 2004 the iron concentrations in the Danube water, in Mosoni Danube at Čunovo, in the reservoir and in the right side river branch system as well were lower in comparison with the previous year and fluctuated mainly up to 0.51 mg.l-1, sporadically up to 1.05 mg.l-1. In Mosoni Danube at Vének profile the iron content is usually higher due to the character of catchment area (the water in the Rába river is rich in iron). In the hydrological year 2004 the iron concentrations were slightly higher than in the Danube water and fluctuated from 0.1 to 1.59 mg.l-1. The iron concentration in the seepage water fluctuated in narrower range up to 0.5 mg.l-1. Manganese Manganese, similarly to iron, occurs in surface water mainly in solid phase. The manganese concentrations in the Danube water mostly fluctuated in the range up to 0.09 mg.l-1, at Bratislava sampling site one value of 0.34 mg.l-1 occurred in May 2004. The manganese concentrations in the Mosoni Danube at Čunovo on the sampling point No. 3529 fluctuated up to 0.05 mg.l-1, on the sampling point No. 0001 up to 0.15 mg.l-1. At the Vének profile (No. 0012) values varied up to 0.18 mg.l-1. In the right side river branch system the measured manganese concentrations in 2004 varied up to 0.24 mg.l-1.The manganese content in the seepage canal is low, up to 0.1 mg.l-1, sporadically higher concentrations up to 0.26 mg.l-1 occurred. Heavy metals The concentration of most of the observed heavy metals in hydrological year 2004 fluctuated in the range of limits corresponding to the I. class of surface water quality. The detection limits for mercury on the Slovak and Hungarian sides correspond to II. and III. classes of surface water quality, depending on technical possibilities of individual laboratories. On the monitored sampling sites sporadically occurs values exceeding the detection limits of method used and in 2004 reached maximally 0.23 mg.l-1. Metals - summary Concentrations of the monitored metals are permanently low, mostly satisfies the limit values for the I. class of surface water quality. Exception is the mercury, which satisfies the limit values for II. and III. classes only, due to technical reasons. Values exceeding the limit values for II. and III. classes sporadically occur in case of iron and manganese as well. 2.7. Biological and microbiological parametersColiform bacteria The number of Coliform bacteria can determine the surface water bacteriological pollution. In the hydrological year 2004 in comparison with 2003 slight decrease of number of Coliform bacteria was evident in the Danube water. The number of Coliform bacteria at Bratislava profile (No. 109) varied up to 320 NrC.ml-1. The Coliform bacteria values at Rajka and Medveďov profile follow the fluctuation of values at Bratislava profile, while the number of Coliform bacteria were in long run lower comparing to the Bratislava sampling site (up to 100 NrC.ml-1). The bacteriological pollution, documented by the number of Coliform bacteria, at Medveďov profile in the main riverbed were lower comparing to the Rajka profile. The bacteriological pollution in the river arm system is lower in comparison to the Danube water and fluctuated in the range from 1 to 35 NrC.ml-1. An exception was the Helena profile at the beginning of the river branch system, where the number of Coliform bacteria gradually increased since July till October and reached values from 21 NrC.ml-1 to 250 NrC.ml-1. In 2004, similarly to the previous year, further improvement was observed in microbiological parameters along the flow path in the right side river branch system downstream of influent section. The bacteriological pollution of the reservoir and in Mosoni Danube at the Čunovo sampling site varied in the range from 2 to 140 NrC.ml-1. On the Mosoni Danube at the Vének profile the bacteriological pollution fluctuated in the range from 40 to 8000 NrC.ml-1. The seepage canal can be considered as the cleanest from the bacteriological point of view, the number of bacteria ranges up to 20 NrC.ml-1, sporadically up to 60 NrC.ml-1. Chlorophyll-a The chlorophyll-a concentrations refer to the quantity of phytoplankton and provide information about the eutrophic state of water. The growth of algae on the respective section of the river is represented by the relative increase of chlorophyll-a concentration between two compared profiles. In the hydrological year 2004 particularly the maximal values of chlorophyll-a decreased in the Danube water in comparison with the previous three years. The spring algae growth occurred from March to May and the maximal values reached 55 mg.m-3. Since then the chlorophyll-a concentration gradually decreased (Fig. 2-11). The situation in the reservoir differs from the sampling profiles on the Danube. The variability of mass development of phytoplankton and the culmination of chlorophyll-a content at individual sampling points in the reservoir is related to the local hydrological and climatic conditions. The chlorophyll-a content in the reservoir varied up to 55 mg.m-3 and during the year three waves of culmination occurred –March, May and August. However, local maximums occurred on individual sampling points during other months as well. In contrast to the previous year three waves of culmination (March, June, August) occurred in the right side river branch system (particularly in the Szigeti and Ásványi river arms) and an increase of maximums reached was recorded, especially during the second wave in June. The chlorophyll-a concentrations were higher in comparison with the Danube water and varied in the range from 2 to 116 mg.m-3. The amount of chlorophyll-a in the Mosoni Danube at the Vének profile was similar to the content in the Danube water, except the periods of algae growth culmination, when the chlorophyll-a concentrations were significantly higher, but the extreme value from the previous year did not occurred. The values varied from 2.4 to 90 mg.m-3. The chlorophyll-a concentration in the seepage water remained low and fluctuated from 0.6 to 16.6 mg.m-3, however one extreme value (82.88 mg.m-3) was recorded in June at the sampling point 0002. Saprobic index The saprobic index represents the self-purification ability of water, the ability to degrade organic pollution. The saprobic index in relation to the respective stretch of river represents also the water quality in the river. Based on measured data on the Slovak side the saprobic index values in the inspected water bodies (Danube river, Mosoni Danube, reservoir and seepage canals) in the hydrological year 2004 fluctuated in the range from 1.59 to 2.43, which correspond to beta-mezosaprobic state and mostly to the II. class of surface water quality. According to the data on Hungarian side the saprobic index values in the inspected water bodies (Danube, right side river arm system, Mosoni Danube and seepage canal) ranged from 2 to 2.75, which correspond to alpha-beta mezosaprobic state and mostly to the III. class of surface water quality. The course of the saprobic index at Rajka profile is shown on Fig. 2-12. These measured values of saprobic index are typical for this stretch of the river. The self-purification processes, at this level of the saprobic index, run mainly as oxidising processes. Time series data of saprobic index indicate slightly decreasing tendency during the last ten years, which means improving of water quality. Other biological parameters The observations of abundance and species composition of phytoplankton and zooplankton, and the determination of the saprobic index of macrozoobenthos were carried out at least two times in a year. Phytoplankton Minimal values of the phytoplankton abundance were recorded during the autumn and winter period, while the maximal values occurred in the spring. In the Danube water and in the reservoir the maximums occurred mostly from March to May. The abundance of phytoplankton in the Danube water fluctuated varied up to 20320 In.ml-1 (sampling site at Medveďov, May 2004). The abundance of phytoplankton in the reservoir fluctuated up to 36452 In.ml-1 (sampling site at Kalinkovo No. 308, March 2004). The diatoms Bacillariophycea-Centrales represented the dominant group of the phytoplankton in the Danube water in 2004 again. In less extent the diatoms Bacillariophycea-Pennales (7-17 %) and the green algae (1-8 %) were present as well. The Diatoms Bacillariophycea-Centrales created 72-81 % of the phytoplankton in the Danube water. The most frequent were families Cyclotella g. sp., Skeletonema potamos, Stephanodiscus hantzschii, Stephanodiscus sp. div.. From among the Bacillariophycea-Pennales the Asterionella formosa, Navicula avenacea, Nitzschia fruticosa, Nitzschia sp., Synedra ulna, Synedra acus, Synedra nana dominated. In the green algae group the species Koliella longistea, Scenedesmus acuminatus, Scenedesmus quadricauda, Chroomonas nordstedtii and Chloromonas sp. dominated. The composition of phytoplankton in the seepage canals differs from its composition in the Danube water. The percentage of different groups in the right side seepage canal (Čunovo sampling site) was the following: Bacillariophycea-Centrales – 68 %, Bacillariophycea-Pennales – 16 %, Chrysophyceae – 8 %, Cryptophyceae – 3.4 %, Chlorophyceae – 2.9 %. The percentage of different groups in the left side seepage canal (Hamuliakovo sampling site) was the following: Bacillariophycea-Pennales – 38 %, Cyanophyceae – 20 %, Volvocales – 16.8 %, Bacillariophycea-Centrales – 8.8 %, Chrysophyceae – 4.8 % and Chlorococalles – 2.3 %. The abundance of phytoplankton in the left side seepage canal fluctuated from 44 to 142 In.ml-1 (sampling site No. 317 at Hamuliakovo) and in the right side seepage canal it varied from 26 to 6050 In.ml-1 (sampling site No. 3531 at Čunovo). More intensive algae growth in the right side river branch system was observed from March to June along the main river branch between the Szigeti (18252 NrC.ml-1) and the Ásványi arm (7960 NrC.ml-1); the most intensive algae growth occurred in March. The amount of phytoplankton in Mosoni Danube followed the changes in the Danube water. In the Vének profile downstream of Győr the rate of algae accumulation was partly influenced by the hydro-morphological characteristic, which differ from those of the upper section, and partly by nutrients delivered by the partially treated wastewater and by watercourses joining the Mosoni Danube at Győr. Zooplankton The dominant groups of zooplankton in the Danube water in 2004 were represented by Rotatoria (82-96 %), Copepoda (2-54 %) and Cladocera (0-10 %) groups. According to the species composition the most abundant were families Keratella, Brachiomus, Polyarthra, Filinia and Conochillus in Rotatoria group, Daphnia (Daphnia cucullata) and Bosmina families (Bosmina longirostris) in Cladocera group, and Cyclopidae family in Copepoda group similarly to the previous year. In the seepage canals in 2004 the Rotatoria (42-73 %), Copepoda (26-54 %) and Cladocera (1-10 %) groups were dominant. The most abundant, similarly to the previous year were species of Keratella, Brachiomus, Polyarthra, Asplanchna, Conochilus, Trichocerca, Notholca families of the Rotatoria group and juvenile individuals of Cyclopidae family of the Copepoda group. Species Bosmina longirostris, Daphnia cucullata, Alona sp,. Alonella, Cydoridae of the Cladocera group occurred sporadically only. In the hydrological year 2004 decrease of zooplankton abundance was detected on most of observed sampling sites in comparison with the previous year. Macrozoobenthos The saprobic index of macrozoobenthos at the observed sampling profiles corresponds to the bottom type of the individual sampling sites. At profiles with gravel bottom the saprobic index of macrozoobenthos correlates with saprobic index of biosestón, which characterizes the quality of the through-flowing water and the saprobic indexes (saprobic index of biosestón, periphyton and macrozoobenthos) at observed sites mostly corresponds to beta-mezosaprobic state. The second group is represented by profiles with sandy-muddy bottom. The values of saprobic index of macrozoobenthos are slightly shifted towards higher values in comparison to the saprobic index of biosestón and reaches beta-alpha-mezosaprobic or alpha-mezosaprobic state, which characterise the quality of sediments at the sampling site. The saprobic index of water at the observed sites mostly reaches beta-alpha-mezosaprobic state. The faunistic results of aquatic macroinvertebrate communities of the Danube river remained very similar to those of previous years. The saprobic index results in the Danube water in the longitudinal profile from Bratislava to Komárno correspond to beta-mezosaprobic state, which is typical for this stretch of the river. The average saprobic index values in 2004 varied from 2.04 (at Dobrohošť and Komárno) to 2.30 (at Dunakiliti). The dominant macrozoobenthos species were individuals of aquatic Gastropoda, Oligochaeta, Malakostrata and Chironomidae, e.g. Dikerogammarus villosus, Dikerogammarus bispinosus, Dikerogammarus haemobaphes, Pontogammarus obesus, Brachycentrus subnubillus, Cricotopus sp., Radix peregra, Ancylus fluviatilis, Theodoxus danubialis, Dreissena polymorpha, Jaera istrii on a gravel bottom and Corophium curvispinum, Lithoglyphus naticoides, Limnomysis benedeni on a sandy-muddy bottom. The improvement of the water quality in the Danube was proved also in 2004 by occurrence of species demanding clean water: Ancylus fluviatilis, Theodoxus fluviatilis, Diamesa sp., Dreissena sp., Eiseniella tetraedra. The saprobic index at sampling sites in the reservoir varied from 2.11 (at Kalinkovo-navigation line) to 2.88 (at Šamorín No. 311), which correspond to beta-alpha mezosaprobic state. Dominant species of macrozoobenthos of the muddy bottom were Hypania invalida, Lumbricidae g. sp. div., Potamopyrgus antipodarum, Pisidium sp., Sphaerium rivicola, Procladius choreus, Phytochironomus fodies, Chironomus sk. reductus and Tubificidae g. sp.. The macrozoobenthos communities in the right side river branch system in the evaluated year did not changed significantly. Detailed evaluation is given in Part 7 – Biological monitoring (Mollusca, Odonata, Ephemeroptera, Trichoptera). Periphyton Based on the obtained results it can be stated that the saprobic indexes of periphyton on every sampling site in the Danube in 2004 varied in the range of better beta-mezosaprobic state. The saprobic indexes of periphyton ranged from 1.31 (at Komárno) to 1.9 (at Dobrohošť). The range of values was lower than in previous years. Taking into account the species diversity of the periphyton at the Danube sampling sites the Diatoms dominated (Navicula, Nitzschia, Fragilaria, Cymbella, Gomphonema, Achnanthes, Amphora, etc.). 2.8. Quality of sedimentsSampling of riverbed sediments in the frame of joint Slovak-Hungarian monitoring had been performed in September 2004 by the Slovak Party and in March and September by the Hungarian Party (Fig. 2-2). Inorganic and organic micro components were analysed and the content of total phosphorus and nitrogen was also determined. In the year 2004, similarly as in 2003 the Hungarian and Slovak Party in their National Annual Reports from environmental monitoring used different standards for sediment quality evaluation. Slovak Party used the “Canadian Sediment Quality Guideline for Protection of Aquatic Life” (CSQG) published in 2002. The Hungarian Party for sediment quality evaluation used the “Provincial Sediment Quality Guidelines” (PSQG), so called the “Canadian list”. Detailed evaluations are parts of the respective National Annual Reports. According to the “Canadian Sediment Quality Guideline for Protection of Aquatic Life” the content of heavy metals in sediments at observed sampling sites did not exceeded limits of Probable Effect Level (PEL) in any case. The content of organic pollution did not exceeded limits of Probable Effect Level (PEL) at any sampling site as well, except the benzo(a)anthracene at sampling site No. 309. In case of lindane and heptachlorine the analytical detection limit was higher than the limit of Probable Effect Level (PEL). According to the “Provincial Sediment Quality Guidelines”, used by the Hungarian Party, content of heavy metals and organic pollution (PAH) at designated sampling sites did not reached limits of the “Severe Effect Level” (SEL) in any case. However, there were sampling sites where the concentrations of heavy metals, except cadmium, exceeded the limits of the “Lowest Effect Level” (LEL). Based on the obtained results it can be stated that the highest accumulation of heavy metals was detected at the Vének profile on the Mosoni Danube. Contamination of PAH did not exceeded the limits for “Lowest Effect Level” (2000 mg.kg-1) at any of sampled sites, the highest concentration was measured at Vének on the Mosoni Danube (847 mg.kg-1). The total phosphorus content in sediments exceeded the limit value of “Lowest Effect Level” (600 mg.kg-1) at all Hungarian sampling sites, at Medve and Dunaremete in the spring, in the Szigeti river arm in autumn, and on the rest observed sites in case of both sampling. The measured values did not exceed the limit of “Severe Effect Level” (SEL – 2000 mg.kg-1) at any of observed sites. The total nitrogen content in sediments exceeded the limit value of “Lowest Effect Level” (550 mg.kg-1) at all sampling points. However, the total nitrogen contents did not exceed the “Severe Effect Level” (4800 mg.kg-1) at any of sampling sites, except the Ásványi arm in the spring when 5026 mg.kg-1 was measured. 2.9. Differences in the data measured by the Slovak and Hungarian PartiesThis chapter is intended to show, what results were reached in elimination of the differences in data measured by the Hungarian and Slovak Party. Since January 2004 new “Methodology for sampling, analysis, evaluation and results presentation of the water quality in the Danube and its tributaries” was applied in the frame of the Transboundary Water Commission. The methodology was elaborated in 2003 and its aim was to optimise the principles for unified method of sampling for physical, chemical, hydrobiological and radiochemical analysis, and method of evaluation and presentation of Slovak-Hungarian Boundary Rivers monitoring results. The optimisation was proposed in agreement with the monitoring goals of the Transboundary Water Commission. Based on the results achieved in the year 2004 it can be stated that at sampling sites, which were sampled at the same time and at the same place, good concordance was reached in a major part of examined parameters. However, there still exist parameters where the individual values measured by one of the Parties are higher or lower than values determined by the other Party (e.g. Mn, pH, dissolved oxygen, BOD5). The course of parameters like conductivity, hydrogencarbonates, chlorides, sulphates, phosphates, Ntotal, CODMn and saprobic index is similar, but the values are either higher or lower at one of the Parties. Separate group are the heavy metals where either the detection limit significantly differs (e.g. Cd, Cr, Zn) or there are differences in measured values (e.g. Cu, Ni. Hg) 2.10. ConclusionsIncreased or decreased values of some parameters in the Danube, seen from the long-term evaluation, were already observed at Bratislava profile (109), which represents the entering water quality and where the water quality of the Danube generally improved. The better surface water quality consequently influences the water quality in the territory influenced by temporary measures, realised according to the Agreement. The water quality in the spring and summer period was positively influenced by the fact that from April to September higher flow rates occurred in the Danube in comparison with the same period in the previous year. The tributaries and local pollution of settlements, besides the water supply influence, form the water quality in Mosoni Danube. Before the confluence with the Danube the water quality state is labile (variable in time), which is proved by unfavourable values of some parameters (dissolved solids, Coliform bacteria, CODMn, BOD5, sulphates, nutrients and saprobic index). In the following table Tab. 2-3, orientational classification of the individual sampling sites into the quality groups was done according to the new trans-boundary water quality criteria. There are differences in the measured data between the Hungarian and Slovak sides, so that they could be classified into different quality groups. Table 2-3: Orientational classification of parameters or group of parameters according to the agreed limits for surface water quality classification
The quality classes are determined according to the 90 % durability of measured values (C90). This classification does not distinguish in what conditions were the respective values recorded (e.g. hydrological conditions – floods, high or extremely low flow rates, oscillation of some parameters). The given orientational classification gives only comparison of the water quality inflowing to the influenced area (sampling site at Bratislava) and the water quality leaving the influenced region (sampling site at Medveďov). The classification of the sampling sites in the Danube old riverbed and sampling sites on the Mosoni Danube, right side river branch system and in the seepage canal were done in similar way. Part of the observed parameters shows a seasonal fluctuation, which consequently influences the categorisation into a water quality class. In case that a range of classes are given (e.g. I-II) it represents natural seasonal fluctuation of individual biogenic parameters or dependence on climatic conditions. The water quality class in brackets means that measured value of the respective parameter reached the given water quality class, but it occurred once, maximally two times in a hydrological year. From the above given table is clear, that the quality of water entering the hydropower system and the quality of water leaving the system is very similar.
|
|||||||||||||||||||||||||||||||||||||||||||||||||||||||||||||||||||||||||||||||||||||||||||||||||||||||||||||||||||||||||||||||||||||||||||||||||||||||||||||||||||||||||||||||||||||||||||||||||||||||||||||||||||||||||||||||||||||||||||||||||||||||||||||||||||||||||||||||||||||||||||||||||||||||||||||||||||||||||||||||||||||||||||||||||||||||||||||||||||||||||||||||||||||||||||||||||||||||||||||||||||||||||||||||||||||||||||||||||||||||||||||||||||||||||||||||||||||||||||||||||||||||||||||||||||||||||||||||||||||||||||||||||||||||||||||||||||||||||||||||||||||||||||||||||||||||||||||||||