PART 1
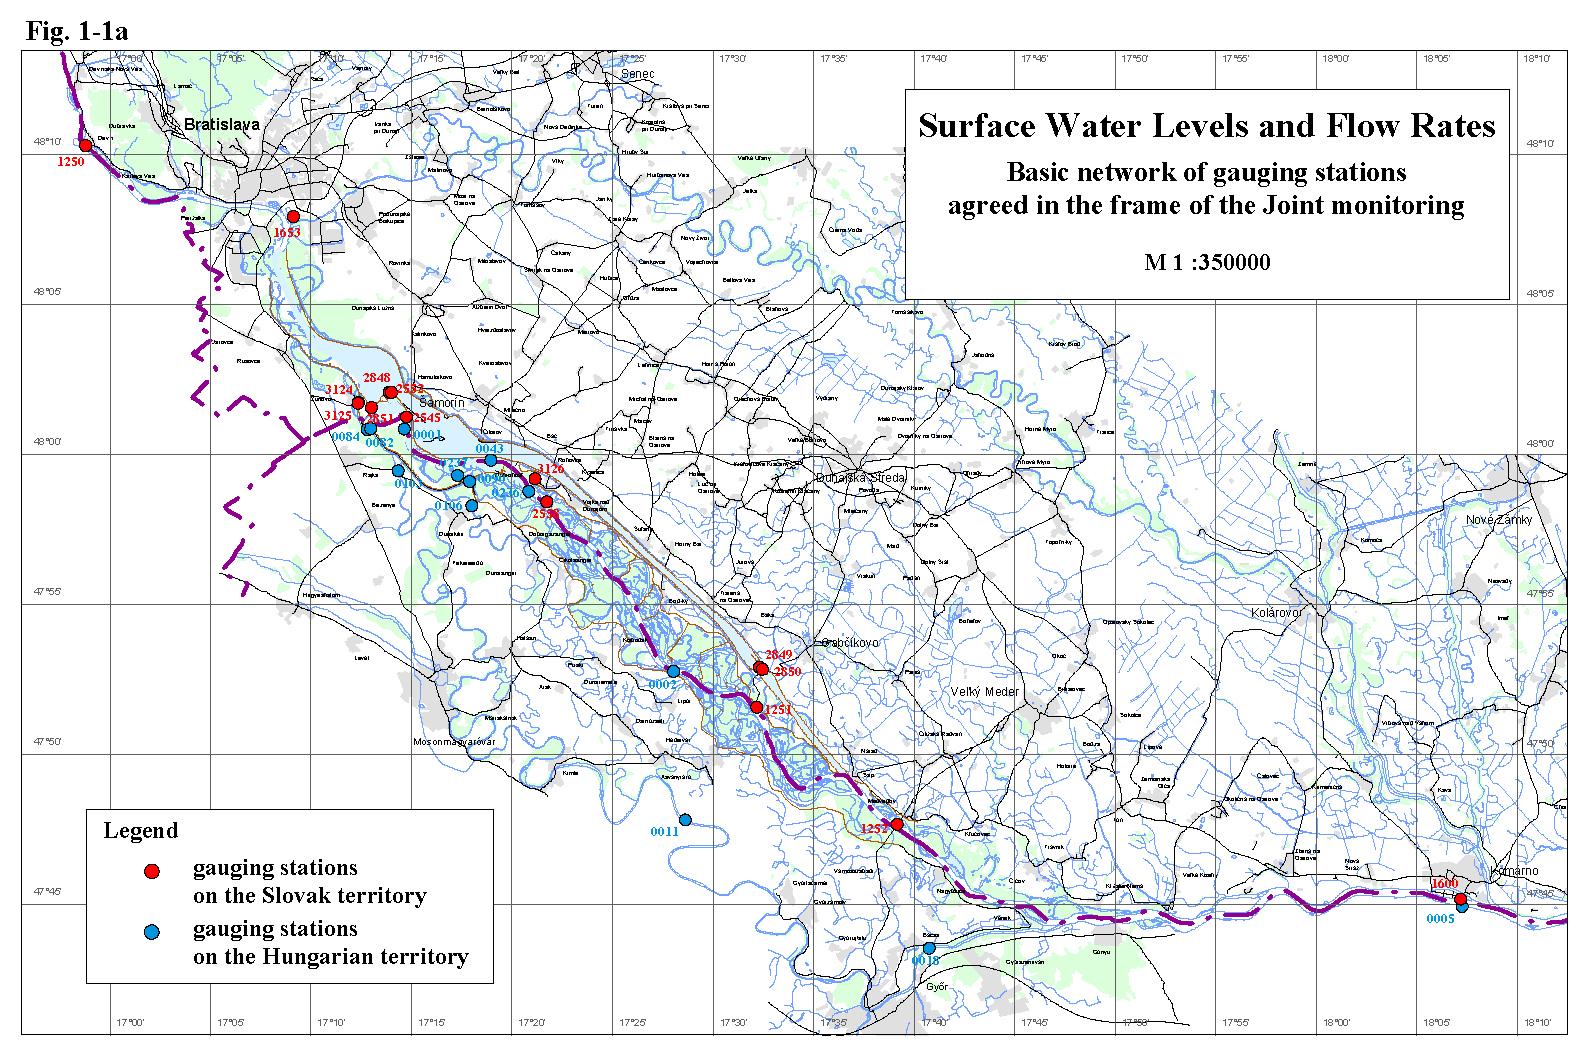
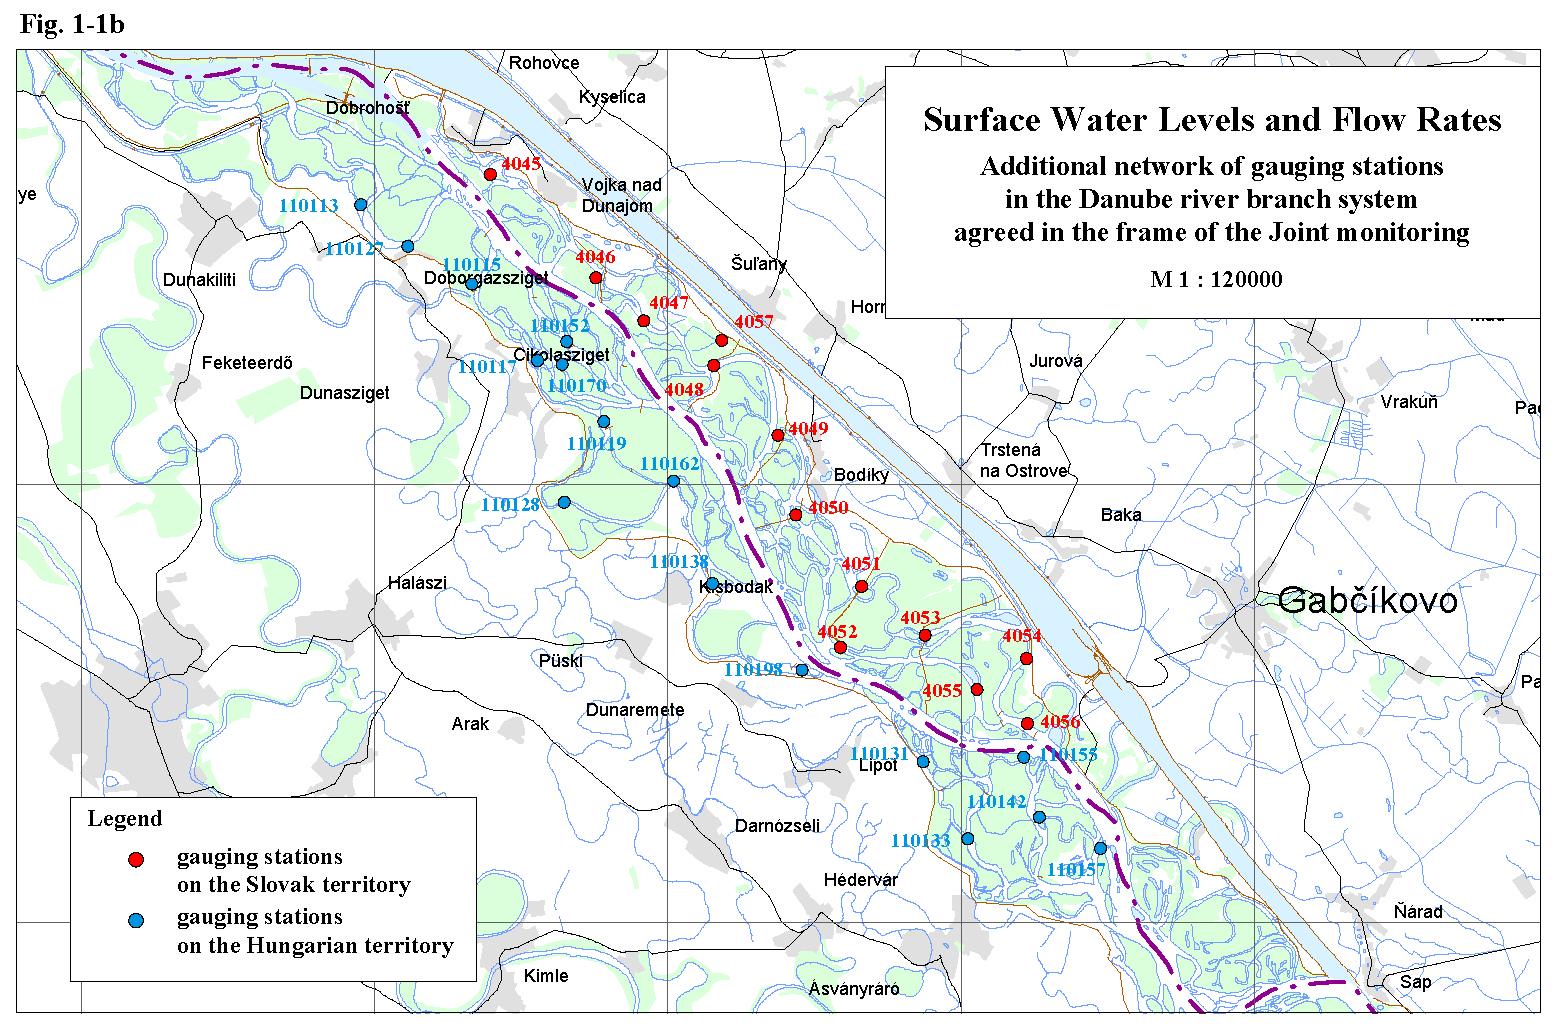
Surface water levels and flow ratesThe monitoring of surface water levels and flow rates has not changed comparing to the previous year. Surface water level recording in the hydrological year 2004 were carried out on 28 gauging stations on the Slovak side and 29 gauging stations on the Hungarian side (Tab. 1-1). On several gauging stations flow rate calculations were performed (10 gauging stations on each side). The situation of observation network is shown on Fig. 1-1a, Fig. 1-1b. The Parties in the intergovernmental Agreement have undertaken to mutually exchange data from agreed gauging stations. Joint flow rate measurements helped the joint evaluation of flow rates discharged into the Danube downstream of the Čunovo dam and into the Mosoni branch of the Danube. Based on mutual evaluation of joint measurements agreed time series data were accepted. These data create the basis for joint evaluation of measures and water supply realised according to Articles 1-3 of the Agreement. Table 1-1: List of gauging stations
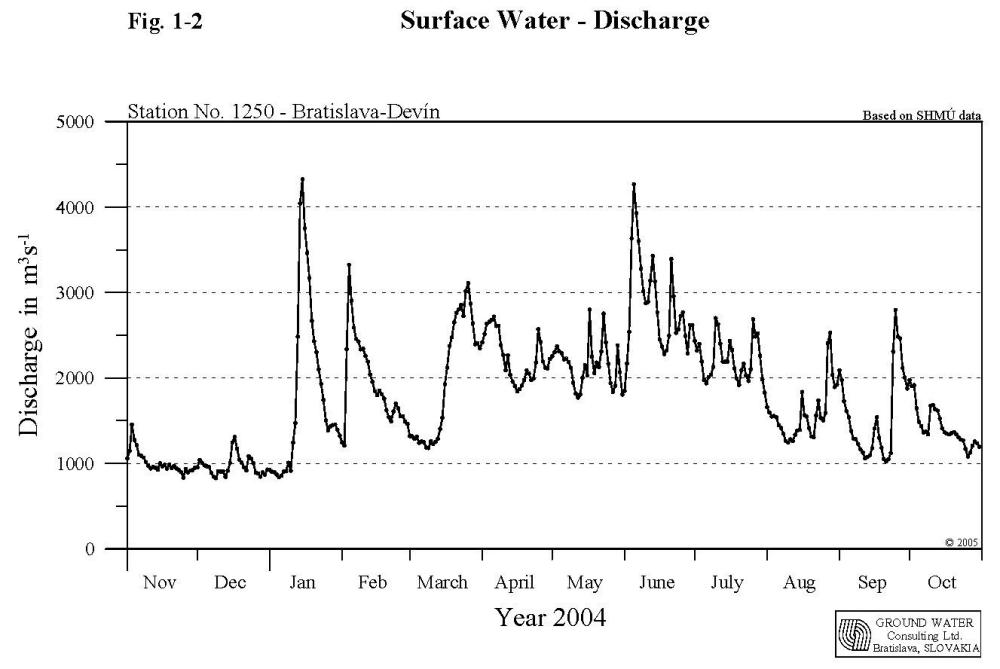
In the frame of intergovernmental Agreement, signed on April 19, 1995, a temporary water management regime was set up. It was agreed that in the case of average annual flow rate of 2025 m3s-1 at Bratislava-Devín gauging station the annual average of 400 m3s-1 should be discharged into the Danube old riverbed downstream of Čunovo. The actual daily amount of water is governed by the flow rate coming to the Bratislava-Devín profile, taking into consideration the rules of operation described in the Annex 2 of the Agreement. The flow rate in vegetation period, depending on hydrological conditions, should fluctuate from 400 to 600 m3s-1; in non-vegetation period the flow rate should not be less than 250 m3s-1. In case of floods the amount of water above 600 m3s-1 discharged through the inundation weir is not taken into consideration when the annual average is calculated. Additional 43 m3s-1 of water was agreed in the Agreement to be discharged into the Mosoni branch of the Danube and the right side seepage canal. The gauging station Bratislava-Devín plays the key role in determination of water amount discharged into the Danube old riverbed downstream of the Čunovo dam. The annual minimum flow rate occurred on December 9, 2003, when the average daily flow rate was 827.1 m3s-1, the annual maximum flow rate occurred on January 14, 2004, when it reached 4864 m3s-1 (maximal average daily flow rate occurred on January 15, 2004 and reached 4327 m3s-1). The average annual flow rate in this station in the hydrological year 2004 was 1807 m3s-1, which was the second lowest annual average flow rate observed since 1992 (Tab. 1-2). Considering the course of water levels and flow rates during the hydrological year 2004 it can be stated that no unusual values occurred. January, February and June were water rich months; while November and December 2003, May July, August and September 2004 belonged to the dry months. Extremely water rich months or extremely dry months did not occur. Table 1-2: Average annual flow rates
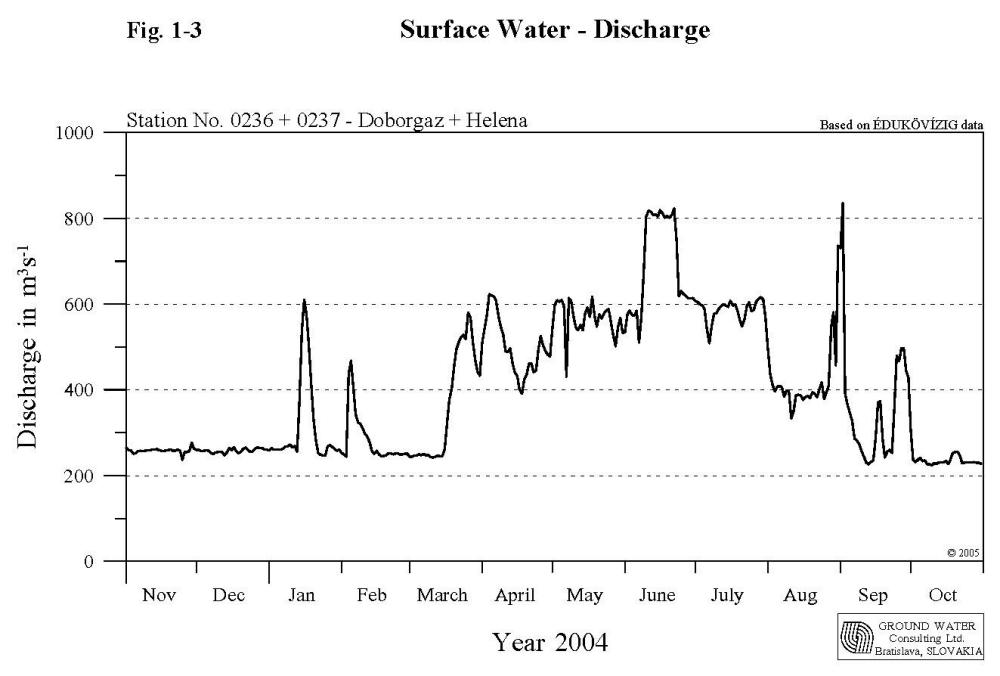
Low flow rates in the Danube occurred from the beginning of the hydrological year till the middle of January 2004. Rich precipitation and higher temperatures at the end of the first decade of January caused a sudden increase of flow rate, which culminated on January 14, 2004 at 4864 m3s-1 (yearly maximum). After a continuous decrease of flow rate a new discharge wave occurred at the beginning of February, culminating on February 4, 2004 at 3500 m3s-1. The flow rate became to decrease after the culmination, and decreased till the middle of March. Then the average daily flow rates varied between two and three thousands m3s-1 till the end of March. The flow rate in the Danube during April and May was balanced and varied around 2000 m3s-1. At the end of May three small discharge waves occurred, and the highest culminated at 3082 m3s-1. Due to the rich precipitation at the beginning of June sudden increase of flow rate occurred in the Danube, culminating on June 5, 2004 at 4592 m3s-1. After a temporary decrease of flow rate a new discharge wave occurred, culminating at 3610 m3s-1. The situation reoccurred in the middle and at the beginning of the third decade of June again. However, considering the flow rate no extreme values occurred and regarding the long term values this month could be evaluated only as an averagely water rich month. During July the flow rates varied a lot, however no one of the four flow rate increases exceeded the 3000 m3s-1. At the end of July and in the first half of August the flow rate decreased. In the second half of August three discharge waves of less importance occurred; the highest one reached 2780 m3s-1. After the culmination the flow rate decreased almost to 1000 m3s-1. In the third decade of September sudden increase of flow rate occurred, reflecting rich precipitation in the German and Austrian catchment area. After this increase the flow rate continuously decreased till the end of the hydrological year 2004. The course of flow rates during the hydrological year 2004 at gauging station No. 1250 - Bratislava-Devín is shown in Fig. 1-2. 1.1. Discharge into the Danube downstream of ČunovoThe determination of the average daily amount of water discharged into the Danube downstream of Čunovo dam was based on average daily flow rates determined at stations Doborgaz and Helena (Fig. 1-3). The monthly characteristics of the daily average flow rates into the Danube in the hydrological year 2004 were as follows:
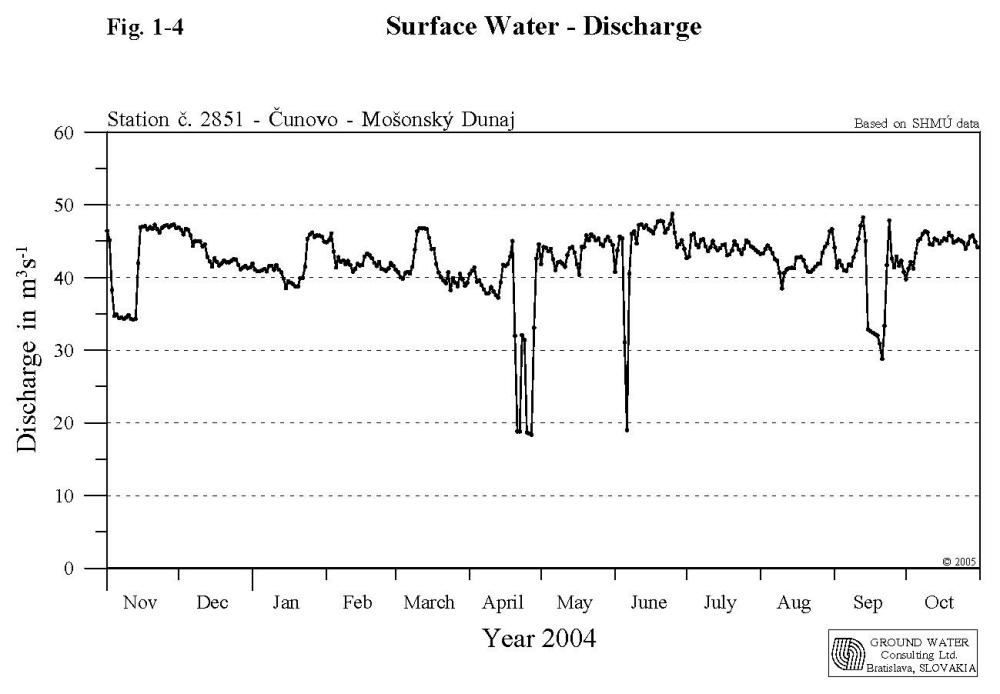
The average annual flow rate in the Danube at Bratislava-Devín profile in the hydrological year 2004 was 1807 m3s-1. Taking into consideration obligations envisaged in the intergovernmental Agreement the Slovak Party was obliged to release an average annual discharge of 356.9 m3.s-1 into the Danube riverbed downstream of Čunovo dam. The total average annual discharge released to the Danube downstream of Čunovo was 402.4 m3s-1. During the hydrological year 2004 there was no needs to release amount of water into the riverbed downstream of Čunovo exceeding 600 m3s-1 due to high flow rate in the Danube. However, due to technical reasons higher amount of water was discharged in two occasions. Amount of 800 m3s-1 water was discharged to the Danube old riverbed downstream of Čunovo on the request of the Hungarian side from June 9, 2004 to June 23, 2004. An artificial flooding was realized in the right side inundation area. The second increase of discharge into the old riverbed was realized from August 31, 2004 to September 2, 2004 due to technical needs of the Slovak side. Because the water amount exceeding 600 m3s-1 in June was discharged for ecological purposes and on request of the Hungarian side it was taken into account when the average annual flow rate was calculated. When subtracting the amount of water exceeding 600 m3s-1, released due to the technical needs of the Slovak side (3 values), the average annual flow rate of 401.0 m3s-1 is obtained, which represents 112.4 % of the amount requested by the Agreement. The yearly average minimum of 223.9 m3s-1 in the Danube old riverbed was measured on October 10, 2004; the yearly average maximum of 835.4 m3s-1 was recorded on September 2, 2004. When evaluating the amount of water discharged to the Danube old riverbed, it can be stated that Slovak Party fulfilled the average annual discharge jointly agreed in the intergovernmental Agreement. Taking into consideration the minimal values prescribed in the Agreement (in the winter period not less than 250 m3s-1, in the vegetation period at least 400 m3s-1) it can be stated that the minimal daily average discharges in the winter period were lower during October 2004. The minimal daily average discharges in the summer period, except of two days in August, were satisfied. 1.2. Discharge into the Mosoni branch of the DanubeThe discharge into the Mosoni branch of the Danube according to the intergovernmental Agreement should be 43 m3s-1, which is composed by the discharge released to the Mosoni branch of the Danube through the intake structure at Čunovo and the discharge through the seepage canal. Discharge measurements are carried out downstream of the intake structure on the Slovak territory at 0.160 rkm and upstream of lock No. I on the Hungarian territory. The average daily discharges were agreed after the joint evaluation of joint discharge measurements performed at both profiles. In the evaluation the data measured just downstream of the intake structure were considered (Fig. 1-4). The monthly characteristics of the amount of water released into the Mosoni Danube through the intake at Čunovo in the hydrological year 2004 were as follows:
The average annual discharge was 42.23 m3s-1. The minimal daily average discharge was 18.40 m3s-1; the maximal daily average discharge was 48.76 m3s-1. The flow rate in the right side seepage canal was measured at two sites as well. The first is on the Slovak territory at Čunovo; the second is placed on the Hungarian territory at lock No. II. In the evaluation the data observed at lock No. II were considered. The monthly characteristics of the flow rates recorded at lock No. II in the hydrological year 2004 were as follows:
The average annual flow rate was 2.43 m3s-1. The minimal daily average discharge was 1.04 m3s-1; the maximal daily average discharge was 5.40 m3s-1. The monthly characteristics of the total flow rate released into the Mosoni Danube in the hydrological year 2004, consisting of the amount of water discharged through the intake structure at Čunovo and amount of water flowing in the right side seepage canal were as follows:
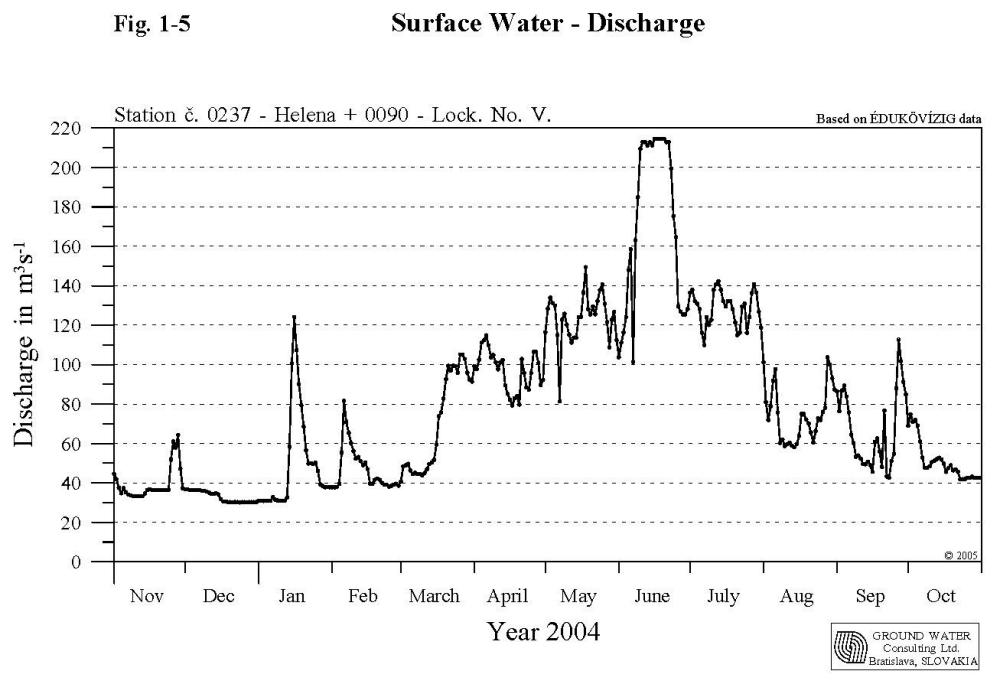
The total average annual flow rate was 44.65 m3s-1, which represents 103.8 % of the agreed amount. The minimal daily average discharge was 20.78 m3s-1; the maximal daily average discharge was 52.71 m3s-1. Due to the decreased exfiltration into the seepage canal the hydrological conditions did not allow continuous releasing of 3 m3s-1, which are envisaged in the Agreement. However, the total water amount of 43 m3s-1 envisaged in the Agreement, discharged through the Mosoni Danube and through the seepage canal, was fulfilled. 1.3. Water distribution on the Hungarian territoryThe goal of the water distribution on the Hungarian side is to provide continuous water supply into the river branches in the inundation area, into the river branches on the flood-protected area and into the Mosoni Danube. 1.3.1. Water supply into the inundation areaThe river branches in the inundation area on the Hungarian side can be supplied by water from two sources: a) Through three openings in the Danube riverbank, by manipulating the water level increased by the submerged weir and the Dunakiliti dam. The total inflowing discharge is measured at Helena profile. b) From the seepage canal through the lock No. V. Joint flow rate measurements by both Parties were performed at the Helena profile too. The measurements were jointly evaluated and average daily flow rate data were accepted. The monthly flow rates characteristics at Helena profile in the hydrological year 2004 were as follows:
The average annual flow rate was 60.67 m3s-1. The minimal daily average discharge was 0.00 m3s-1; the maximal daily average discharge was 214.5 m3s-1. The monthly flow rates characteristics at the lock No. V in the hydrological year 2004 were as follows:
The average annual flow rate was 18.67 m3s-1. The minimal daily average discharge was 0.00 m3s-1; the maximal daily average discharge was 40.70 m3s-1. The monthly flow rates characteristics of the total amount of water released into the inundation area in hydrological year 2004 (Fig. 1-5):
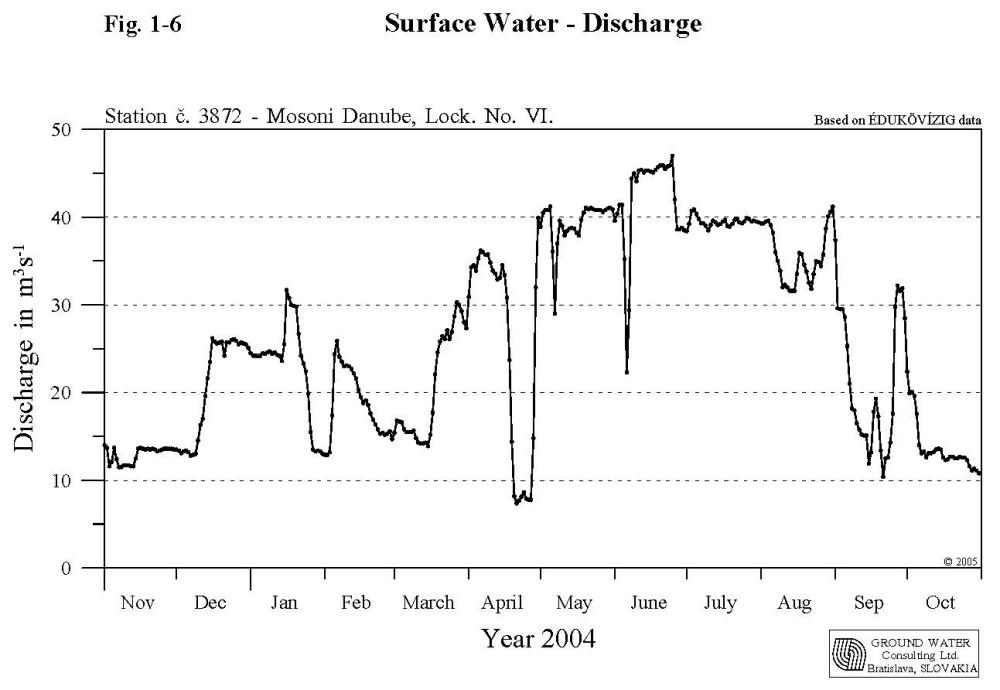
The total average annual flow rate supplied into the river branches in the inundation area was 79.34 m3s-1. The minimal daily average discharge was 30.10 m3s-1; the maximal daily average discharge was 214.5 m3s-1. 1.3.2. Water supply into the Mosoni DanubeThe water supply into the Mosoni Danube is secured from the seepage canal through the lock No. VI (Fig. 1-6). The flow rate is measured at the profile downstream of the lock. The monthly characteristics of flow rates through the lock No. VI in hydrological year 2004 were as follows:
The average annual flow rate in the Mosoni Danube at lock No. VI. was 26.14 m3s-1. The minimal daily average discharge was 7.40 m3s-1; the maximal daily average discharge was 47.00 m3s-1. During the non-vegetation period low water period was simulated in the Mosoni Danube as well. This was reached by redirecting of a large part of the water from the seepage canal into the inundation area through the lock No. V., while the water amount taken from the Danube upstream Dunakiliti was reduced. Besides its water supply function the lock No. I has also a flood protection function. It prevents floods to enter the flood-protected area. 1.4. The Danube water level characteristics on the Čunovo-Vámosszabadi stretchThe Danube stretch between Čunovo and Vámosszabadi can be divided into four different sections according to the prevailing influence. These sections can be characterised by data obtained from the following gauging stations: Rajka and Hamuliakovo, Dunakiliti, Doborgaz and Dobrohošť, Dunaremete and Gabčíkovo. Vámosszabadi and Medveďov. The characteristics of four sections on the Čunovo-Vámosszabadi stretch in the hydrological year 2004 are the following: a) Čunovo - Dunakiliti section. Since
construction of the submerged weir the water level in this section is impounded. This impounded section allows the water supply into the right side
river branch system. The amount of water released to the river branch system is
determined by water level regulation at the Dunakiliti dam. The water level is
kept in the mid-water riverbed. The average flow velocities fluctuated in the
range between 0.34-0.81 ms-1. Even if no flood occurred during the hydrological
year 2004, discharge exceeding 600 m3s-1 was released
into the Danube old riverbed in two occasions. From June 9, 2004 to June 23,
2004 water amount of 800 m3s-1 was discharged to the
Danube old riverbed downstream of Čunovo on the request of the Hungarian side,
due to artificial flooding of the right side inundation area. From August 31, 2004 to September 2, 2004 to keep the water
level in the Danube riverbed downstream of the Čunovo dam higher, due to
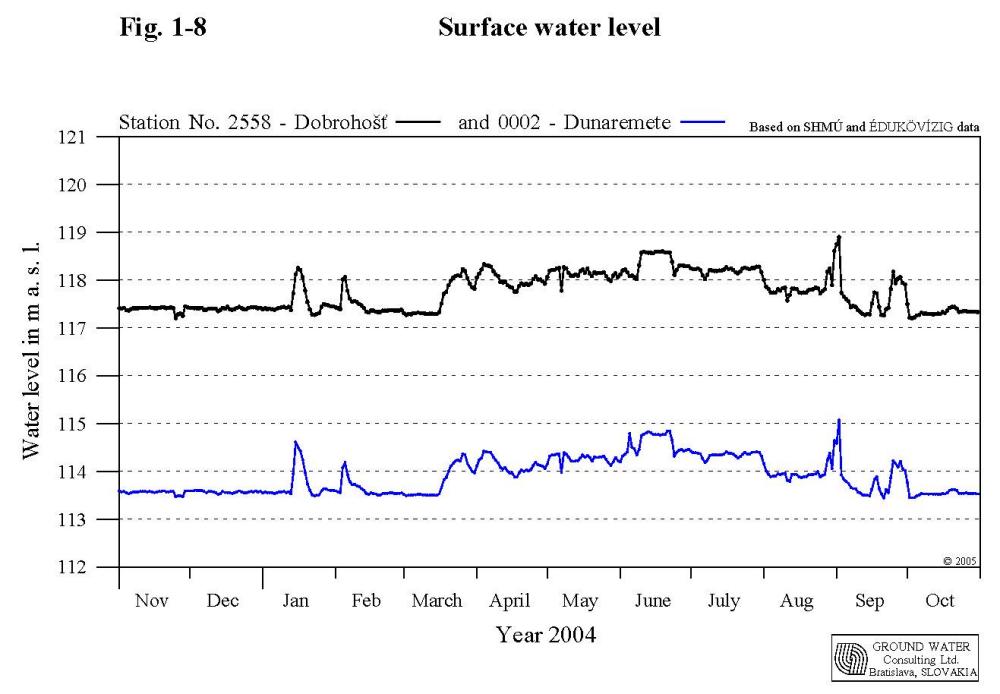
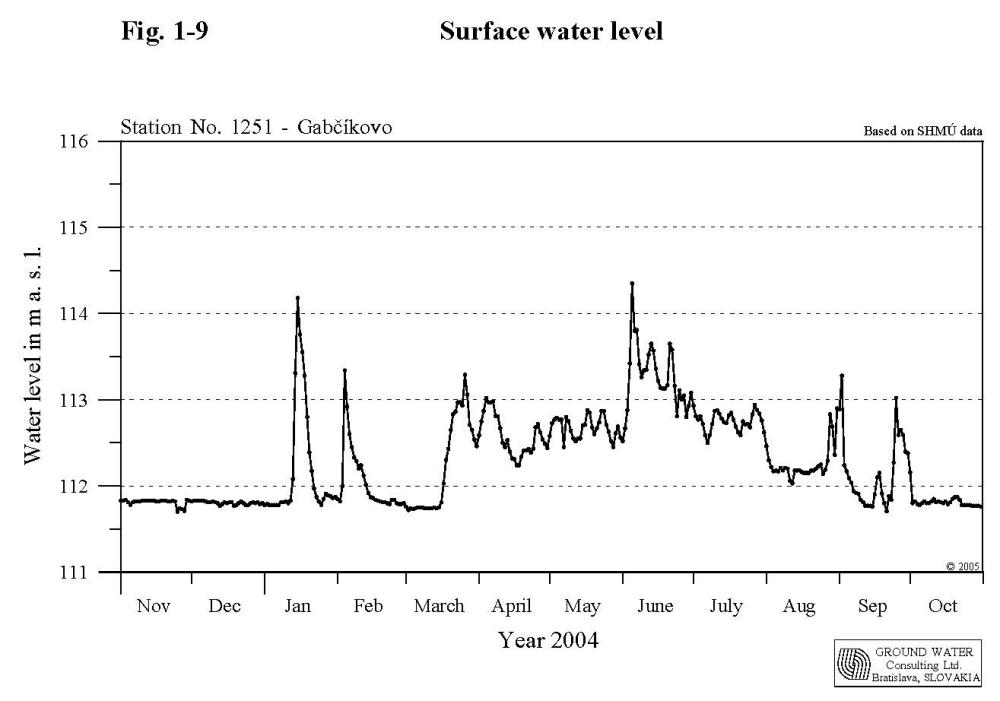
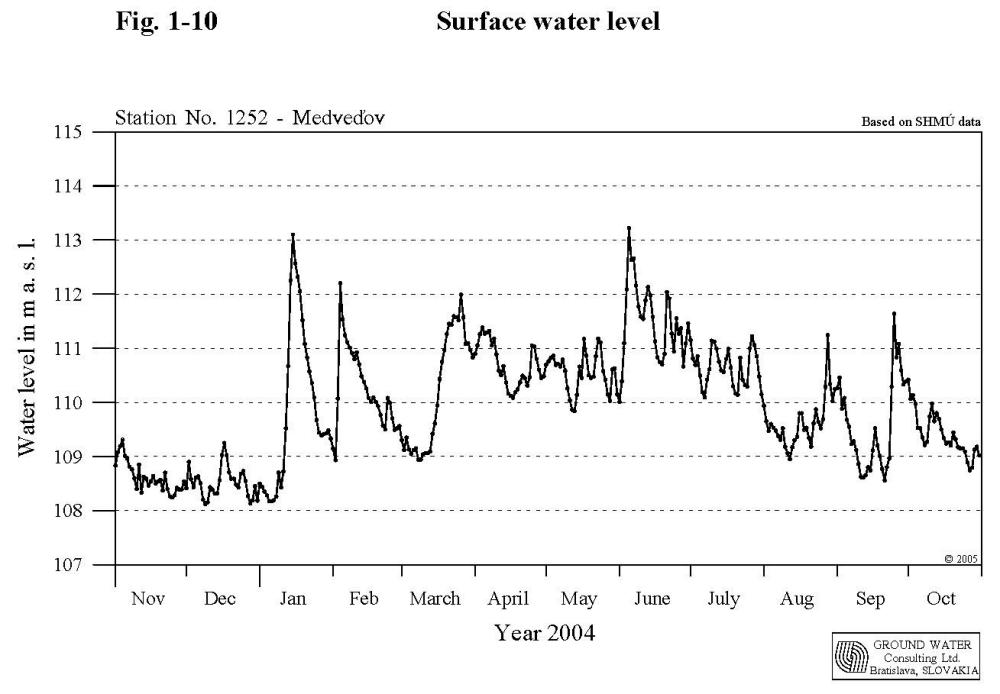
technical needs of the Slovak side. b) Section between Dunakiliti and Dunaremete. This section of Danube is not influenced by any measures and the water level is determined only by the flow rate in this riverbed section. In the upper part of this section the water level in river branches is about 3 m higher than the water level in main riverbed. The average daily water level at the Dobrohošť gauging station (rkm 1838.6) fluctuated in the range from 117.20 to 118.90 m a. s. l. and the average annual water level was 117.75 m a. s. l. The average daily water level in the Dunaremete profile (1825.5) fluctuated from 113.44 to 115.07 m a. s. l. and the average annual water level was 113.91 m a. s. l (Fig. 1-8). The average flow velocities fluctuated in the range between 0.64-1.18 ms-1. c) Section between Dunaremete and Sap. The water level in this section is influenced by backwater effect from the confluence of the tailrace canal and the Danube old riverbed (rkm 1811). The water level changes, especially in the lower part of this section, are influenced by the flow rates in the tailrace canal. The length of the upstream section influenced by the backwater effect depends on the actual flow rate distribution between the hydropower station and the Danube old riverbed. At regular operation it can be stated that the backwater effect reaches the Dunaremete profile (rkm1825.5) at flow rates over 2500 m3s-1 at Medveďov. The average daily water level at the Gabčíkovo gauging station (rkm 1819) fluctuated in the range from 111.70 to 114.35 m a. s. l. and the average annual water level was 112.30 m a. s. l (Fig. 1-9). The daily water level fluctuation at Gabčíkovo gauging station in the Danube old riverbed, as a consequence of operation of hydropower station, can reach app. 0.20 m. d) Sap – Vámosszabadi section. The flow rate in this section equals approximately to the flow rate at Bratislava and is additionally influenced by the operation of Gabčíkovo hydropower station. The daily water level fluctuation at this stretch (up to 0.30 m) depends on the hydropower station operation. Higher changes occur at low flow rates in the Danube due to the ratio of the total flow rate and the capacity of one turbine, which is put into operation or stopped. The average annual flow rate at the Vámosszabadi-Medveďov profile in 2004 was 1749 m3s-1. The average daily water level at Medveďov profile (rkm 1806.3) fluctuated in the range from 108.12 to 113.22 m a. s. l. and the average annual water level was 109.95 m a. s. l (Fig. 1-10).
|
||||||||||||||||||||||||||||||||||||||||||||||||||||||||||||||||||||||||||||||||||||||||||||||||||||||||||||||||||||||||||||||||||||||||||||||||||||||||||||||||||||||||||||||||||||||||||||||||||||||||||||||||||||||||||||||||||||||||||||||||||||||||||||||||||||||||||||||||||||||||||||||||||||||||||||||||||||||||||||||||||||||||||||||||||||||||||||||||||||||||||||||||||||||||||||||||||||||||||||||||||||||||||||||||||||||||||||||||||||||||||||||||||||||||||||||||||||||||||||||||||||||||||||||||||||||||||||||||||||||||||||||||||||||||||||||||||||||||||||||||||||||||||||||||||||||||||||||||||||||||||||||||||||||||||||||||||||||||||||||||||||||||||||||||||||||||||||||||||||||||||||||||||||||||||||||||||||||||||||||||||||||||||||||||||||||||||||||||||||||||||||||||||||||||||||||||||||||||||||||||||||||||||||||||||||||||||||||||||||||||||||||||||||||||||||||||||||||||||||||||||||||||||||||||||||||||||||||||