PART 2
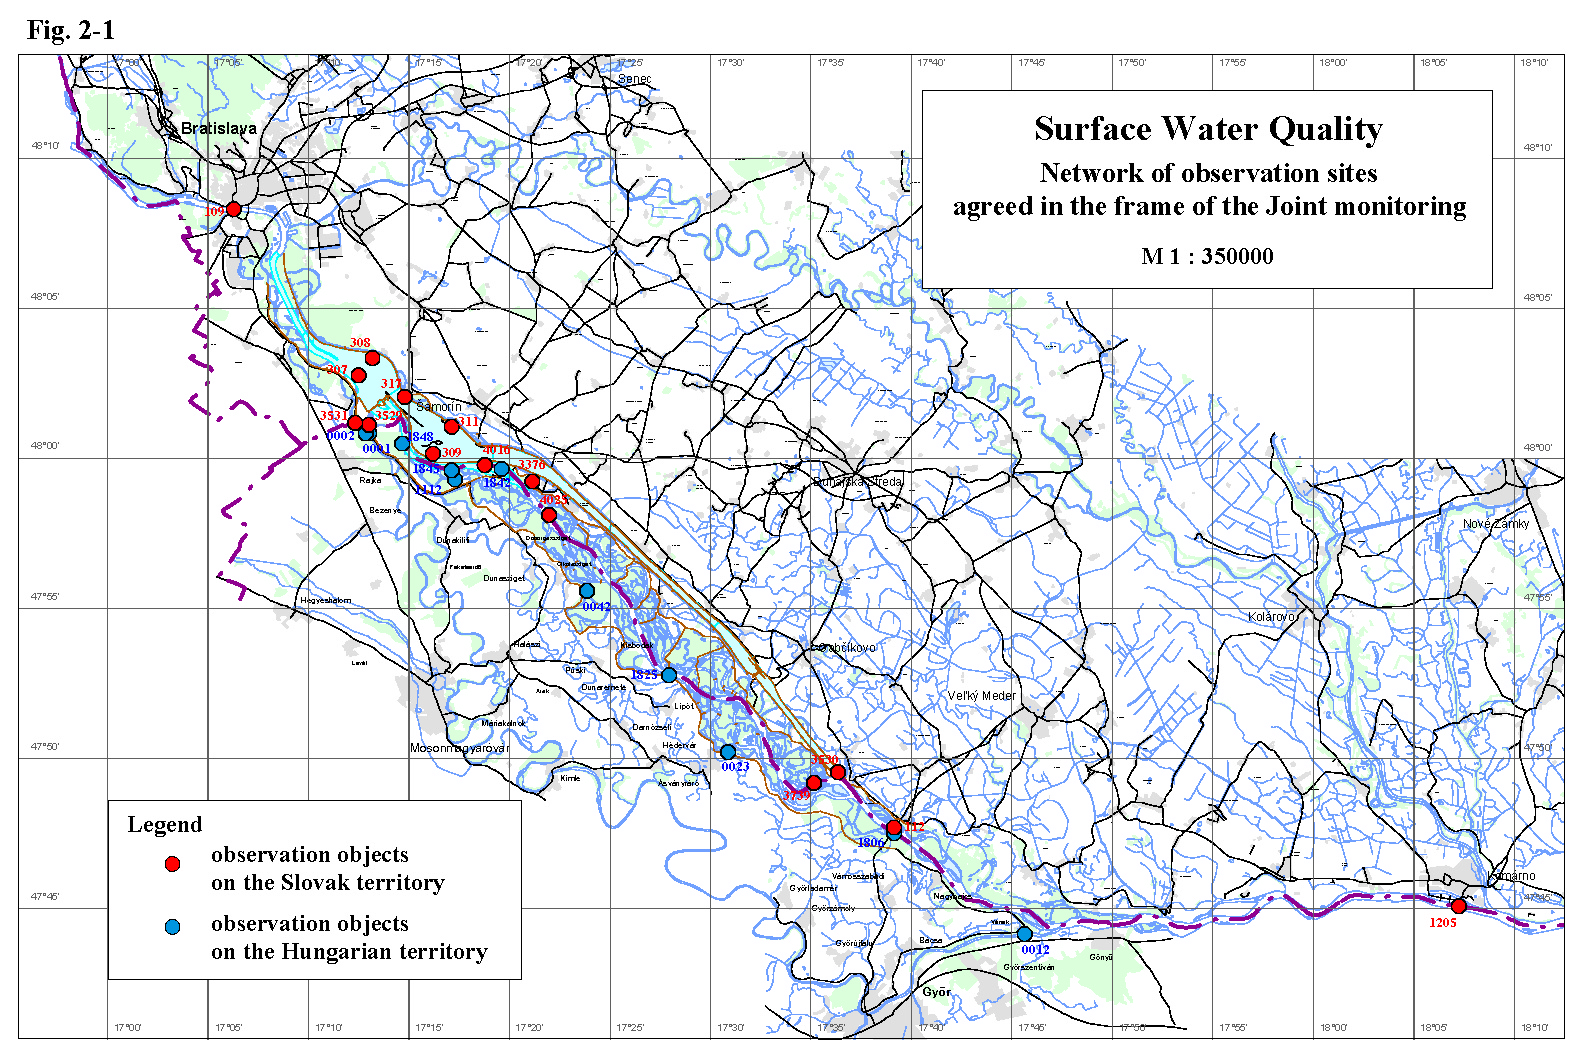
Surface Water QualitySurface water quality measurements in 2003, according to the Agreement, were carried out at 11 monitoring sites on the Hungarian territory and at 15 monitoring sites on the Slovak territory - Table 2-1, Fig. 2-1. At all of monitoring sites the influence of the measures, described in the Agreement, on the surface water quality was observed. Main factors, which could influence the water quality, are: the backwater effect upstream of the bottom weir, the increased discharges into the Danube downstream of the Čunovo dam and into the Mosoni branch of the Danube, the water supply into the right side river arm system, and morphological changes in the riverbed. Sampling and analysing were mainly performed according to methods agreed by the Sub-commission for Water Quality Protection of the Slovak-Hungarian Trans-boundary Water Commission. In the year 2003 on the Slovak side sampling organization was changed at sampling site No. 3530 (Water Research Institute was replaced by the Slovak Water Management Authority). Surface water quality and sediment quality data for agreed monitoring sites and time series diagrams for the respective parameters of the surface water quality are given in the Annexes to the Slovak and Hungarian National Reports on the Environment Monitoring in 2003. Figures in this report present the data of selected parameters. In the evaluation new limit values for surface water quality, agreed on 78th session of the Slovak-Hungarian Trans-boundary Water Commission, were used (Table. 2-2). Table 2-1: List of monitoring sites
Table 2-2: New agreed limits for surface water quality classification
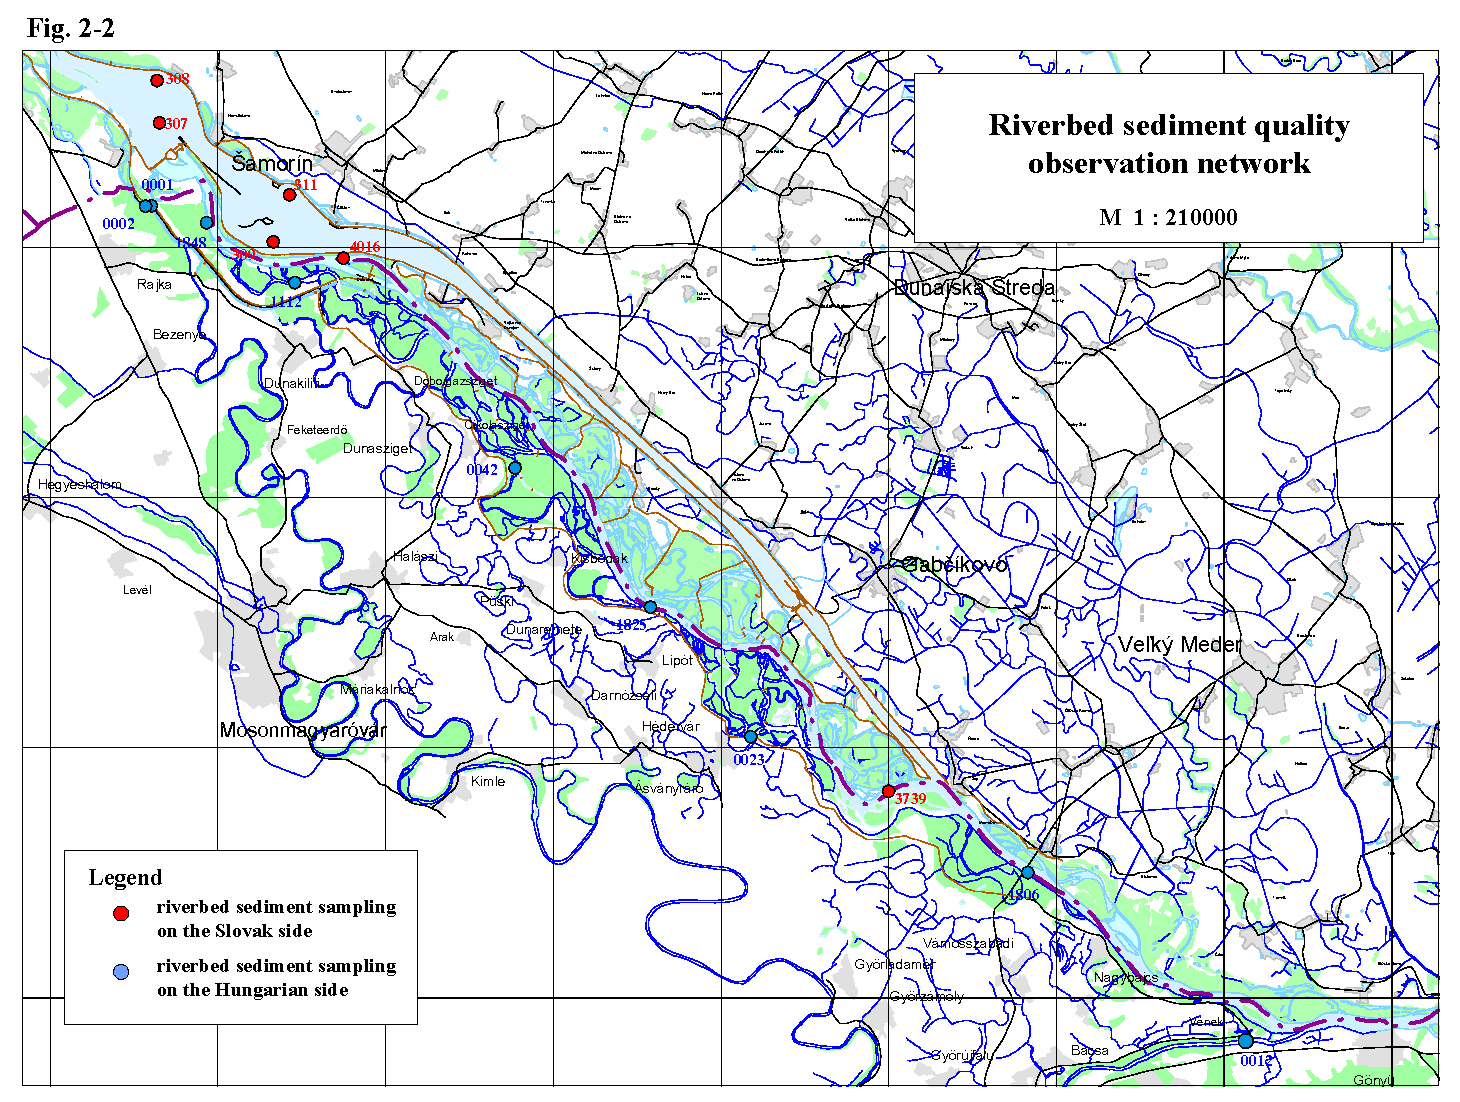
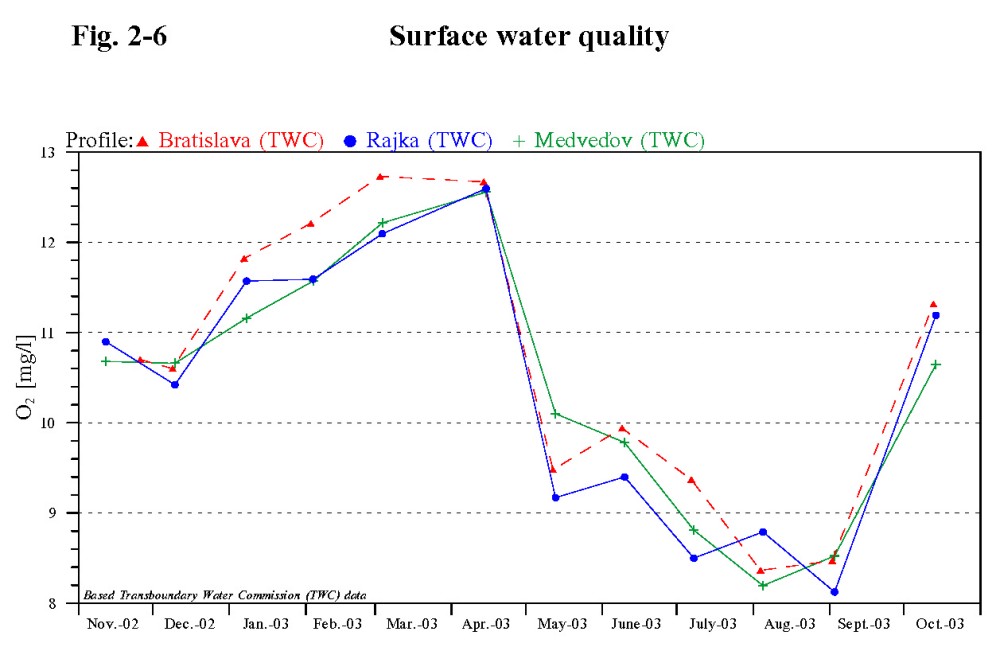
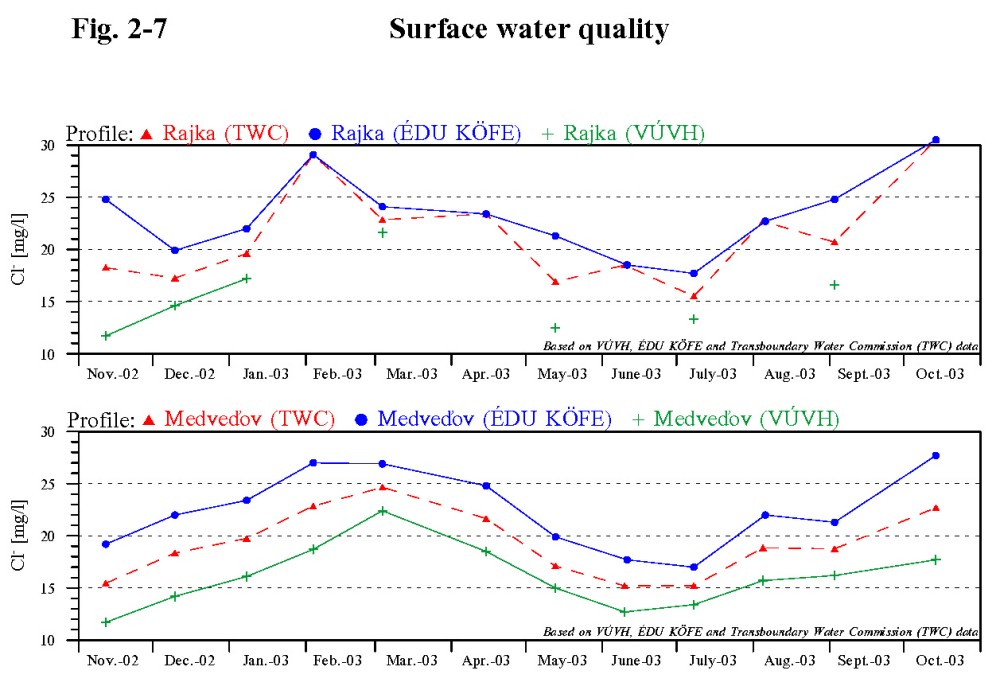
2.1. General evaluation of the actual hydrological yearThe year 2003 was extraordinary from the hydrometeorological point of view, because flow rates in the vegetation period, from April to October, were subnormal. Furthermore, considering the summer period the lowest flow rates in the last 100 years occurred on some days. Moreover, significant lack of precipitation occurred in the period from February to September. During the vegetation period extremely warm and long lasting time intervals occurred, similarly to the previous year. This resulted in rather high water temperatures in the Danube, which were related to the low flow rates as well in this period. Water temperature The water temperature fluctuation in the whole Danube stretch downstream of Čunovo follows the water temperature course observed in the Danube at Bratislava (sampling site No. 109). In the actual year it fluctuated in the range from 1 to 21 °C, in the reservoir up to 25 °C. Maximal values occurred in June and August and minimal values in January. The water temperature in the seepage canal was different, just as in the previous years. In the winter period it was warmer (by 2 °C) and in the summer period cooler (by 2-4 °C), because the seepage canal is supplied by the ground water. The water temperature in the Mosoni Danube at Čunovo sampling site was similar to the water temperature in the Danube and fluctuated from 2 to 22 °C, at the Vének sampling site fluctuated from 1 to 28 °C. The water temperature in the right side river branch system in the winter period was cooler comparing to the Danube water, the summer maximums reached values observed in the Danube water. The water temperature at selected sampling sites for hydrological year 2003 is documented in Fig. 2-3. pH Higher values of pH occur in seasons corresponding with periods of increased assimilation activity of phytoplankton. Resulting from the decreased assimilation activity in winter period the pH values were lower than in summer period. The Danube water pH values in the hydrological year 2003 fluctuated in the range from 7.6-8.6, while the higher values occurred during the algae growth (mainly in April-May, and during the second culmination of algae growth was in June). The pH values in the reservoir fluctuated between 7.2-8.4. The pH values in the river branch system and in the Mosoni Danube fluctuated between 7.5 and 8.5. The pH values in the seepage canal varied from 7.5 to 8.2. Specific electric conductivity The specific electric conductivity of the surface water refers to the dissolved salts content of mineral origin. The conductivity values in the Danube and in the right-side river branch system in 2003 in principle follow the conductivity values at the Bratislava profile (No. 109) and fluctuated between 32 and 53 mS.m-1. Higher salinity occurs in the period from November to February, during the year decreases and the minimal values reaches in June. Then it increases again. The dissolved salts content in the Mosoni Danube at Čunovo sampling site is similar to that in the Danube water. At the Vének profile is higher comparing to the other water bodies (it is affected by the impact of the affluents and also due to the loads coming from the wastewater). However, it did not reach the values from years before 2001 and fluctuated in the range from 35 to 65 mS.m-1. The electric conductivity values in the seepage canal, similarly to the previous years, fluctuated in the range from 33 to 47 mS.m-1, while during the period from April to October were higher in comparison to the Danube water (Bratislava sampling site). Suspended solids The suspended solids content is closely related to the flow rate (Fig. 2-4). The suspended solids content fluctuation during the hydrological year 2003 in the whole Danube stretch downstream of Čunovo follows the suspended solids content fluctuation in the Danube at Bratislava (No. 109). The suspended solids content mainly fluctuated in the range from 2 to 56 mg.l-1. One sample taken at Bratislava (No. 109) and Medveďov (No. 112) sampling sites exceeded the 56 mg.l-1. Higher values are related to periods with increased flow rates. When analysing the changes in the suspended solids content in the main riverbed it can be stated that the suspended solids content downstream of reservoir (Medveďov sampling site) is lower than in the Danube at Bratislava, which shows the settling effect of the reservoir. In the seepage canal the content of suspended solids fluctuated between 1-18 mg.l-1. The suspended solids content along the longitudinal profile of the right side river branch system, similarly to previous years, fluctuated between 5-45 mg.l-1. One high value (70 mg.l-1) occurred in December at Helena sampling site. In the Mosoni Danube at Čunovo the content of suspended solids fluctuated from 6 to 42 mg.l-1, one higher value occurred in January (app. 64 mg.l-1). At the Vének profile the suspended solids content fluctuated from 1 mg.l-1 to 22 mg.l-1, while one value in December reached 80 mg.l-1. Basic physical and chemical parameters - summary Basic physical and chemical parameters in the Danube and in the river branch system connected to the Danube main riverbed show seasonal variations and some of them predominantly depend on the flow rate. The suspended solids content fluctuations in the whole Danube stretch downstream of Čunovo follow the suspended solids content fluctuation in the Danube at Bratislava (No. 109), however the suspended solids content downstream of the reservoir shows the settling effect of the reservoir. The fluctuation of basic physical and chemical parameters in the Mosoni Danube and in the right side seepage canal reflects the different characteristics of these water bodies. The water quality in the Mosoni Danube is influenced by its affluents and wastewater from Győr; the water in the seepage canal is influenced mainly by the leaking ground water. No significant changes in the water quality were recorded in the hydrological year 2003 in comparison to the previous year. 2.3. Cations and AnionsThe quantitative ratio of the ionic composition of the Danube water during the hydrological year 2003 showed high stability, just as in previous years. The seasonal fluctuation of the quantitative ratio of the ionic content followed the changes in salinity (first of all changes of magnesium, calcium, sodium, chloride and hydro-carbonate ions content) related to the flow rate fluctuations in the Danube. Comparing to the long-term measurements the values of basic cations and anions have not changed. The most stable ionic content was characteristic for the seepage water. Higher dissolved solids content in the Mosoni Danube downstream of Győr occurred in relation with higher sodium, potassium, chloride and sulphate concentrations. 2.4. NutrientsNitrates Nitrates concentrations in 2003 at all monitoring sites in the Danube as well as in the right-side river branch system show seasonal fluctuation. Values mainly fluctuated in the range from 1 to 15 mg.l-1 (Fig. 2-5). Nitrates concentrations in the Mosoni Danube at Vének sampling site were mostly lower in comparison to the Danube water and fluctuated in the range from 4 to 21 mg.l-1, however one value in October reached 35.3 mg.l-1. Nitrates in the seepage canal in 2003 equally fluctuated in the range from 1 to 9 mg.l-1. Ammonium ion In the hydrological year 2003 the ammonium ion concentrations at all measured sites in the Danube and in the river branch system as well reached the maximum values at the end of January (concentrations fluctuated up to 0.23 mg.l-1). In the following period concentration fluctuated from 0.01 to 0.15 mg.l-1. However, one value in October at Bratislava reached 0.837 mg.l-1. In general higher concentrations occur during the periods with lower water temperature due to the slower nitrification processes. In comparison to the previous year there is a slight decrease of ammonium content observed in the Danube. The lowest ammonium ion concentration is in the seepage canal, where it varied from 0.01 to 0.15 mg.l-1. The ammonium ion concentration in the Mosoni Danube at Čunovo sampling site varied from 0.04 to 0.16 mg.l-1, however one value in July reached 0.3 mg.l-1. At Vének profile the concentration of ammonium ion was in several occasions two times higher than the concentrations observed on the other profiles. However, the maximal values were lower in comparison to the previous year (0.6 mg.l-1 in February, 0.52 mg.l-1 in September). Nitrites The nitrite ions concentrations, considered as a temporary product of nitrification and denitrification processes, showed a seasonal variation in the Danube water and fluctuated in the range from 0.01 to 0.19 mg.l-1. The nitrites concentrations in the seepage canal were lower in comparison to the Danube water and mainly varied between 0.02 and 0.08 mg.l-1. The nitrite content at Čunovo sampling point on the Mosoni Danube was higher to that in the Danube water at Bratislava. At the Vének profile and in the right side river branch system were the nitrite concentrations higher in comparison to the Danube water and varied from 0.02 to 0.15 mg.l-1. Total nitrogen The total nitrogen content (Fig. 2-5) is predominantly affected by the fluctuation of the nitrate-nitrogen and organic-nitrogen concentrations, which results from the quantitative ratio of nitrogen forms. The tendency of fluctuations of the total nitrogen in the Danube, Mosoni Danube and in the right side river branch system was similar to each other. In comparison to the Danube water the total nitrogen content at Vének profile was slightly higher. Comparing to the previous year a slight decrease of the total nitrogen values can be observed in the right side river branch system. Slight decrease of the total nitrogen content, in comparison to the previous year, can be observed in the Danube water as well. The total nitrogen concentrations in the Danube fluctuated from 1.6 to 4.0 mg.l-1, in the reservoir from 0.7 to 4,1 mg.l-1. In the right side river branch system and at Čunovo sampling point on the Mosoni Danube the concentrations varied from 1.7 to 5.3 mg.l-1 and at the Vének profile from 1.5 to 6.5 mg.l-1, one value in October reached 9 mg.l-1. The lowest amount of total nitrogen was found in the seepage canal. It varied from 0.7 to 4.5 mg.l-1, however one value in March reached 4.3 mg.l-1. Phosphates In the hydrological year 2003 the phosphate concentrations, in comparison with the previous year again slightly decreased. In the Danube water they varied from 0.02 to 0.22 mg.l-1, in the reservoir from 0.03 to 0.28 mg.l-1. The phosphate concentrations in the right side river branch system fluctuated from 0.02 to 0.24 mg.l-1, however one value in September at Szigeti river arm sampling site reached 0.38 mg.l-1. The phosphates content in the Mosoni Danube at Čunovo sampling site fluctuated in the range from 0.02 to 0.22 mg.l-1; at the Vének profile the phosphates content was higher in comparison to the Danube water and varied from 0.1 to 0.86 mg.l-1. The lowest phosphate concentrations occurred in the seepage water (from 0.01 to 0.21 mg.l-1). In general higher values of orthophosphates concentrations occur in the winter period, lower values are characteristic for the vegetation period. Total phosphorus Concentration changes of the total phosphorus followed the concentration changes of phosphates. The total phosphorus concentration on all profiles, except the profile at Vének, situated on Mosoni Danube, fluctuated in the range from 0.02 to 0.27 mg.l-1. Total phosphorus concentrations at Vének fluctuated in the range 0.1-0.46 mg.l-1. The total phosphorus content in the seepage canal fluctuated in a narrow range from 0.02 to 0.13 mg.l-1. Nutrients - summary Nutrients content fluctuation in the Danube water (Bratislava and Medveďov sampling sites), during eleven year observation can be divided into three stages: the period 1992-1996 is characteristic by gradual increase of concentrations; the period 1997-2001 is characteristic by gradual decrease of concentrations; and the period 2002-2003, which can be characterised by stabilization of the nutrients content and in comparison to the year 2001 there were no significant changes. However, within the individual periods there are fluctuations in concentrations of single parameters of the nutrients group. Decrease of nutrients content in the Bratislava section of the Danube is probably connected with decrease of pollution coming from the upper watershed of the Danube to this area. Since introducing the water supply the content of nutrients in the right-side river branch system mostly follows the fluctuation in the Danube. The tessellation character of water bodies along the path of the water supply decreased, as a consequence of changed water regime dynamics. The nutrients content in the Danube water is potentially sufficient for development of eutrophic processes under other suitable conditions. 2.5. Oxygen and organic carbon regime parametersDissolved oxygen In the hydrological year 2003 the dissolved oxygen concentration in the Danube water varied from 7.5 to 13.5 mg.l-1, in the reservoir it varied from 5 to 17 mg.l-1. Maximum and minimum values occurred at site No. 308. Fluctuation of the dissolved oxygen content at selected profiles is documented on Fig. 2-6. The dissolved oxygen content proportionally decreased with increasing water temperature in the Danube. Besides this the dissolved oxygen content depends on the assimilation activity of phytoplankton. In the right-side river branch system due to the continuous water supply the dissolved oxygen content follow the course of dissolved oxygen values in the Danube river. The concentrations fluctuated in the range from 6 to 14 mg.l-1. The oxygen concentrations in the Mosoni Danube at Čunovo sampling point varied from 8 to 14 mg.l-1; at the Vének profile, similarly to the previous year, the oxygen content was slightly higher in comparison to the long-term values and fluctuated from 5.11 to 14.25 mg.l-1. The oxygen content in the seepage canal fluctuated from 6 to 12 mg.l-1. CODMn and BOD5 COD and BOD parameters are used for expressing the organic contamination of the water, they indicate the chemically and biologically degradable organic matter content. In the hydrological year 2003 the COD values at all measured profiles fluctuated from 0.5 to 6 mg.l-1. The COD values in the right side river branch system fluctuated from 2 to 9.6 mg.l-1, however one value in November 2002 at Helena profile reached 13 mg.l-1. The organic matter content in the seepage canal is low in long term and in 2003 fluctuated from 0.5 to 3 mg.l-1, however one value in December 2002 reached 4.8 mg.l-1. The BOD values of the Danube water fluctuated in the range from 1 to 5 mg.l-1, however one higher value occurred during higher flow rate in November 2002 at Rajka and Medveďov sampling sites (7.2 and 7.6 mg.l-1 respectively). The BOD values in the right side river branch system were mostly higher in comparison to the Danube water and varied in the range from 0.5 to 7 mg.l-1. The BOD in the seepage canal varied from 0.4 to 2.6 mg.l-1, however at sampling site on Hungarian side (No. 0002) there were recorded values up to 4.6 mg.l-1. In the Mosoni Danube at Čunovo sampling point the COD values varied in the range from 1.4 to 7 mg.l-1 and the BOD values varied from 1.37 to 3.6 mg.l-1, while during higher discharges in the Danube in November 2002 one value reached 6.6 mg.l-1. At the Vének profile the COD and BOD values were, similarly to the values in previous years, higher because of the partially treated wastewater from the Győr (COD 3-7 mg.l-1, with one extreme value in December 2002 – 19.6 mg.l-1, BOD 1-6 mg.l-1, with one extreme value in May 2003 – 11 mg.l-1). Higher COD and BOD values usually occur in periods with increased flow rates in the Danube, when the water contain higher amount of natural organic matter. Oxygen and organic carbon regime parameters - summary Based on the comparison of the oxygen and organic carbon regime parameters in 2003 with the long-term data at Bratislava and Medveďov sampling sites it can be stated that maximal values of dissolved oxygen content were higher in comparison to years 2001-2002. BOD values in 2003 increased in comparison to the years 1999-2002 and reaches values of the period 1996-1998. The COD values after a slight increase in 2001-2002 decreased below the long-term average values. TOC values after increase in period 1993-1997 started to decrease in 1998 and in the period 2000-2003 fluctuate in a stabile range. The oxygen and organic carbon related parameters in the Danube reflect the seasonal assimilation activity of the phytoplankton and organic carbon oxidation processes. The measured data (1992-2003) indicate decreasing tendency of organic load at the Bratislava section of the Danube, which is related to the substantial wastewater treatment improvement in the upstream Danubian countries. Higher values of oxygen regime parameters (CODMn, BOD5) occur in period of higher flow rates in the Danube. The oxygen regime parameters at Vének are influenced by local pollution (pollution originating from city Győr) together with hydrological conditions at confluence with the Danube. 2.6. MetalsIron The amount of suspended solids influences the total iron content in the surface water. The mutual coherence of iron concentrations and suspended solids content in surface water is documented by the highest concentrations of iron measured at the time of highest suspended solids content. In hydrological year 2003 the iron concentrations on all measured sites on the Danube fluctuated mainly up to 1 mg.l-1. However, in two occasions in January and October reached values up to 1.2 and 1.5 mg.l-1 respectively. The iron concentrations in the right side river branch system mostly fluctuated up to 0.5 mg.l-1. The iron concentration in the seepage water fluctuated in narrower range up to 0.4 mg.l-1, however one extreme value occurred in January at the Čunovo profile (0.8 mg.l-1). In the Mosoni Danube at Čunovo sampling site the iron content varied in the range from 0.1 to 0.5 mg.l-1. However in November 2002, August and October 2003 three values up to 2.3 mg.l-1 occurred. At Vének profile is the iron content usually higher due to the character of catchment area (the water in the Rába river is rich in iron). However, in the hydrological year 2003 the iron concentrations were similar as in the Danube water; they varied from 0.1 to 0.85 mg.l-1. Manganese Manganese, similarly to iron, occurs in surface water mainly in solid phase. The manganese concentrations in the Danube water mostly fluctuated in the range up to 0.08 mg.l-1, at Bratislava sampling site one value of 0.1 mg.l-1 occurred in October 2003. The manganese concentrations in the Mosoni Danube at Čunovo sampling point fluctuated in a narrow range up to 0.05 mg.l-1. At the Vének profile, in comparison to the previous year three extreme values occurred (max. 0.5 mg.l-1), while the remaining values ranged up to 0.24 mg.l-1. In the right side river branch system, except the Helena sampling site, and in the seepage canal at Čunovo low concentrations were measured up to 0.1 mg.l-1. At the Helena sampling site the manganese content fluctuated from 0.02 to 0.97 mg.l-1. Heavy metals The heavy metals concentrations in hydrological year 2003 fluctuated in the range of limits corresponding to the I. class of surface water quality. The mercury content varied below the detection limit value (0.1 mg.l-1). 2.7. Biological and microbiological parametersColiform bacteria The surface water bacteriological pollution can be determined by the number of Coliform bacteria. In the year 2003 the number of Coliform bacteria at Bratislava profile (No. 109) varied up to 200 NrC.ml-1, which represents some increase in comparison to the previous year. The Coliform bacteria values at Rajka and Medveďov profile follow the fluctuation of values at Bratislava profile, while the number of Coliform bacteria were in long run lower comparing to the Bratislava sampling site. The bacteriological pollution, documented by the number of Coliform bacteria, at Medveďov profile in the main riverbed is lower comparing to the Rajka profile. The bacteriological pollution in the river arm system is lower in comparison to the Danube water and fluctuated in the range from 1 to 50 NrC.ml-1. Similarly to the previous year some improvement was observed in microbiological parameters along the flow path in the right side river branch system downstream of influent section. The bacteriological pollution at the Čunovo sampling site on the Mosoni Danube varied in the range from 1 to 200 NrC.ml-1. At the Vének profile the bacteriological pollution fluctuated in the range from 20 to 2000 NrC.ml-1, which can be regarded as an improvement at this sampling site. The seepage canal can be considered as the cleanest from the bacteriological point of view, the number of bacteria range up to 20 NrC.ml-1, however one extreme value (590 NrC.ml-1) occurred in June at profile No. 0002. Chlorophyll-a The chlorophyll-a concentrations refer to the quantity of phytoplankton and provide information about the eutrophic state of water. The growth of algae on the respective section of the river is represented by the relative increase of chlorophyll-a concentration between two compared profiles. According to the observations in the Danube in 2003 the spring algae growth maximum, similarly to the previous year, occurred from April to June, when values fluctuated around 75 mg.m-3. In the following period the chlorophyll-a concentration decreased. The situation in the right side river branch system and in the Mosoni Danube at Čunovo was similar to the situation in the Danube. However, the spring algae growth culminated earlier (March-April) in comparison to the Danube water. The chlorophyll-a concentrations during the spring period were little bit higher in comparison to the Danube water. The situation at the Vének profile was similar to the situation in the Danube as well. However, the spring culmination occurred in May (181 mg.m-3), which was caused by a huge amount of algae transported by the Rába river besides critically low flow rate. The chlorophyll-a concentration in the seepage water remained low and fluctuated mainly from 1 to 11.8 mg.m-3. The highest values were measured during the spring algae growth in May. Saprobic index The saprobic index represents the self-purification ability of water, the ability to degrade organic pollution. The saprobic index in relation to the respective stretch of river represents also the water quality in the river. Based on measured data on the Slovak side the saprobic index values in the inspected water bodies (Danube river, reservoir and seepage canals) in 2003 fluctuated in the range from 1.7 to 2.4, which correspond to beta-mezosaprobic state. According to the data on Hungarian side the saprobic index values in the inspected water bodies (Danube, right side river arm system, Mosoni Danube) ranged from 2.3 to 2.7, which correspond to alpha-beta mezosaprobic state. These values of saprobic index are typical for this stretch of the river. The self-purification processes, at this level of the saprobic index, run mainly as oxidising processes. Time series data of saprobic index indicate the slightly decreasing tendency during the last ten years. The saprobic index in the right side river branch system varied from 2.2 to 2.6, which correspond to alpha-beta mezosaprobic state. The saprobic index in the Mosoni Danube at Vének profile fluctuated from 2.35 to 2.75, which correspond to alpha-mezosaprobity. Other biological parameters The observations of abundance and species of phytoplankton and zooplankton, and the determination of the saprobic index and taxons of macrozoobenthos were performed according to the Agreement three times in a year. Phytoplankton Minimal values of the phytoplankton abundance were recorded during the autumn and winter period, while the maximal values occurred in the spring. According to the recorded data along the longitudinal profile from Bratislava to Komárno continuous increase of the trophic status in the Danube water is evident, similarly to the previous years. The species diversity in 2003 was rich. The population densities were high likewise in the previous year, especially due to the climatic conditions –high temperatures and low flow rates were characteristic in the vegetation period. Maximal values in the Danube water mostly occurred in May and the abundance of phytoplankton varied from 14150 NrC.ml-1 (Bratislava sampling site) to 15556 NrC.ml-1 (Medveďov). Maximal values in the reservoir mostly occurred in March and the abundance of phytoplankton ranged up to 40360 NrC.ml-1 (sampling site No. 308). The Diatoms (Bacillariophycea-Centrales) were dominant; they created 78-90% of the phytoplankton in the Danube water. The most frequent were families Cyclotella g. sp., Stephanodiscus g. sp. div., Skeletonema potamos, Aulacoseira ambigua, Aulacoseira granulata, Melosira varians, Asterionella formosa, Synedra acus, Diatoma vulgaris, Fragillaria crotonensis, Nitzschia fruticosa, Navicula avenacea. In the summer period the number of green algae taxons increased (Scenedesmus acuminatus, Scenedesmus quadricauda, Scenedesmus obliquus, Ankistrodesmus fusiformis, Monoraphidium contortum). During the spring and summer period other algae groups occurred as well (Cryptophyceae, Chrysophyceae, Volvocales, Chlorococalles). The composition of phytoplankton in the seepage canal differs from the composition in the Danube water. The percentage of different groups was the following: Bacillariophycea-Centrales – 12-32 %, Bacillariophycea-Pennales – 16-24 %, Cyanophyceae – up to 24 %, Chrysophyceae – up to 19 %, Volvocales – up to 16 % and Chlorococalles – up to 14 %. The water in the seepage canal was relatively poor in algae; the abundance of phytoplankton varied from 14 NrC.ml-1 (sampling site No. 317) to 1096 NrC.ml-1 (sampling site No. 3531). More intensive algae growth in the right side river branch system was observed from March to June along the main river branch between the Szigeti (18658 NrC.ml-1) and the Ásványi arm (41433 NrC.ml-1); the most intensive algae growth occurred in March. The amount of phytoplankton in Mosoni Danube followed the changes in the Danube water. In the Vének profile downstream of Győr the rate of algae accumulation was partly influenced by the hydro-morphological characteristic, which differ from those of the upper section, and partly by nutrients delivered by the partially treated wastewater and by watercourses joining the Mosoni Danube at Győr. Zooplankton In the year 2003 similar composition of Rotatoria and Crustacea groups occurred in the Danube as in the previous year. Unlike the analysis results of previous years increase in the number of individuals of species downstream of Danube was not recorded this year. The zooplankton consists of Rotatoria – 70-96 %, Copepoda – 3-29 % and Cladocera – 1-3 %. According to the species composition the most abundant were families Keratella, Brachiomus and Polyarthra in Rotatoria group, Daphnia and Bosmina families in Copepoda group, and Cyclopidae family in Cladocera group similarly to the previous year. The number of species and abundance of individuals in comparison with the previous year did not changed in the Danube. However, some rare species occurred in samples as well (e.g. Cypelogapis vorax, Kellikottia longispina, Lecane quadriedentata, Acroperus harpae, Chydorus ovalis, Eurytemora velox). The number of individuals in the seepage water shows continuous slight decrease in the last 3-4 years. In the Mosoni Danube at the Vének profile the abundance values peaked from May to July, however the abundance throughout the year was balanced again. This could be explained by the even flow rate in the Mosoni Danube. Macrozoobenthon The faunistic result of aquatic macroinvertebrate communities of the Danube river remained very similar to those of previous years. At the Bratislava sampling site decrease of diversity was detected (12 taxons). Prevailingly common Danube species of Malacostrata group were observed (Dikerogammarus family of Crustacea, Jaera istrii, etc.). At Rajka sampling site rich in species community was found (30 taxons). To the dominant species belonged Hypania invalida of Polychaeta, Radix ovata and Bithynia tentaculata of Gastropoda, Dreissena polymorpha of Bivalvia and Stilodrilus heringianus of Oligochaeta. At Medveďov sampling site decrease of species diversity was detected (9 taxons), from which Malacostrata (Dikerogammarus family, Corophium curvispinum), Gastropoda (Valvata naticina) and Oligochaeta (Tubifex sp.) were the most multifarious. The results of saprobic index of the Danube water in the longitudinal profile from Bratislava to Komárno correspond to the beta mezosaprobic state, which is typical for this stretch of the river. Average values of saprobic index in 2003 varied from 1.88 (at Dobrohošť) to 2.31 (at Bratislava). The improvement of the water quality in the Danube is proved also by occurrence of species demanding clean water: Ancylus fluviatilis, Theodoxus fluviatilis, Heptagenia sp. div., Brachycentrus montanus. The saprobic index at sampling sites in the reservoir varied from 2.04 (at Kalinkovo-navigation line) to 2.69 (at Šamorín No. 311), which correspond to beta-alpha mezosaprobic state. Altogether 79 invertebrate taxa were found in the year 2003 in the four investigated profiles of the Danube, as well as in the two profiles at Locks I. and II. The majority of animals belonged to Molluscs (Ancylus fluviatilis, Lymnaea peregra var. ovata, Potamopyrgus antipodarum) and Bivalvia (Dreissena polymorpha, Sphaerium corneum). However, the most characteristic animals in the Danube belonged to Malacostrata (Dikerogammarus villosus, Obesogammarus obesus). In the right side river branch system in the inundation area various rheophile communities of molluscs (Bithynia tentaculata, Lithoglyphus naticoides, Lymnea pergar var. ovata, Valvata piscinalis, Anodonta anatine, Pisidium henslowanum, Sphaerium corneum), crustaceans (Corophium curvispinum, Dikerogammarus villosus, Jaera istrii, Lymnomysis benedeni, Obesogammarus obesus) and insects (Brachycentrus subnubilus, Hydropsyche sp.) were observed. Common presence of rheophile species and species of stagnant water shows that the water supplied to the flood plain become gradually richer and diverse habitat. The lowest number of invertebrate taxons characterized the Vének sampling site on Mosoni Danube. Species preferring sediments rich in organic material were dominant (Criodrilus lacuum). Periphyton Based on the obtained results it can be stated that the saprobic indexes of periphyton on every sampling site in the Danube in 2003 varied in the range of better beta-mezosaprobic state. The saprobic index of periphyton ranged from 1.61 (at Rajka) to 2.1 (at Dobrohošť). The range of values was wider than in previous year. According to the species diversity of the periphyton the Diatoms (Aulacoseira, Cyclotella, Cyclostephanos, Stephanodiscus, Thalassiosira etc.) were dominant. Families of Fragilariaceae group (Diatoma, Fragilaria) as well as the families of Achnanthaceae group (Achanathes, Cocconeis) were frequent, but the most frequent were the families of the Naviculaceae group (Amphora, Cymbella, Cymatopleura, Surirella, Gomphonema, Naviculla, Rhoicosphaenia) and Bacillariaceae group (Nitzschia). The Cyanophyta were sparse, from among the Lyngbyia martesiana, Leptolyngbyia boryana and Phormidium retzii species and species of the Rhizoclonium family were detected. At the beginning of the left side river arm system (sampling site No. 3376) the species Chroococcus minutus a Phormidium autumnale of Cyanophyta, Melosira varians, Diatoma vulgaris, Navicula avenacea and Cymbella prostrata of Diatoms, Cladophora glomerata and Zygnema globosum of Chlorophyta were dominant. 2.8. Quality of sedimentsSampling of riverbed sediments in the frame of joint Slovak-Hungarian monitoring had been performed in September 2003 by both the Hungarian and Slovak Party (Fig. 2-2). Inorganic and organic micro components were analysed and the content of total phosphorus and nitrogen was also determined. In 2003 the Hungarian and Slovak Party in their National Annual Reports from environmental monitoring used different standards for sediment quality evaluation. Slovak Party used the “Canadian Sediment Quality Guideline for Protection of Aquatic Life” published in 2002. The Hungarian Party is using for sediment quality evaluation the “Provincial Sediment Quality Guidelines”, so called the “Canadian list”. Detailed evaluations are parts of the respective National Annual Reports. According to the “Canadian Sediment Quality Guideline for Protection of Aquatic Life”, used by the Slovak Party, contents of heavy metals and organic pollution in sediments at designated sampling sites did not reached limits of Probable Effect Level (PEL) in any case. According to the “Provincial Sediment Quality Guidelines”, used by the Hungarian Party, contents of heavy metals and organic pollution (PAH) at designated sampling sites did not reached limits of the “Severe Effect Level” (SEL) in any case. However, there were sampling sites where the concentrations of heavy metals, except cadmium, exceeded the bottom limits of the “Lowest Effect Level” (LEL). According to obtained results it can be stated that the highest accumulation of heavy metals was recorded at the Vének profile on the Mosoni Danube and the lowest concentrations were observed in the seepage canal. The PAH contamination did not exceed the respective limits for the “Lowest Effect Level” at any of the examined sampling points (2000 mg.kg-1). The total phosphorus content in sediments slightly exceeded the limit value of “Lowest Effect Level” (600 mg.kg-1) at all sampling sites, except the sampling sites at Rajka and Dunaremete on the Danube and in the seepage canal. The total nitrogen content in sediments exceeded the limit value of “Lowest Effect Level” (600 mg.kg-1) on all sampling points. However, the total nitrogen contents did not exceeded the “Severe Effect Level” (4800 mg.kg-1) at any of sampling sites. 2.9. Differences in the data measured by the Slovak and Hungarian Parties This chapter is intended to show, what results were reached in elimination of the differences in data measured by the Hungarian and Slovak Party. According to results obtained in the hydrological year 2003 it can be stated that at sampling sites, which were sampled at the same time and at the same place, good concordance was reached in major part of examined parameters. However, there exist parameters where values of individual parameters measured by one of the Parties are higher or lower than values determined by the other Party (e.g. Ntotal, suspended solids, Coliform bacteria, NH4+ and dissolved oxygen). In the hydrological year 2003 we can find differences in the data measured by the Slovak and Hungarian Parties in case of pH value, sulphates, chlorides, Fe, Mn, heavy metals, BOD and saprobic index (Fig. 2-7, Fig. 2-8). In the frame of Transboundary Water Commission new methodology and mode of evaluation was accepted, which was applied since January 2004, so further improvement in data concordance is expected. 2.10. ConclusionsIncreased or decreased values of some parameters in the Danube, seen from the long-term evaluation, were already observed at Bratislava profile (109) where the water quality of the Danube generally improved. This influences the surface water quality in the territory influenced by temporary measures, realised according to the Agreement. The hydrological year 2003 differed from the previous hydrological year by long lasting high air temperatures, extremely low flow rate during the vegetation period and shortage of precipitation amount. Fluctuation of individual parameters characterising the surface water quality in the right-side river branch system, due to the continuous water supply since 1995, was in most cases artificially modified, and follows their fluctuation in the Danube water. The tessellation character of water bodies along the path of the water supply decreased, as a consequence of changed water regime dynamics. The tributaries and local pollution of settlements, besides the water supply influence, form the water quality in Mosoni Danube. Before the confluence with the Danube the water quality state is labile (variable in time), which is proved by unfavourable values of some parameters (Coliform bacteria, BOD, nitrates, total phosphorus sulphates and saprobic index), while in parameters characterising the oxygen regime, dissolved solids, iron concentration and COD improvement can be observed. In the following table Tab. 2-3, orientational classification of the individual sampling sites into the quality groups was done according to the trans-boundary water quality criteria. It has to be mentioned that the classification criteria significantly changed in 2003. In the frame of Transboundary Water Commission the classification of six quality groups changed to five quality groups. Besides this significant changes in limit value for several parameters were introduced as well (e.g. nitrates, total nitrogen, etc.). In case of manganese, Cd, As, Hg and saprobic index the classification to quality groups was done according to the agreed limit values. However, there are differences in the measured data between the Hungarian and Slovak sides, so that they could be classified into different quality groups. Differences in other parameters (heavy metals, Fe, etc.) are not reflected by classification into different quality groups. Table 2-3: Orienational classification of parameters or group of parameters according to the agreed limits for surface water quality classification
The quality classes are determined according to the 90% durability of measured values (C90). This classification does not distinguish in what conditions were the respective values recorded (e.g. hydrological conditions – floods, high or extremely low flow rates, oscillation of parameters). The given orientational classification gives only comparison of the water quality inflowing to the influenced area (sampling site at Bratislava) and the water quality leaving the system (sampling site at Medveďov). The classification of the sampling sites in the Danube old riverbed and sampling sites on the Mosoni Danube, right side river branch system and in the seepage canal were done in similar way. From the above given table is clear, that the quality of water entering the hydropower system and the quality of water leaving the system is very similar.
|
|||||||||||||||||||||||||||||||||||||||||||||||||||||||||||||||||||||||||||||||||||||||||||||||||||||||||||||||||||||||||||||||||||||||||||||||||||||||||||||||||||||||||||||||||||||||||||||||||||||||||||||||||||||||||||||||||||||||||||||||||||||||||||||||||||||||||||||||||||||||||||||||||||||||||||||||||||||||||||||||||||||||||||||||||||||||||||||||||||||||||||||||||||||||||||||||||||||||||||||||||||||||||||||||||||||||||||||||||||||||||||||||||||||||||||||||||||||||||||||||||||||||||||||||||||||||||||||||||||||||||||||||||||||||||||||||||||||||||||||||||||||||||||||||||||||||||