PART 5
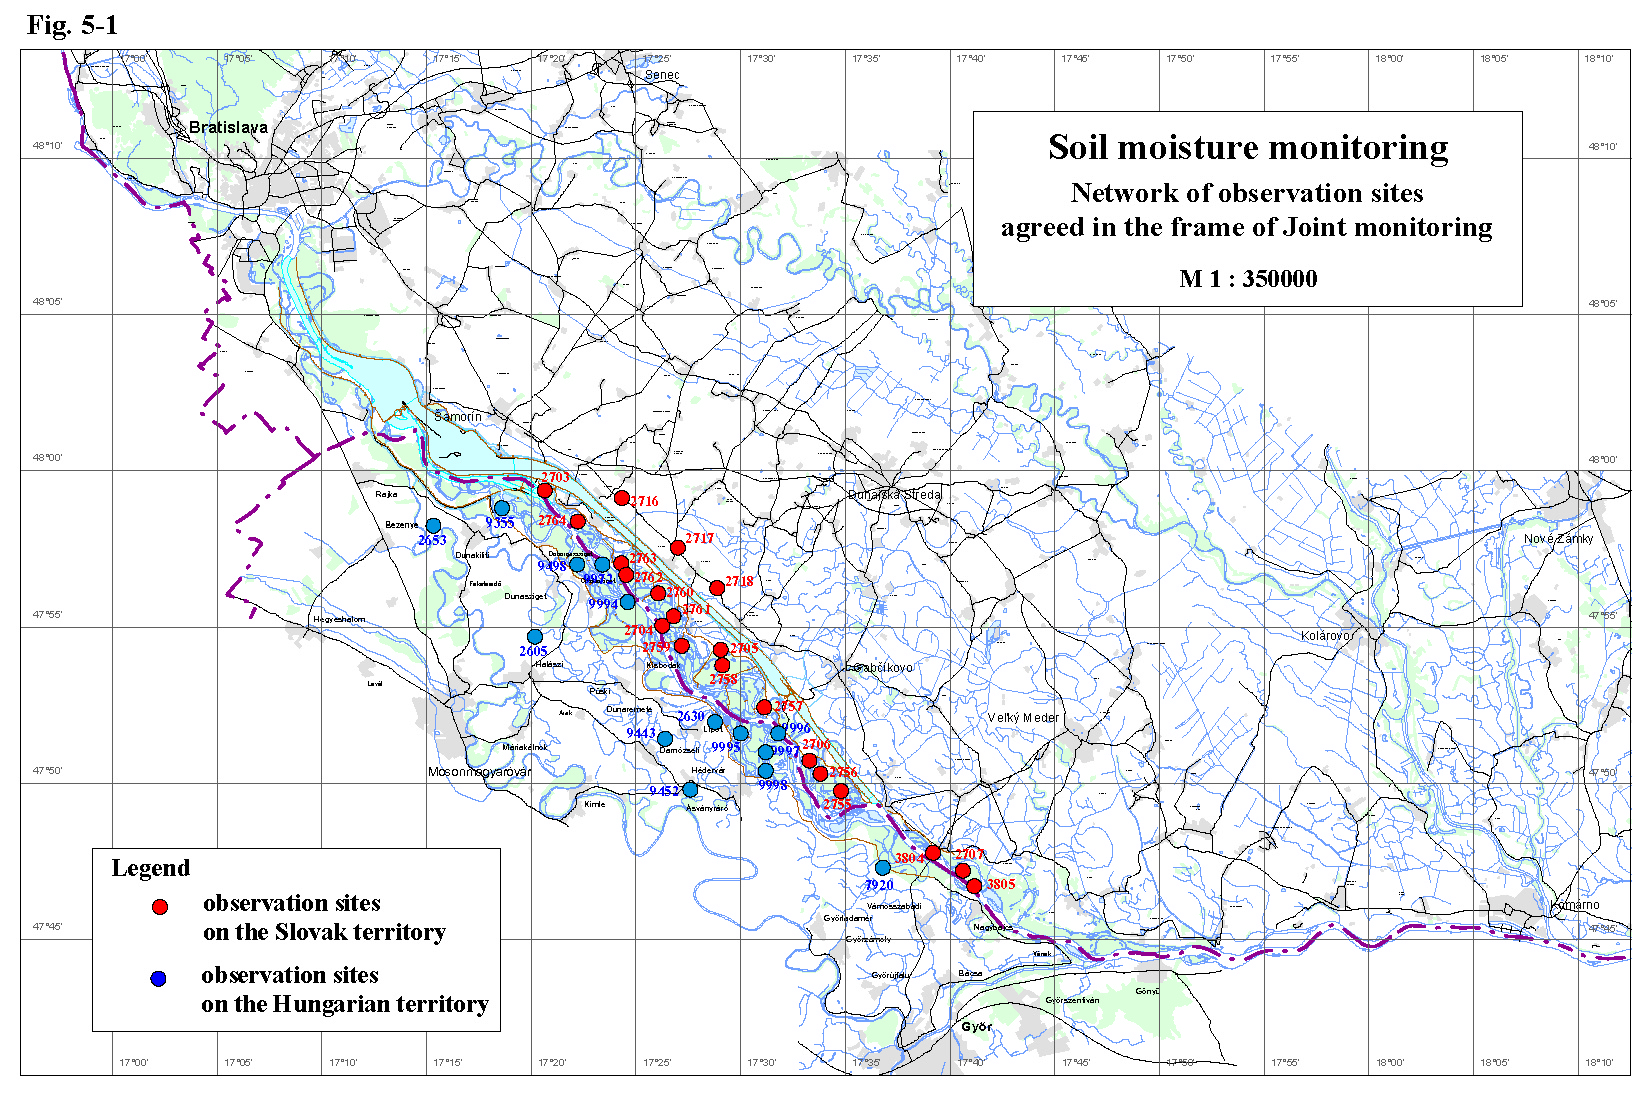
Soil Moisture Monitoring5.1. Data collection methodsThe soil moisture monitoring in the hydrological year 2002 does not changed. Both sides carried out the measurements in the same way as in the previous years. The Slovak side measures the soil moisture by a neutron probe. The measurements are performed down to a prescribed depth or to the depth of the ground water level. The Hungarian side carried out the measurements with a capacity probe to the prescribed depth. The soil moisture on both sides is expressed by the total soil moisture content in volume percentage recorded in 10 cm depth interval for each measurement during the year. Measurements on the Slovak side were performed on 12 forest monitoring areas, on 5 biological monitoring areas and on 3 agricultural areas – Tab. 5-1. Measurements on the Hungarian side were performed on 9 forest monitoring areas and 5 agricultural areas - Tab. 5-2. The situation of observation objects is shown on Fig. 5-1. Table 5-1: List of monitoring stations on the Slovak side
Table 5-2: List of monitoring stations on the Hungarian side
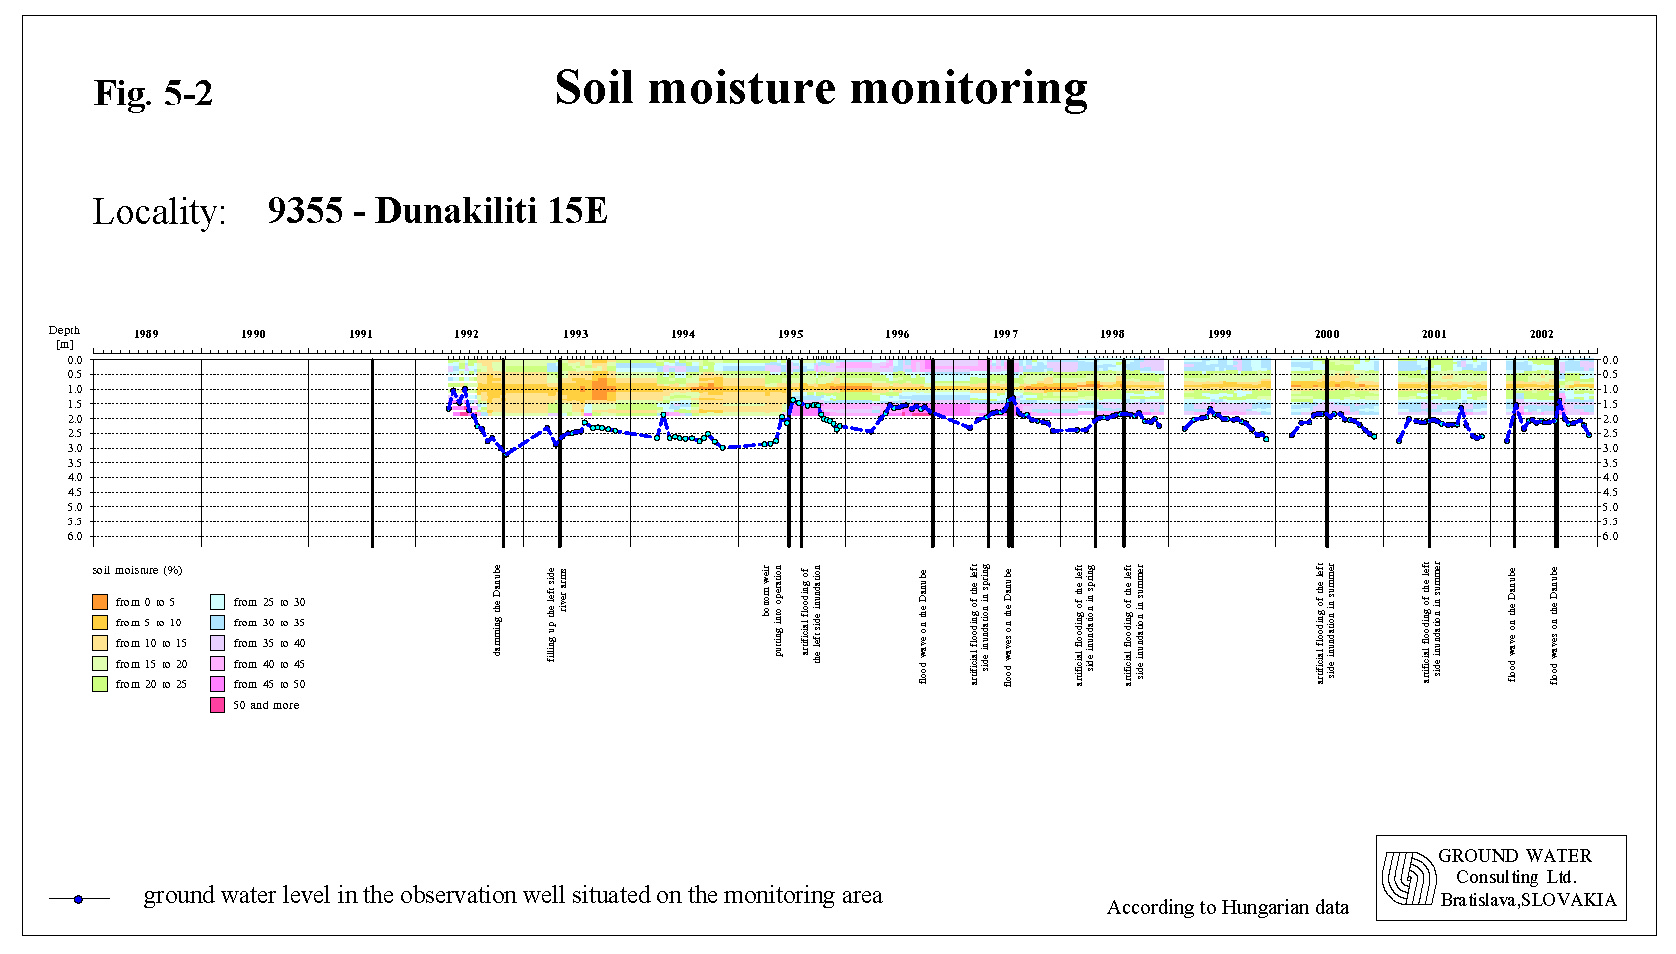
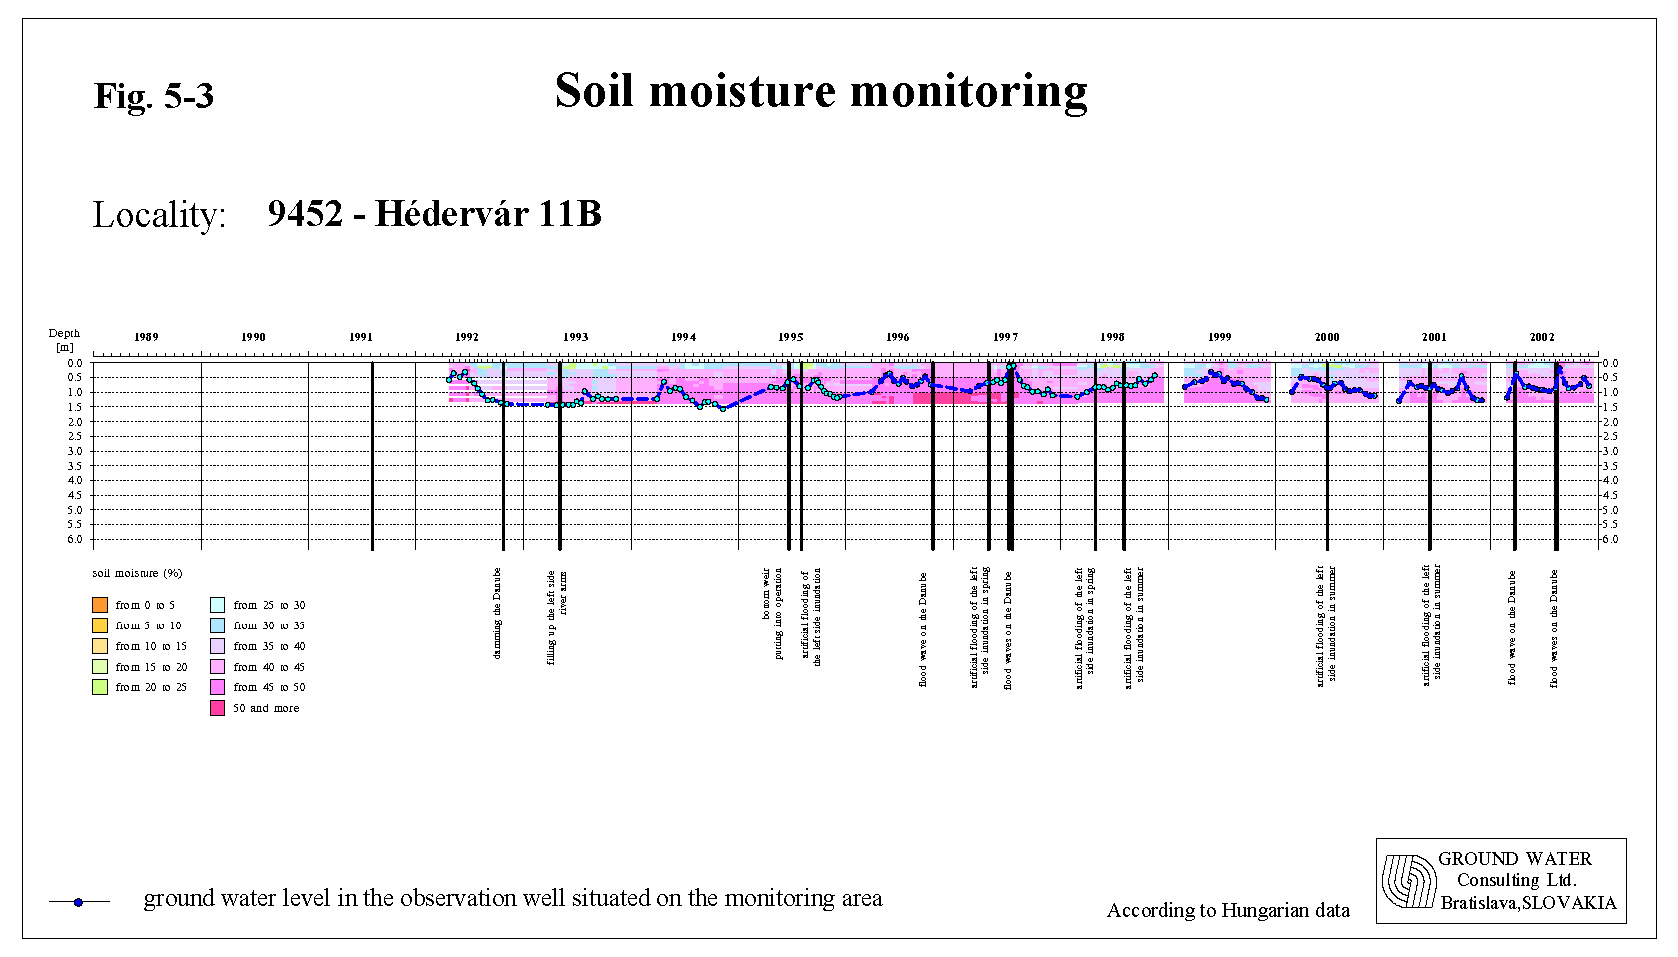
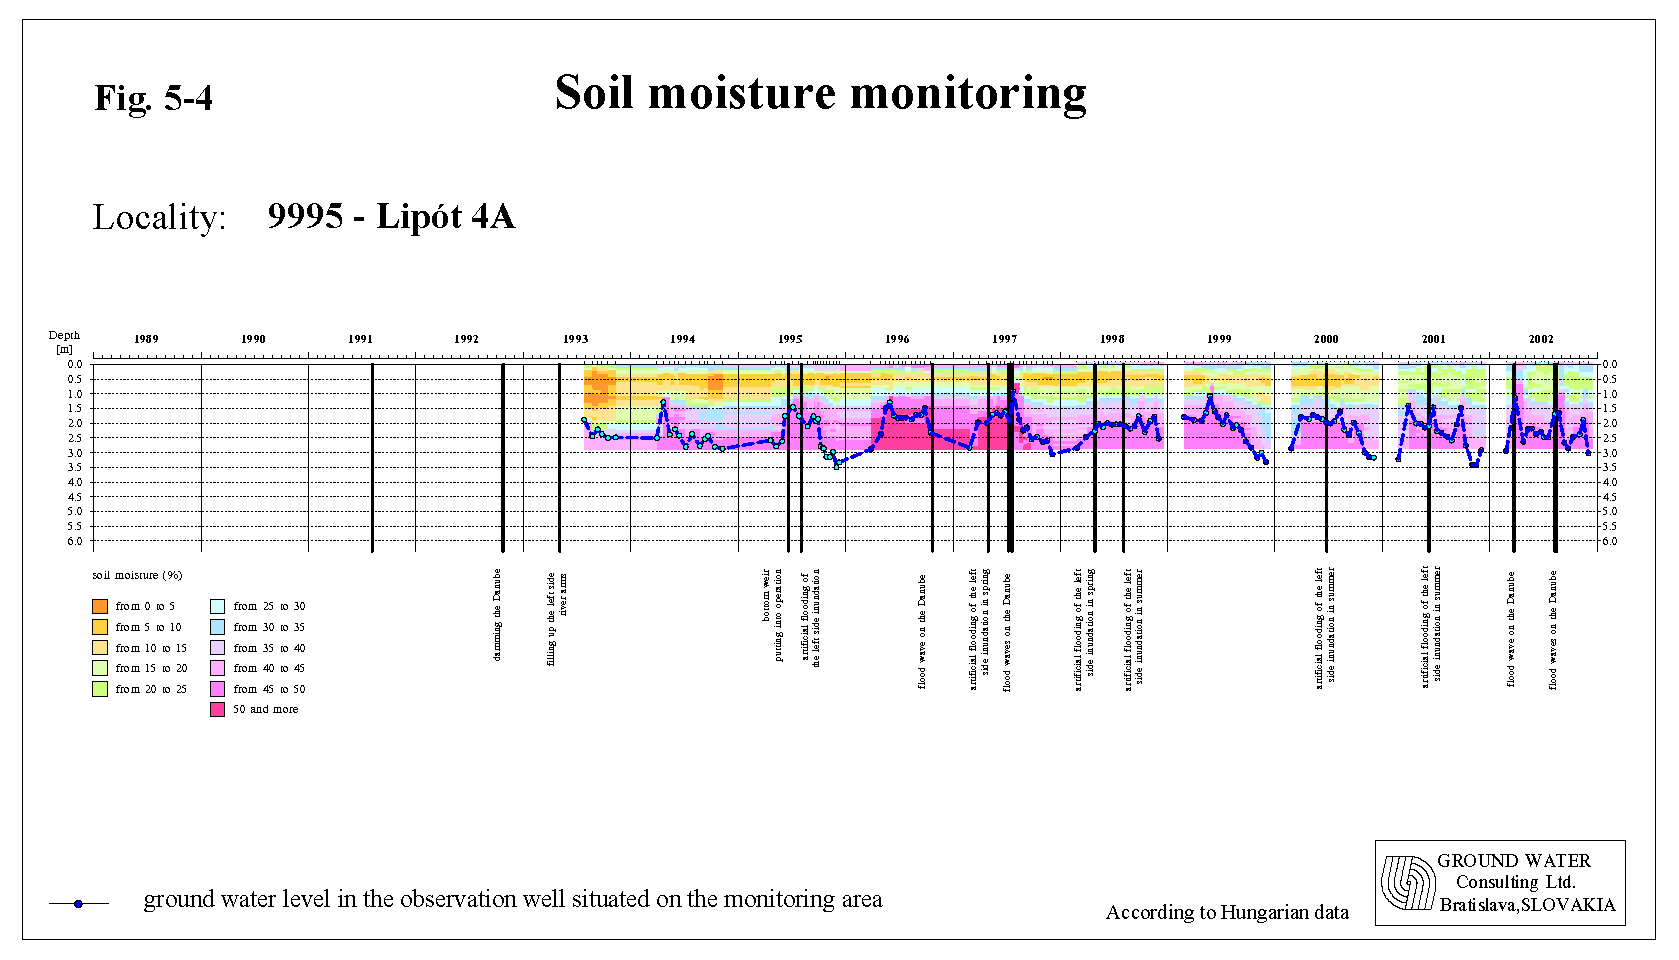
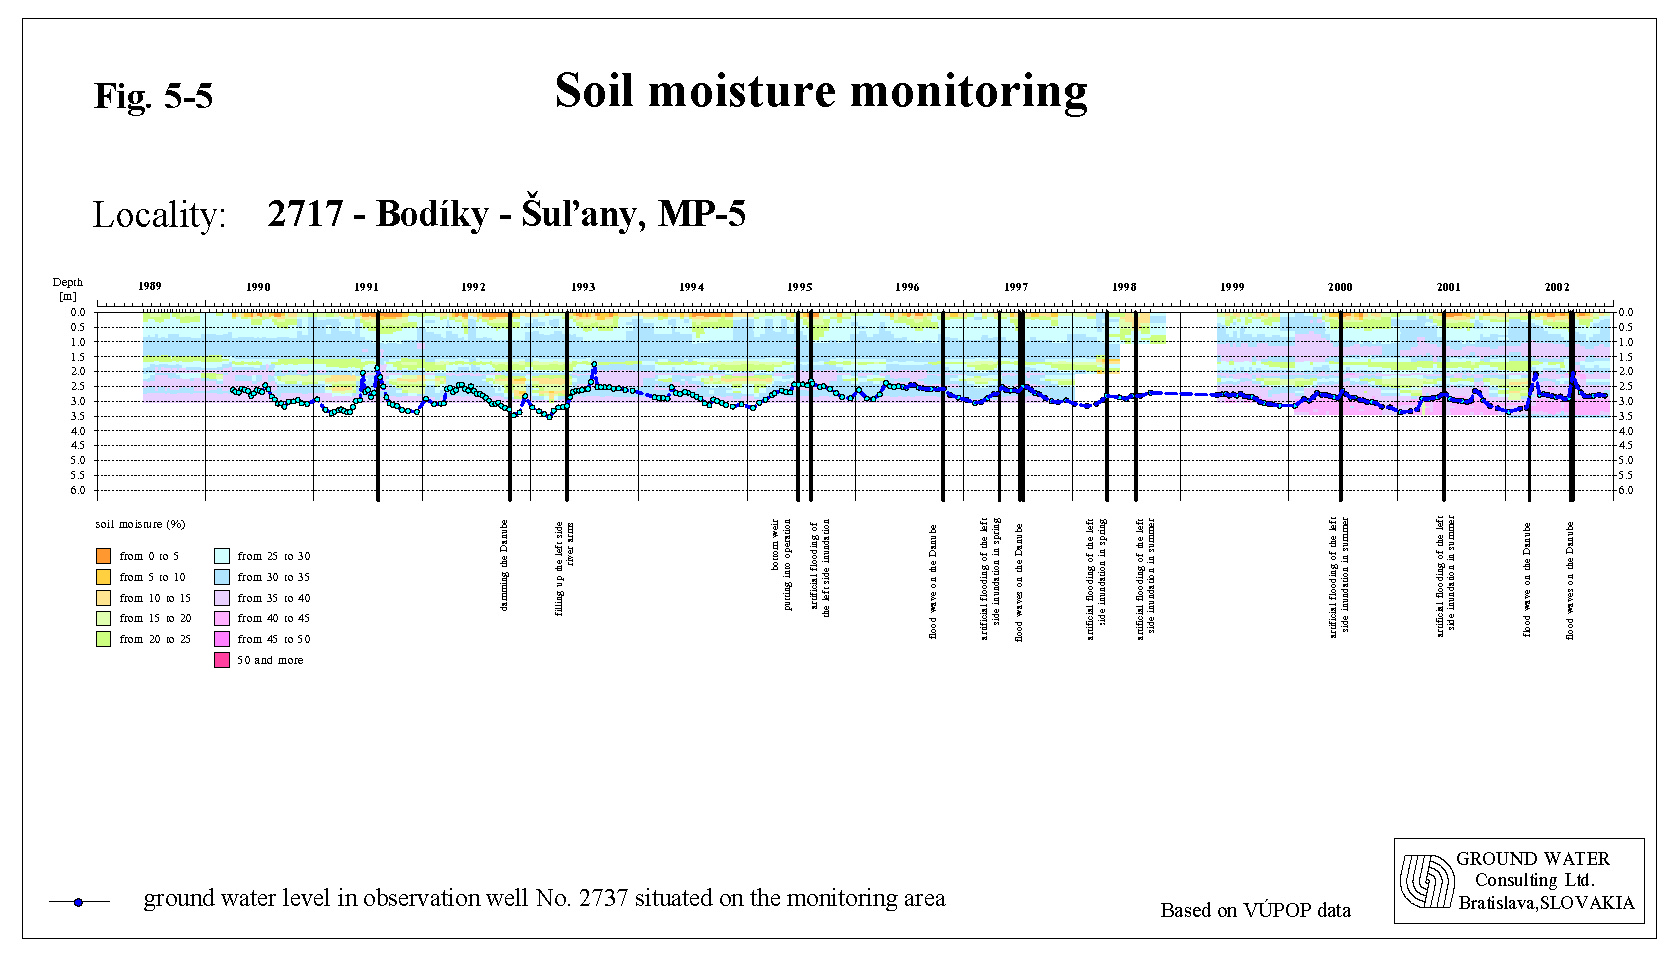
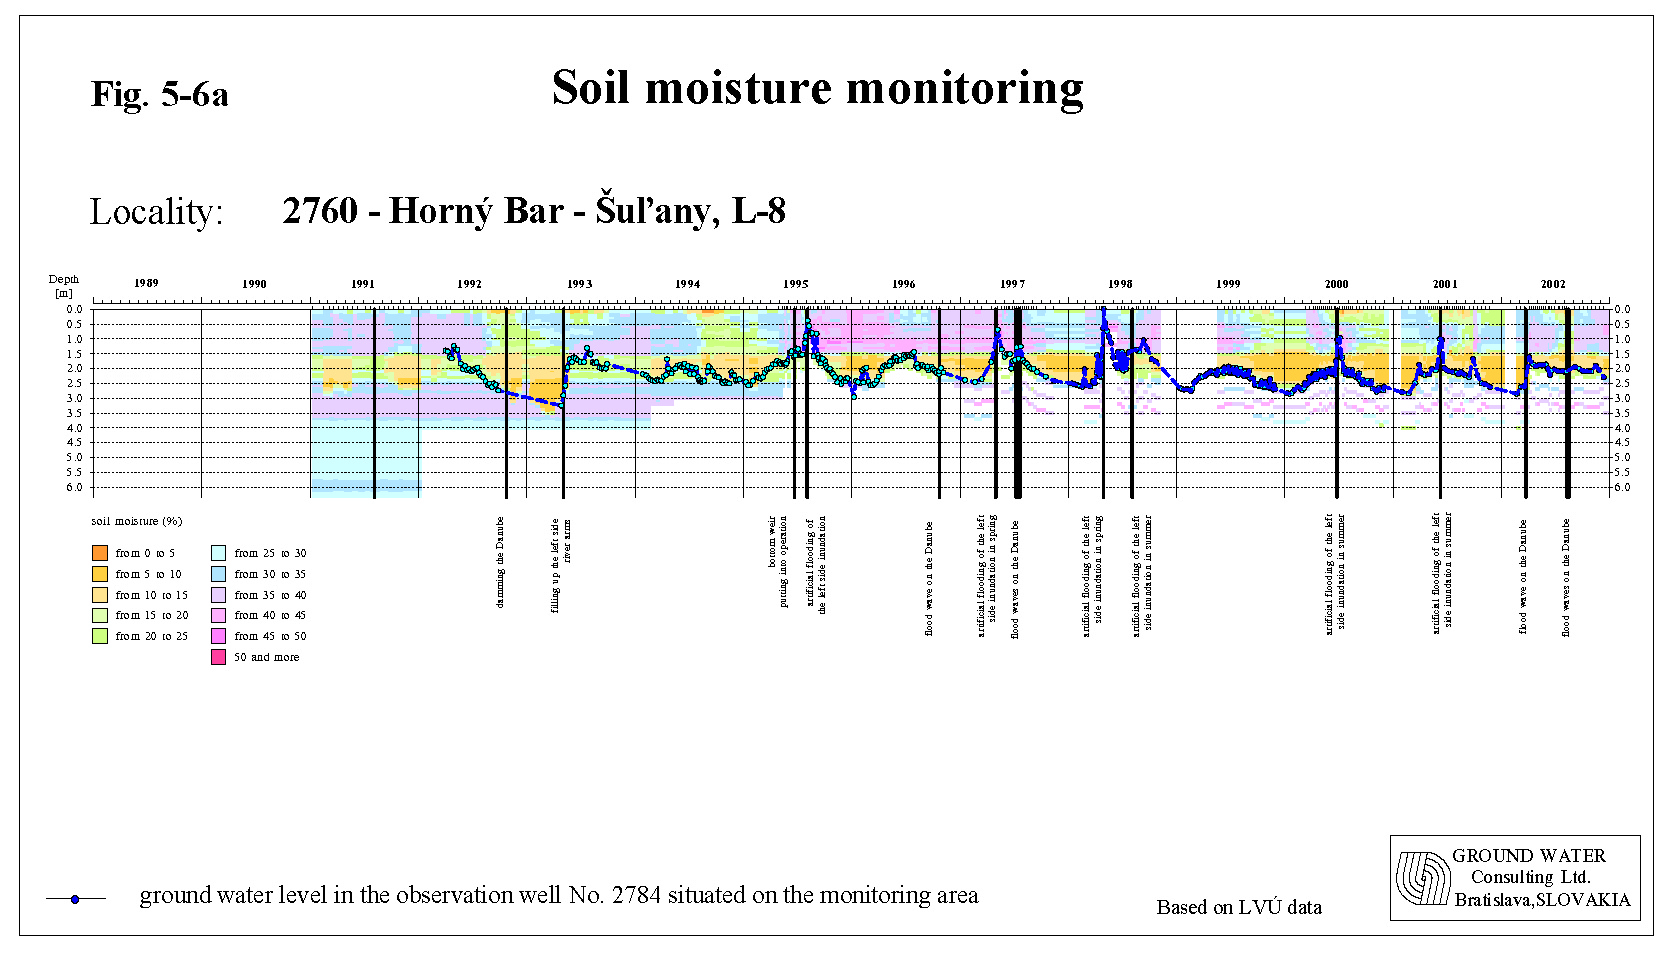
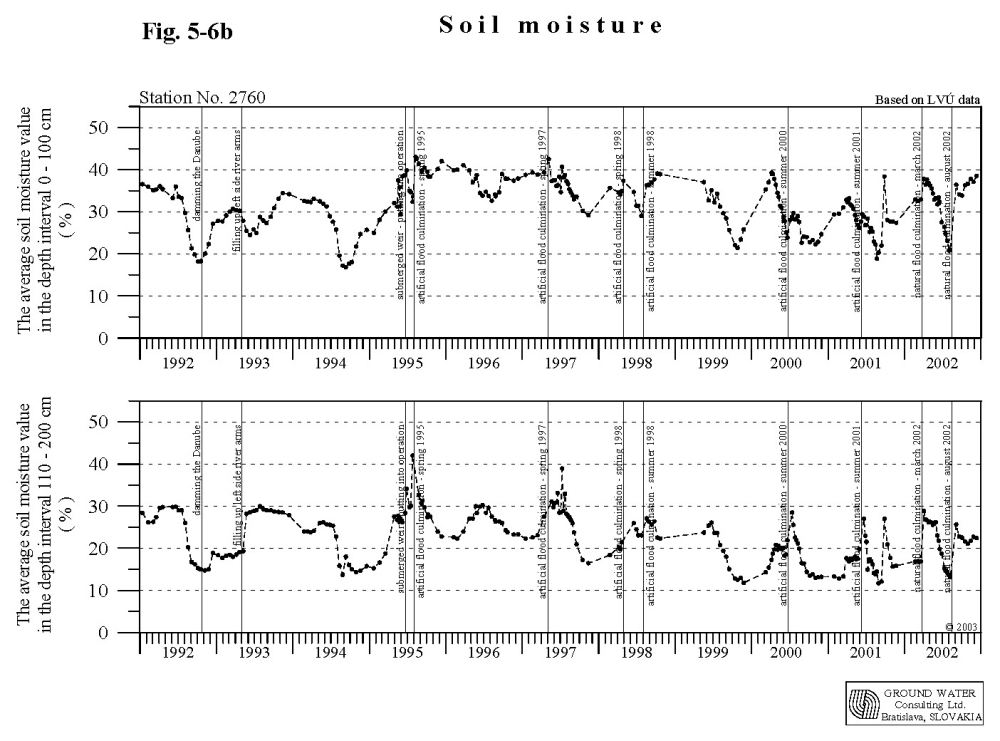
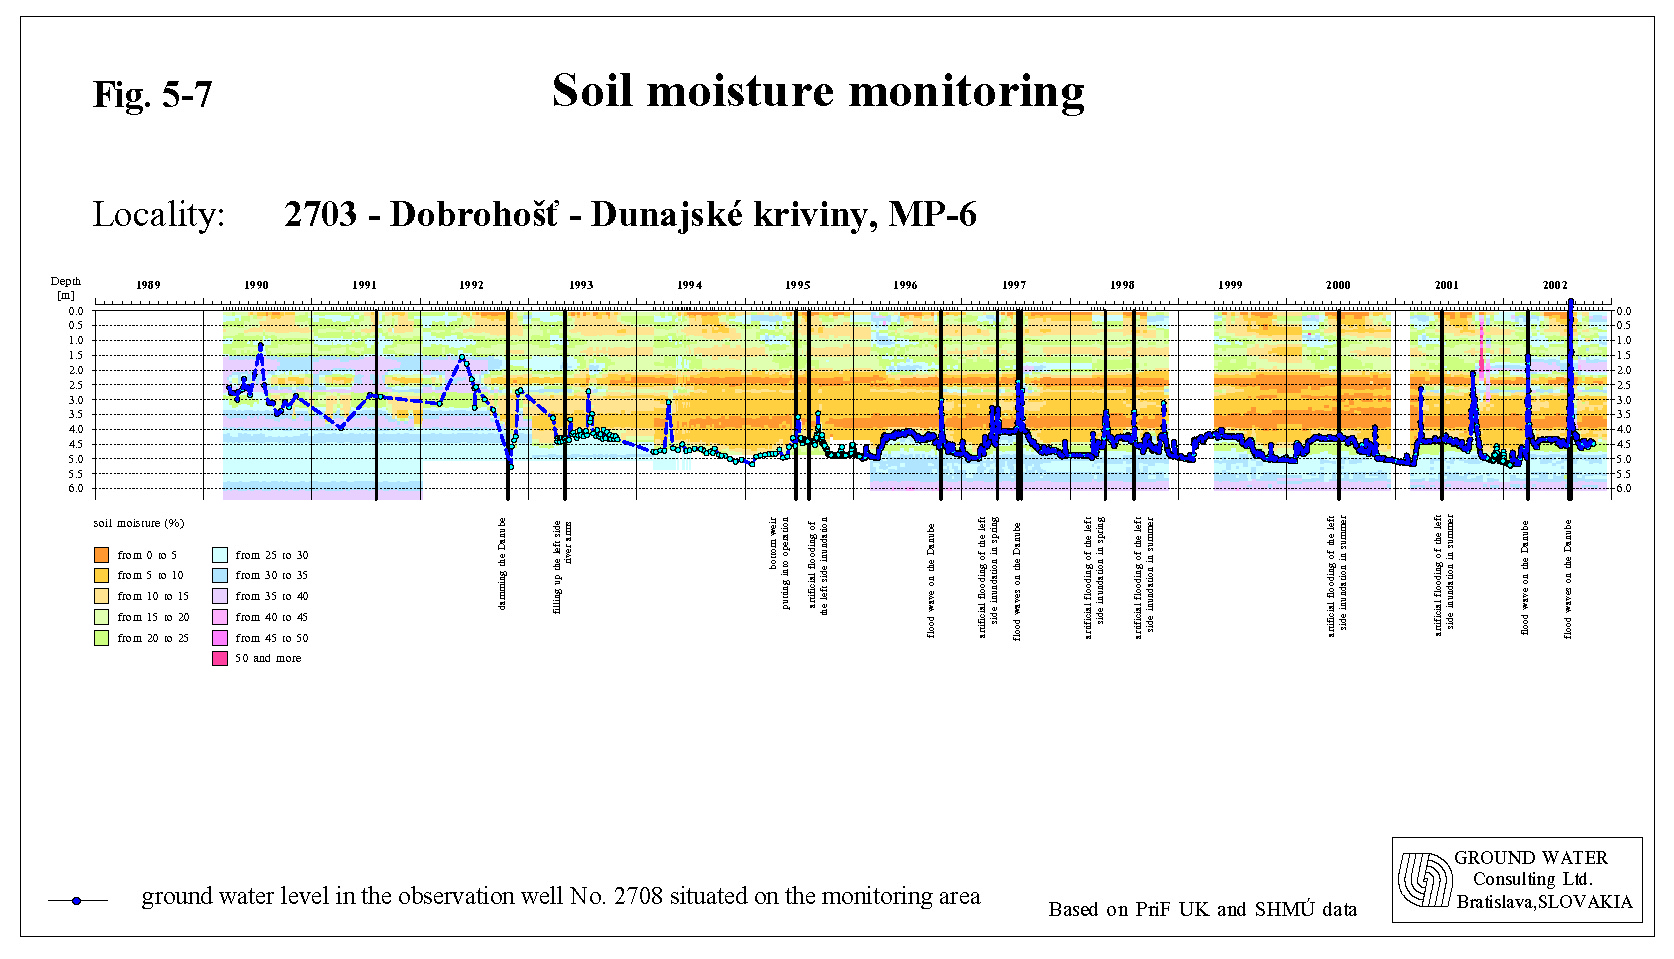
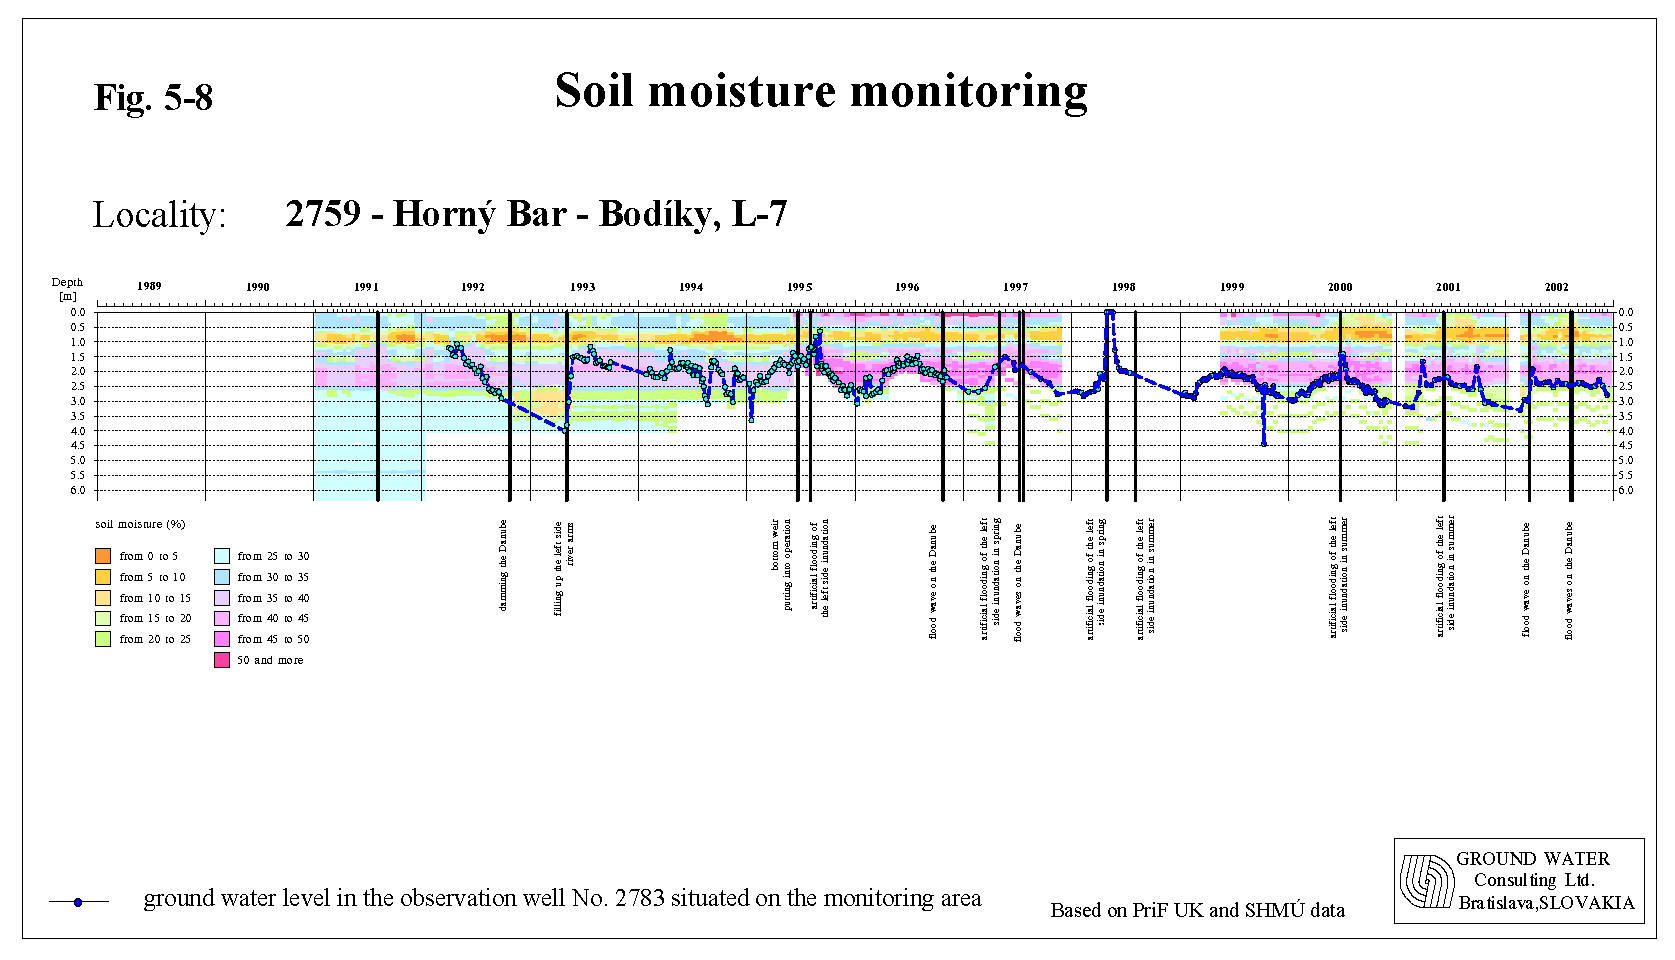
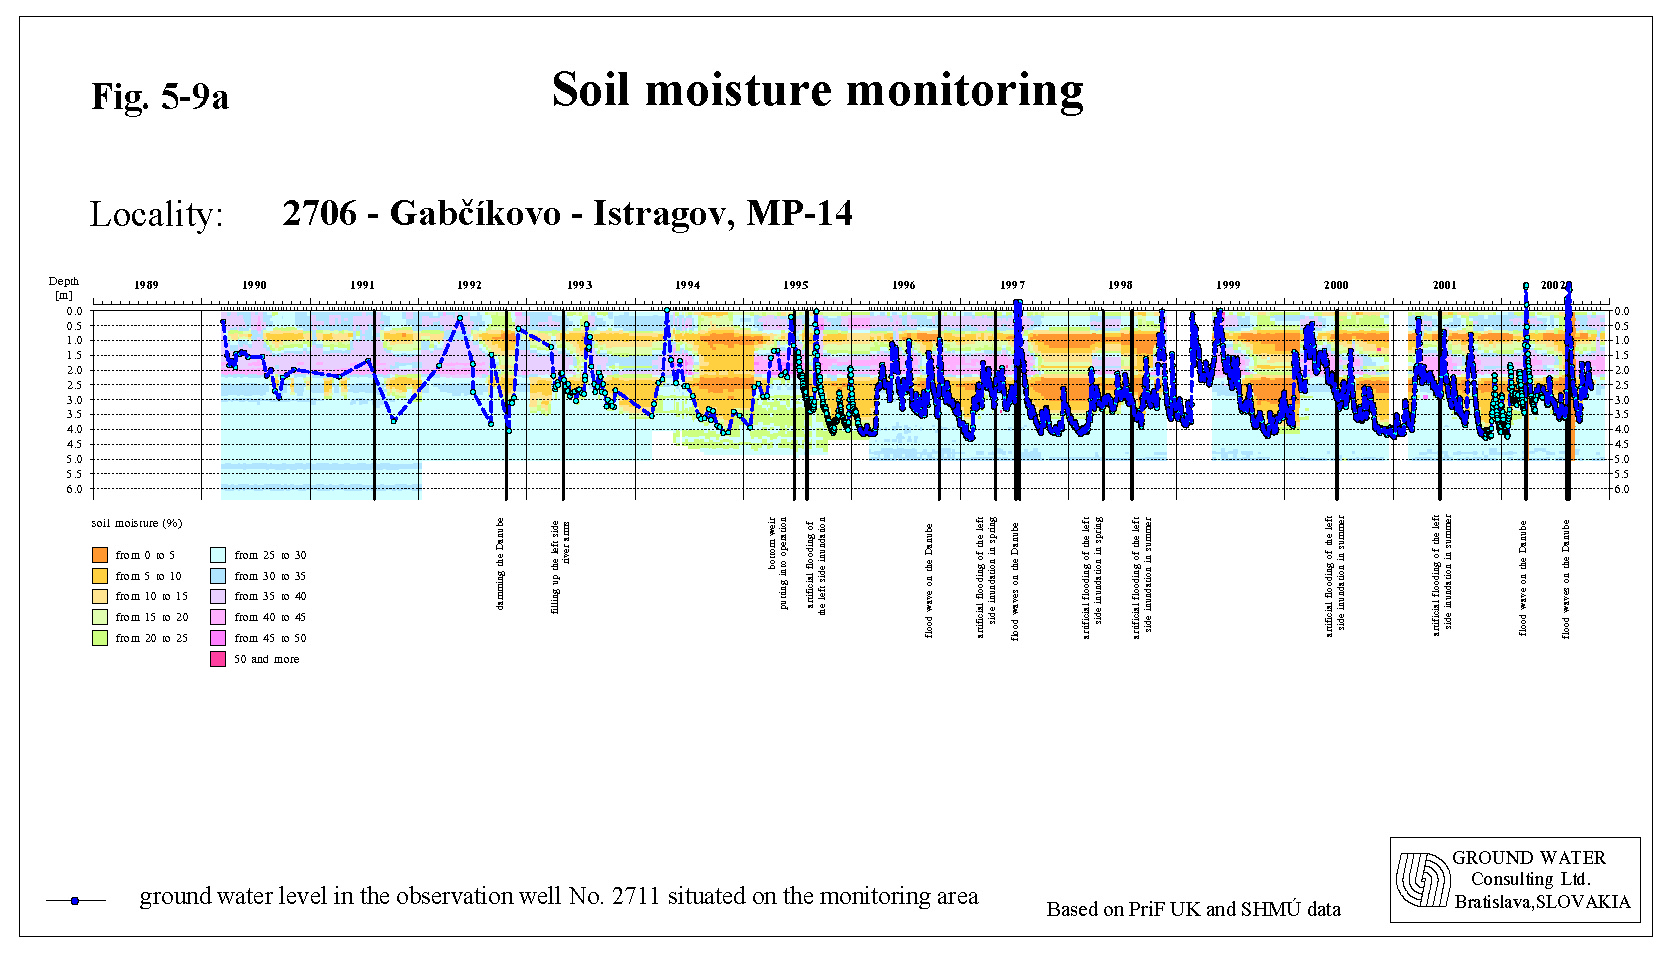
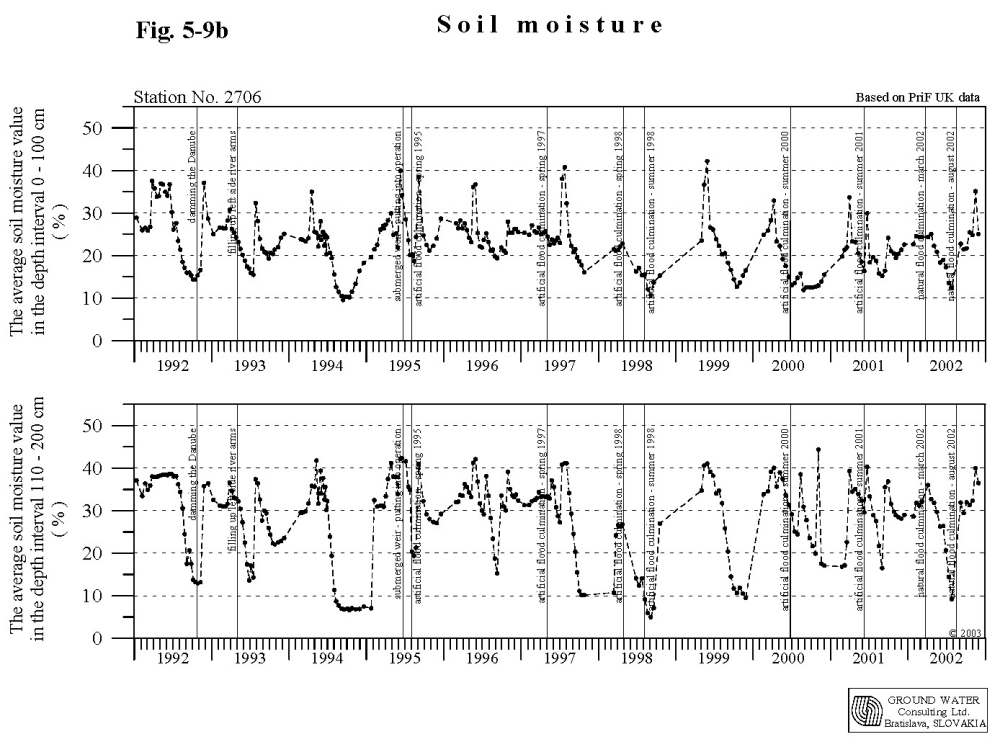
5.2. Data presentation methodsBoth Parties presents the soil moisture in figures showing the average soil moisture content in volume percentage for the depth interval from 0 to 100 cm and from 110 to 200 cm. A small difference occurs in Hungarian data, where the value for depth interval under the 110 cm represents the average value for the rest of total measured depth. On colour figures the soil moisture time distribution for the whole measured depth is presented. The graphical presentation of the whole set of measured data is given in the Slovak and Hungarian National Annual Reports. 5.3. Evaluation of results on the Hungarian sideMeasurements of soil moisture contents on the Hungarian side continued in 2002 at forestry monitoring sites in the floodplain area as well as at agricultural monitoring sites in the flood-protected area. The soil moisture conditions are basically influenced by the precipitation, by the soil layer thickness and by the ground water level position. The soil moisture creation in 2002 differed from that in 2001. The natural flood at the end of March significantly influenced the soil moisture content on the whole examined area. The soil on the monitoring sites situated in the inundation or close to the flood-protecting dike was fully or almost fully saturated by water. Some of the sites in the inundation were even covered by water. However, the ground water rise on monitoring sites more distant from the Danube was slight only and the soil saturation by water was limited. The following period was warm and dry. The ground water level continuously decreased. In May, June and July no significant flow rate occurred in the Danube. An extraordinary big flood in the middle of August stopped the continuous decrease of soil moisture content. Whole inundation area was flooded even the sites close to the dike were covered by seepage water. The upraised ground water level for a short time significantly influenced the distant areas as well. After the flood in August the ground water continuously decreased, however in September and October several times slightly increased for certain period during higher flow rates in the Danube. The soil moisture on forestry monitoring sites For all soil moisture monitoring point on forestry areas it was characteristic that both up to 1 m depth and below 1 m the maximum and average values of the soil moisture content were higher or significantly higher comparing to the previous year. However, the minimal values were comparable or only slightly higher comparing to the previous year, because periods with critical lack of moisture occurred in both years. The maximum average soil moisture content in the layer down to 1 m depth was recorded on 23rd of August at five monitoring sites, at the remaining three monitoring point it was recorded at the end of March. The minimum values were recorded at the end of June at five monitoring sites, and at three observation points in the middle of July. Regarding the effect of ground water on soil moisture content, differences can be observed at monitoring points. As a result of the water supply the ground water moisturised the soil at monitoring site No. 9355, 9994 and 9995 at various depth (Fig. 5-2, Fig. 5-4). No influence of the water supply was observed at monitoring sites No. 9452 and 9998 (Fig. 5.3) and limited influence of the water supply was at observation points No. 9498, 9996 and 9997. The observation point No. 9972 lies next to the Danube old riverbed and strong drainage effect is characteristic for this place. Floods in March and August created optimal moisture conditions in the soil profile at all forestry monitoring sites. The soil moisture on agricultural monitoring sites on the flood protected side At monitoring points No. 2630 and 2653, where the moisture depends on precipitation only due to the deeply situated ground water, the maximum, average and minimum soil moisture values were similar or even slightly lower comparing to the previous year, due to the unfavourable distribution and insufficient amount of precipitation during the year. At the other observed sites, the maximum, average and minimum soil moisture values were significantly higher, thanks to the positive influence of floods in March and August. Monitoring points No. 2605 and 9443 are situated in areas with thick covering layer. The ground water moisturised the bottom of soil layer from March till the end of the year. The abovementioned flood waves influenced the ground water level at these sites. The monitoring site No. 7920 is situated in the area where the drainage effect strongly influencing the ground water level. However, the ground water still moderately moisturised the thick covering layer. Moreover, the flood waves had positive influence on soil moisture. 5.4. Evaluation of Slovak resultsMonitoring sites on the Slovak side are situated in the inundation area and flood-protected agricultural area (Fig. 5-1). According to the soil moisture observation at monitoring sites situated in the agricultural area (sites No. 2716, 2717, 2718) it can be stated that the soil moisture content during the whole observed period remained unchanged (Fig. 5-5). The position and fluctuation of ground water level remained unchanged as well. The ground water level at the monitoring site No. 2716 fluctuated in the depth of 3-4 m, at site No. 2717 in the depth of 2.5-3.5 m and at site No. 2718 in the depth of 2-3 m. The fluctuation of soil moisture content in the depth interval from 0 to 1 m mostly depends on climatic conditions. In the depth from 1 to 2 m the soil moisture fluctuation, except the monitoring area No. 2716, is partly influenced by the ground water level. The soil moisture content in the depth to 1 m mostly fluctuated in the range from 5 to 20 % on the monitoring site No. 2716 and in the range from 20 to 30 % on the monitoring sites No. 2717 and 2718. In the depth between 1 and 2 m the soil moisture content mainly varied from 12 to 20 % on monitoring site No. 2716 and in the range from 28 to 40 % on monitoring sites No. 2717 and 2718. The situation in the inundation area is more complex. The changes of the soil moisture content depend mainly on the location of the monitoring site in respect to the Danube, in respect to the river branch water supply and from the soil profile thickness. The soil moisture is besides the ground water level and precipitation highly dependent on natural or artificial floods. In hydrological year 2002 there were two big floods in the area. Primarily the spring flood in March very positively influenced the moisture content in soils. The inundation area, mainly downstream of Bodíky village, was covered by water. The growth of trees and vegetation at the beginning of the vegetation period were supported by soil moisture. However, the following three months (May, June and July) were dry and warm. This fact slowed down the development of vegetation. The inundation area during the second flood in August was fully covered by water. The water level reached app. 0.5 to 3 m over the surface. Soils were again fully saturated by water. In the inundation area around Dobrohošť and Bodíky villages is the thickness of the soil profile, similarly to the Hungarian side, low - monitoring sites No. 2703, 2764, 2763, 2762 and 2761. The ground water level in hydrological year 2002 fluctuated mainly in the gravel layer, only during floods the water came up to or above the surface. Usual depth of the ground water level on the area No. 2703 was about 4.5 m, on the areas No. 2764, 2763, 2762 and 2761 changed from 2.5-4 m. The average values of the soil moisture content in the depth to 1 m significantly fluctuated and they were highly dependent on the climatic conditions. The soil moisture values in the depth interval from 1 to 2 m are less dependent on climatic conditions and in the year 2002 were rather even-tempered. Intensive soil moisture supply from ground water occurred during natural floods in March and August (Fig. 5-7). The maximum average soil moisture content occurred in March and August. During the vegetation period the soil moisture content in the layer down to 1 m depth significantly decreased. The minimum values occurred at the end of July and the beginning of August. At the end of the year the soil moisture content, influenced by the flood in August, remained higher. The thickness of the soil profile in the middle part of the inundation area is higher. The ground water regime in this region is influenced by the water supply of the river branch system, introduced in May 1993. Moreover, the natural or artificial floods are with high influence on the ground water level. The ground water level fluctuates mostly above the boundary between the soil profile and gravel layers - monitoring sites No. 2704, 2705, 2758, 2759, 2760 (Fig. 5-6a,Fig. 5-6b, Fig. 5-8). The lack of precipitation during the dry period in 2002 resulted in continuous decrease of the soil moisture content in the upper part of the soil layer. The ground water significantly supplies the soil profile in the depth interval from 1.5 to 3 m. During the floods the ground water level fully saturated the soils Every monitoring sites in the inundation were flooded. The maximal values of soil moisture content were reached in March and August, minimal values occurred at the end of July and beginning of August. In the lower part of the inundation area, downstream of the confluence of river branch system and the Danube (monitoring sites No. 2706, 2756, 2755), the ground water level fluctuates around the boundary between the soil profile and the gravel layer. The average values of the soil moisture significantly fluctuate, and are strongly dependent on the ground water level fluctuation. The minimum and maximum values are related to the minimum and maximum ground water levels respectively. In 2002 was the soil moisture positively influenced by high flow rates in the Danube and during floods (Fig. 5-9a,Fig. 5-9b). Minimal values of soil moisture occurred at the end of July and beginning of August. The soil moisture contents at monitoring sites No. 2707, 3804, 3805, located in the inundation below the confluence of the tailrace canal and the Danube old riverbed, are highly influenced by the flow rate regime in the Danube. The maximum values in the year 2002, in the depth down to 1 m and between 1 and 2 m, occurred in March and August (floods), while the minimum values occurred at the end of July. The ground water level at monitoring site No. 2707 fluctuated mostly in the depth 2-3 m, on the other sites in the depth 0-2 m.
|