PART 2
Surface Water Quality
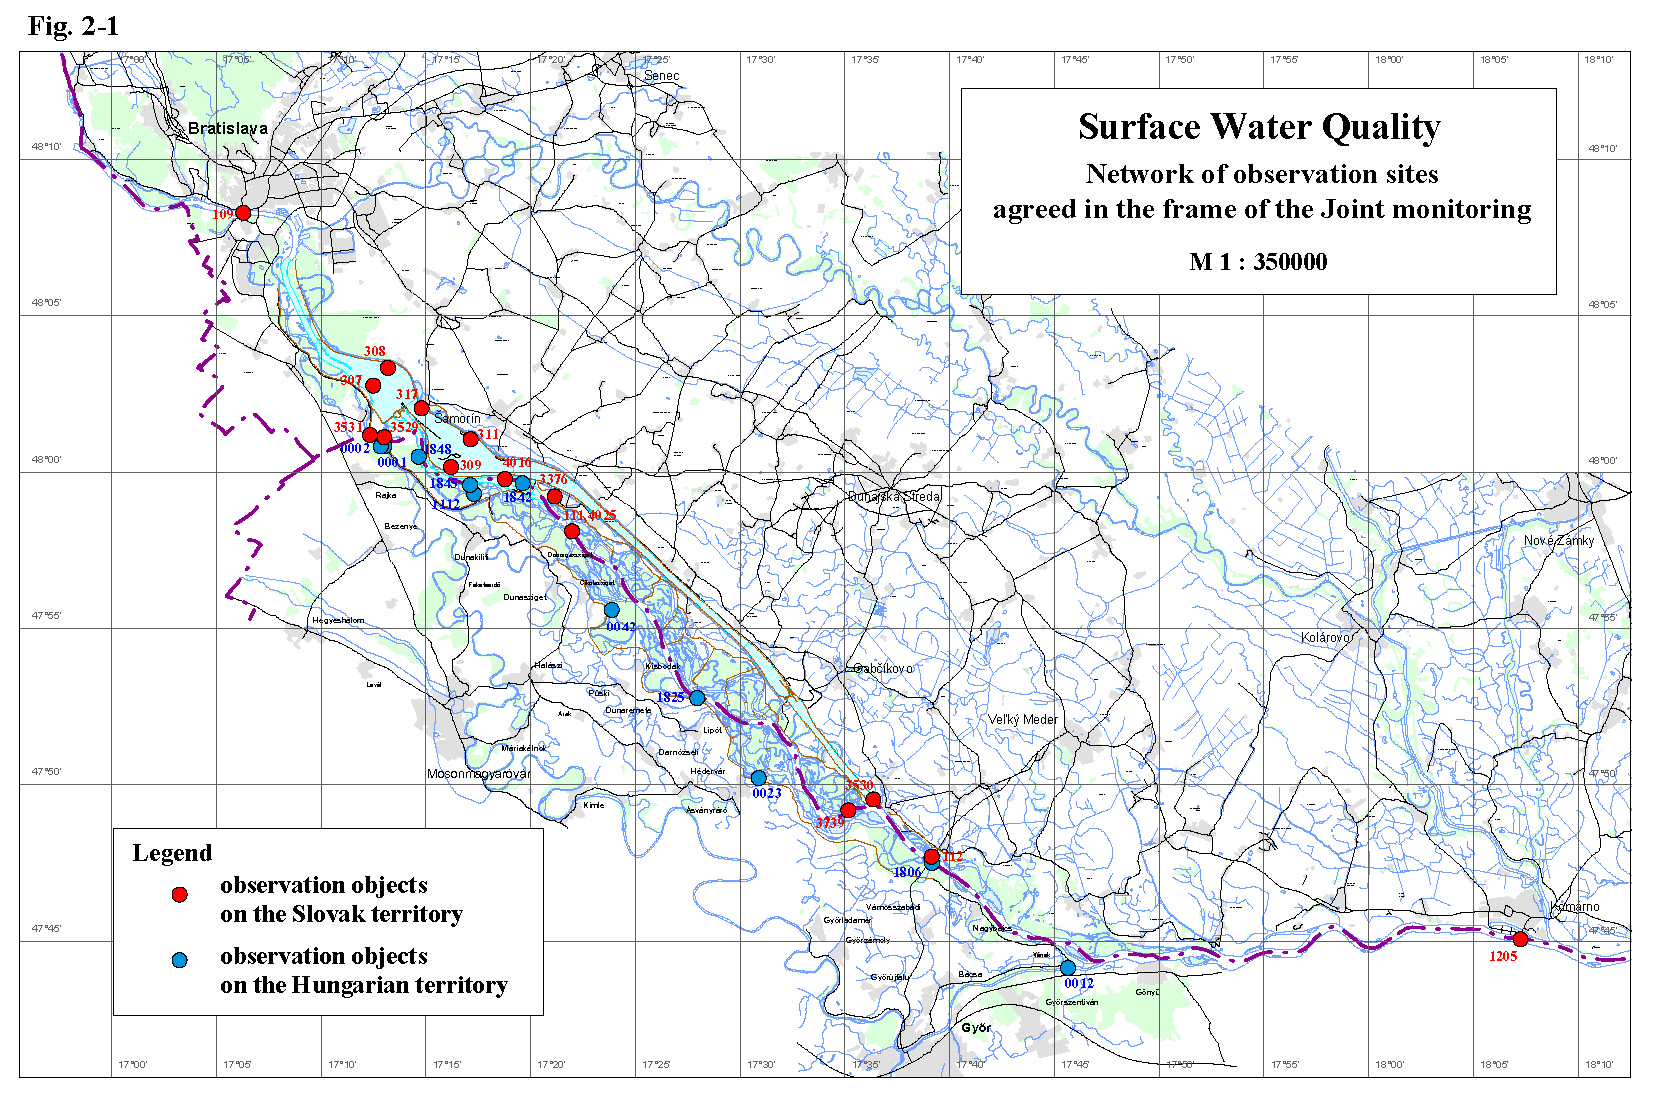
Surface water quality measurements in 2002, according to the Agreement, were carried out at 11 monitoring sites on the Hungarian territory and at 15 monitoring sites on the Slovak territory - Table 2-1, Fig. 2-1. In the year 2002 the Hungarian side, based on the Recommendations in the Joint Annual Report in 2001, included three existing monitoring sites in the Danube old riverbed into the sampling sites observed in the frame of the Joint monitoring. Two of them are situated just upstream and downstream of the bottom weir at Dunakiliti, rkm 1843, the third is located at Dunaremete, rkm 1825. On the Slovak side the sampling site No. 4025 on the same place will replace the sampling site No. 111 – Dobrohošť, observed by the Water Research Institute. The observation will be performed by the Slovak Water Management Authority. At all of monitoring sites the influence of the measures, described in the Agreement, on the surface water quality was observed. Main factors, which could influence the water quality, are: the backwater effect upstream of the bottom weir, the increased discharges into the Danube downstream of the Čunovo dam and into the Mosoni branch of the Danube, the water supply into the right side river arm system, and morphological changes in the riverbed. Sampling and analysing were mainly performed according to methods agreed by the Sub-commission for Water Quality Protection of the Slovak-Hungarian Trans-boundary Water Commission. Surface water quality and sediment quality data for agreed monitoring sites are given in the Annexes to the Slovak and Hungarian National Reports on the Environment Monitoring in 2002. However, the Hungarian national data for joint sampling sites (5 profiles) were not provided in 2002. Due to the above-mentioned reason the evaluation on these sampling sites was based on the so-called unified data of the Trans-boundary Water Commission, while on the rest of the sampling points the national data were used. The time series diagrams for the respective parameters of the surface water quality are given in the Annexes to the National Reports. The figures in this report present the data of selected parameters. In case of joint sampling points the so-called unified data of the Trans-boundary Water Commission and the Slovak National data are presented. In the evaluation the agreed limit values for surface water quality, agreed on LV. session of the Slovak-Hungarian Trans-boundary Water Commission, were used (Table. 2-2). Table 2-1: List of monitoring sites
Table 2-2: Agreed limits for surface water quality classification
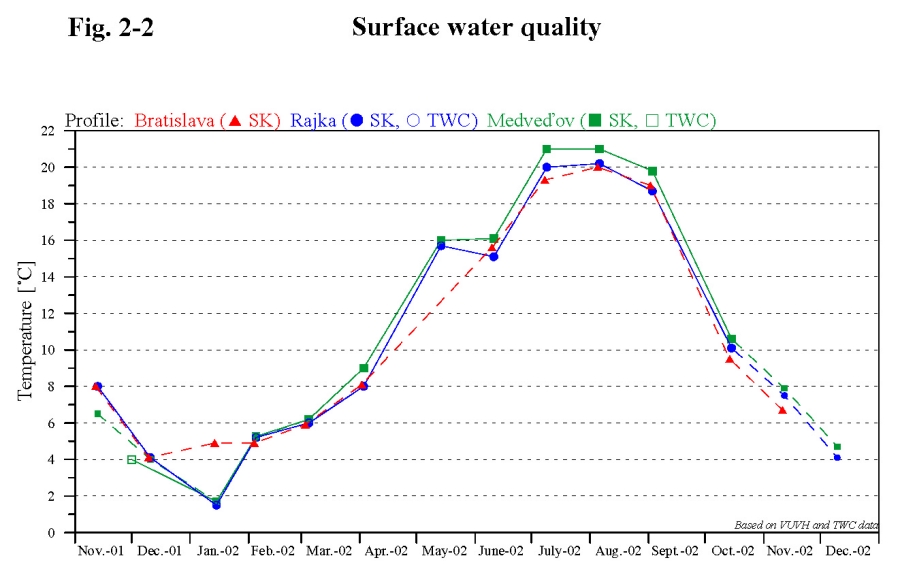
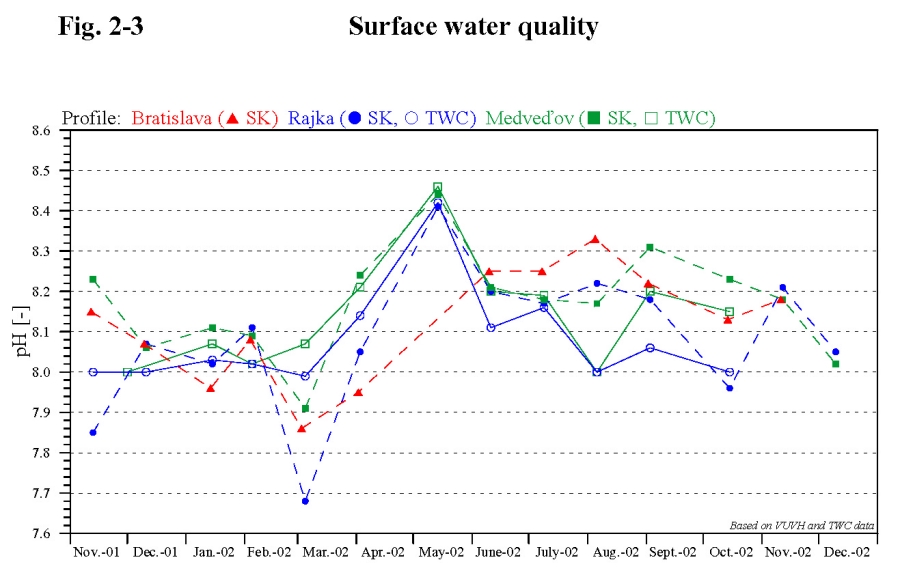
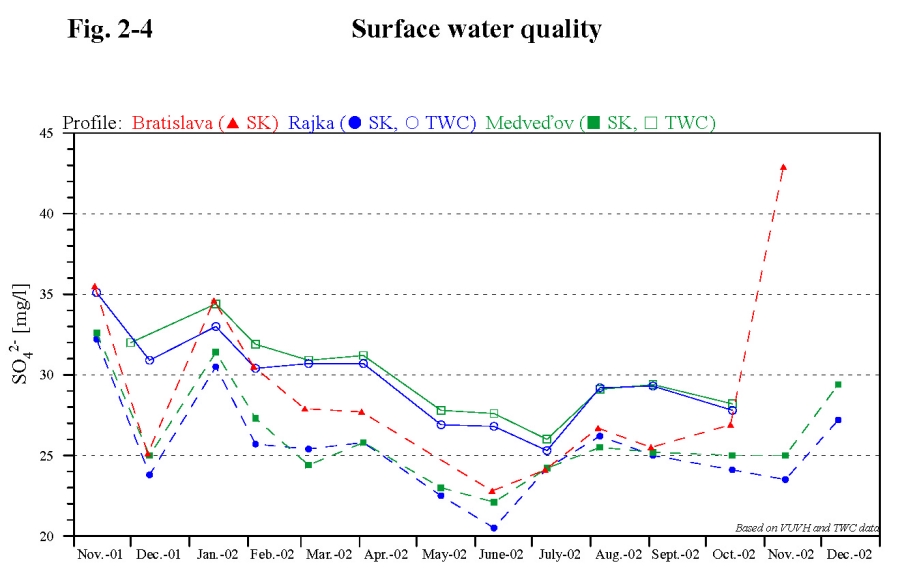
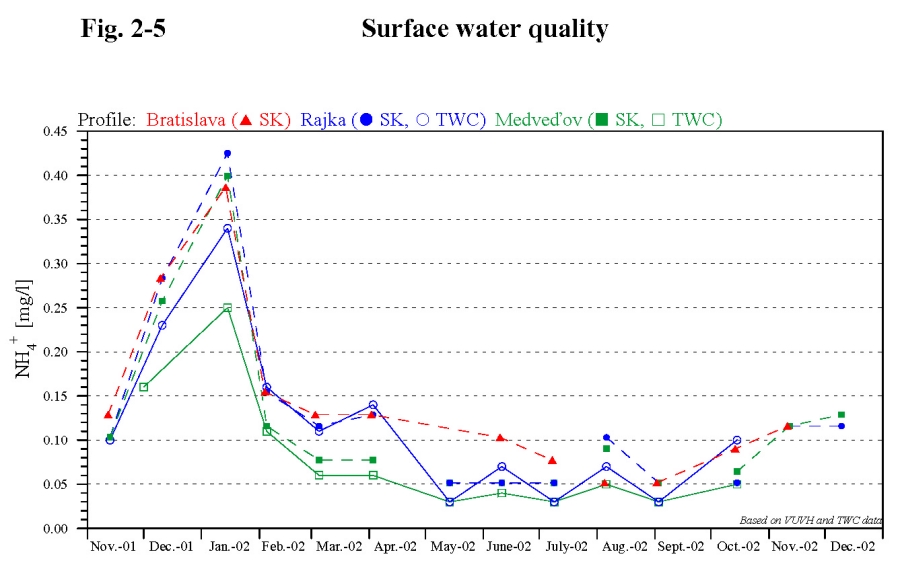
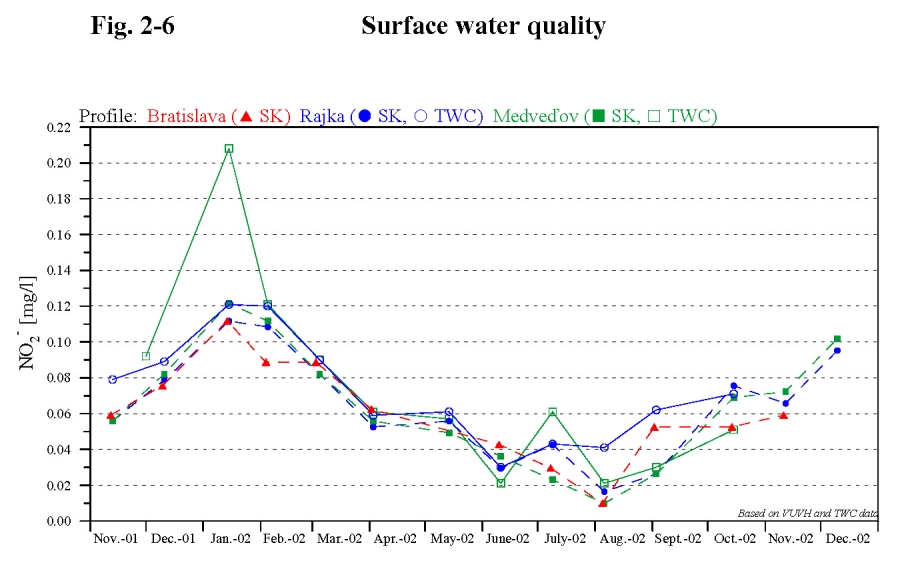
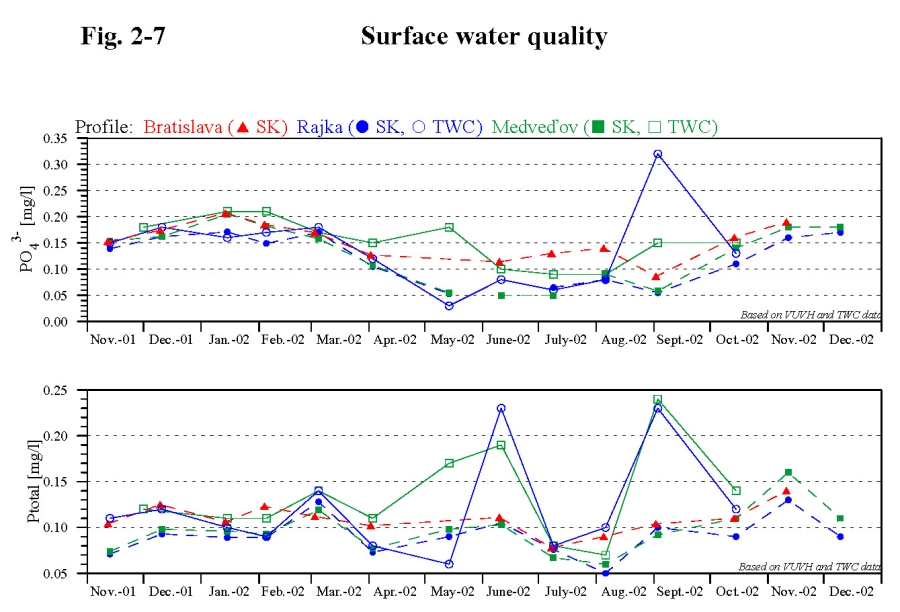
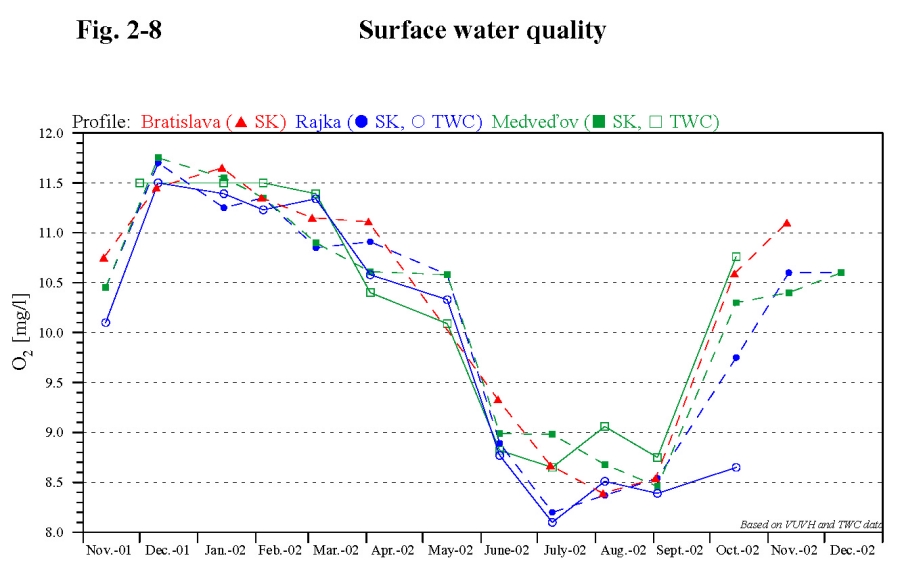
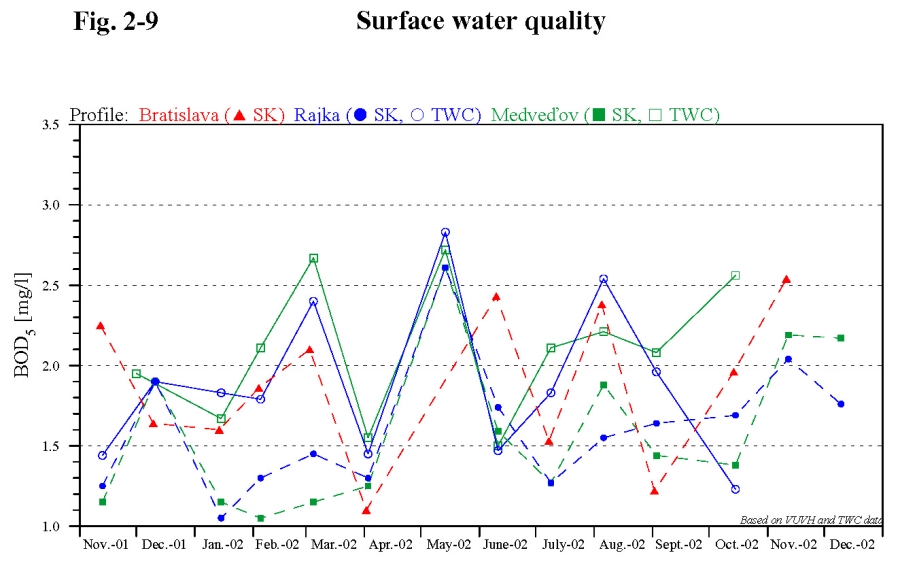
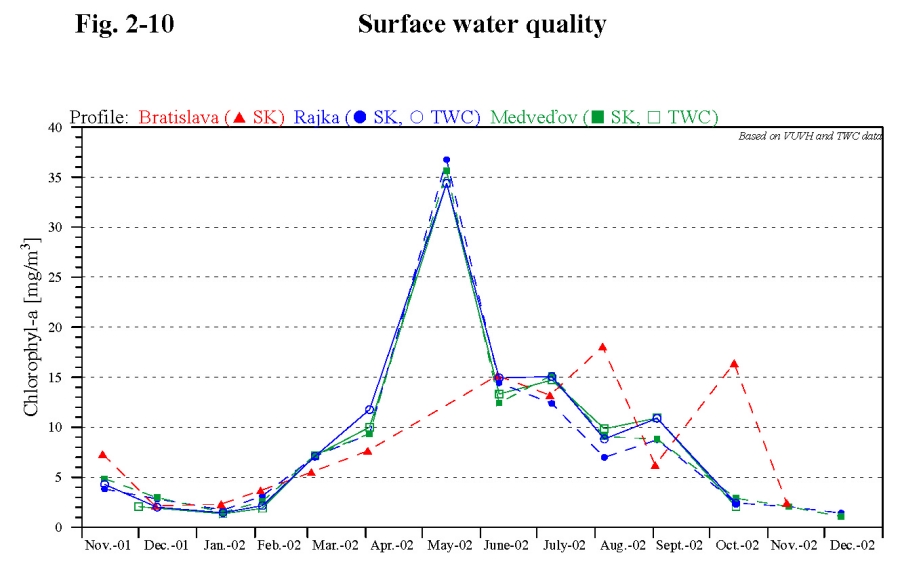
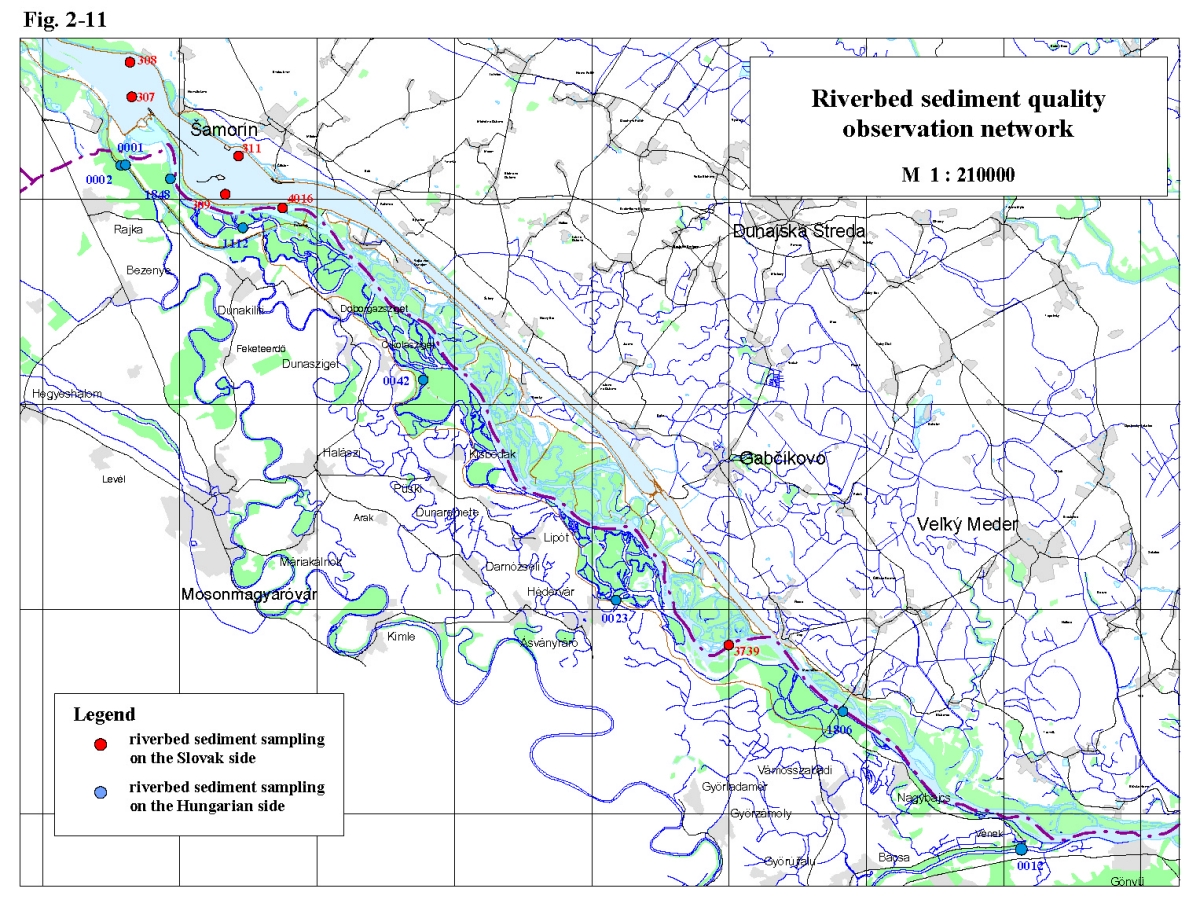
2.1. Basic physical and chemical parametersWater temperature The water temperature fluctuation in the whole Danube stretch downstream of Čunovo follows the water temperature course observed in the Danube at Bratislava (sampling site No. 109). In the actual year it fluctuated in the range from 1 to 21 °C, in the reservoir up to 25 °C, while maximum values occurred in July and August and minimum values in January. The water temperature in the seepage canal was different, just as in the previous years. In the winter period it was warmer (by 1 °C) and in the summer period cooler (by 1-4 °C), because the seepage canal is supplied by the ground water. The water temperature in the Mosoni Danube at Čunovo sampling site was similar to the water temperature in the Danube and fluctuated from 1 to 21 °C, at the Vének sampling site fluctuated from 3 to 24 °C. The water temperature in the right side river branch system in the winter period was cooler comparing to the Danube water, the summer maximums reached the values observed in the Danube water. The water temperature at selected sampling sites for hydrological year 2002 is documented in Fig. 2-2. pH Higher values of pH occur in seasons corresponding with periods of increased assimilation activity of phytoplankton. Resulting from the decreased assimilation activity in winter period the pH values were lower than in summer period. The Danube water pH values in the hydrological year 2002 fluctuated in the range from 7-8.6, while the higher value occurred during the algae growth (mainly in May, while the second culmination of algae growth was stopped by the flood in August). The pH values in the river branch system and in the Mosoni Danube fluctuated between 7.8 and 8.55, while the pH values at these sampling sites were higher in the winter period and in April and May, and during the vegetation period were lower. The pH values in the seepage canal varied from 7.66 to 8.25. The water pH values are documented in Fig. 2-3. Specific electric conductivity The specific electric conductivity of the surface water refers to the dissolved solids content of mineral origin. The conductivity values in the Danube and in the right-side river branch system in 2002 in principle follow the conductivity values at the Bratislava profile (No. 109) and fluctuated between 29 and 44 mS.m-1. Higher salinity occurs in the period from November to January, during the year decreases and the minimum value reaches in June. Then it increases again. The dissolved solids content in the Mosoni Danube at Čunovo sampling site is similar to that in the Danube water. At the Vének profile is higher comparing to the other water bodies (it is affected by the impact of the affluents and also due to the loads coming from the wastewater). However, it did not reach the values from years before 2001 and fluctuated in the range from 33 to 55.5 mS.m-1. The electric conductivity values in the seepage canal, similarly to the previous years, fluctuated in the range from 33 to 47 mS.m-1, while during the period from February to July were higher in comparison to the Danube water (Bratislava sampling site). Suspended solids The suspended solids content is closely related to the flow rate. The suspended solids content fluctuation during the hydrological year 2002 in the whole Danube stretch downstream of Čunovo follows the suspended solids content fluctuation in the Danube at Bratislava (No. 109). The suspended solids content mainly fluctuated in the range from 4 to 50 mg.l-1. Three samples taken at the Bratislava (No. 109) and Kalinkovo (No. 307) sampling sites and one sample at Kalinkovo (308), Šamorín (311), tailrace canal (3530) and Medveďov (112) during the flood periods exceeded the 50 mg.l-1. Higher values are related to periods with increased flow rate. In the seepage canal the content of suspended solids fluctuated between 1-18 mg.l-1. The suspended solids content along the longitudinal profile of the right side river branch system was low, similarly to previous years. It fluctuated around 40 mg.l-1, while maximal values occurred at the end of March (Helena sampling site, 86 mg.l-1) and in August (Szigeti river arm, 152 mg.l-1). In the Mosoni Danube at Čunovo the content of suspended solids fluctuated from 7 to 28 mg.l-1, at the Vének profile the suspended solids content fluctuated from 10 mg.l-1 to 50 mg.l-1, while one value in September reached 99 mg.l-1. Basic physical and chemical parameters - summary The basic physical and chemical parameters in the Danube and in the river branch system connected to the Danube main riverbed show seasonal variations and some of them predominantly depend on the flow rate. The suspended solids content fluctuations in the whole Danube stretch downstream of Čunovo follow the suspended solids content fluctuation in the Danube at Bratislava (No. 109). The fluctuation of basic physical and chemical parameters in the Mosoni Danube and in the right side seepage canal reflects the different characteristics of these water bodies. The water quality in the Mosoni Danube is influenced by its affluents and wastewater from Győr; the water in the seepage canal is influenced mainly by the leaking ground water. No significant changes in the water quality were recorded in the hydrological year 2002 in comparison to the previous year. 2.2. Cations and AnionsThe quantitative ratio of the ionic composition of the Danube water during the hydrological year 2002 showed high stability, just as in previous years. The seasonal fluctuation of the quantitative ratio of the ionic content followed the changes in salinity (first of all changes of magnesium, calcium, sodium, chloride and hydro-carbonate ions content) related to the flow rate fluctuations in the Danube. Comparing to the long-term measurements the values of basic cations and anions have not changed. The course of the sulphate concentrations measured by the Slovak and Hungarian Party is showed on Fig. 2-4. The most stabile ionic content was characteristic for the seepage water. Higher dissolved solids content in the Mosoni Danube downstream of Győr occurred in relation with higher sodium, magnesium and sulphate concentrations in the first half of the year. 2.3. NutrientsNitrates Nitrates concentrations in 2002 at all monitoring sites in the Danube as well as in the right-side river branch system show seasonal fluctuation. Values mainly fluctuated in the range from 3 to 16 mg.l-1. Nitrates concentrations in the Mosoni Danube at Vének sampling site were mostly lower in comparison to the Danube water and fluctuated in the range from 3 to 14 mg.l-1. Nitrates in the seepage canal in 2002 equally fluctuated in the range from 3 to 10 mg.l-1. Ammonium ion In the hydrological year 2002 the ammonium ion concentrations at all measured sites in the Danube and in the river branch system as well reached the maximum values in January (from 0.39 mg.l-1 at Bratislava to 0.56 mg.l-1 at Sap). In the following period concentration fluctuated from 0.01 to 0.15 mg.l-1 (Fig. 2-5). In general higher concentrations occur during the periods with lower water temperature due to the slower nitrification processes. The ammonium ion concentrations are the lowest in the seepage canal, where varied from 0.05 to 0.35 mg.l-1. The ammonium ion concentration in the Mosoni Danube at Čunovo sampling site varied from 0.04 to 0.44 mg.l-1, at Vének profile in the winter period was the concentration in several occasions two times higher than the concentrations observed on the other profiles. However the maximum value in comparison to the previous year was lower (0.61 mg.l-1 in January, 0.63 mg.l-1 in October). Nitrites The nitrite ions concentrations, considered as a temporary product of nitrification and denitrification processes, showed a seasonal variation in the Danube water and fluctuated in the range from 0.01 to 0.21 mg.l-1 - Fig. 2-6. The nitrites concentrations in the seepage canal were lower in comparison to the Danube water and mainly varied between 0.02 and 0.08 mg.l-1. The nitrite content at Čunovo sampling point on the Mosoni Danube was similar to that in the Danube water. At the Vének profile and in the right side river branch system were the nitrite concentrations higher in comparison to the Danube water and varied from 0.02 to 0.15 mg.l-1. Total nitrogen The total nitrogen content is predominantly affected by the fluctuation of the nitrate-nitrogen and organic-nitrogen concentrations, which results from the quantitative ratio of nitrogen forms. The tendency of fluctuations of the total nitrogen in the Danube, Mosoni Danube and in the right side river branch system was similar to each other. In comparison to the Danube water the total nitrogen content at Čunovo sampling point on the Mosoni Danube was lower, at Vének profile slightly higher. Comparing to the previous year a slight decrease of the total nitrogen values can be observed in the right side river branch system. Slight decrease of the total nitrogen content, in comparison to the previous year, can be observed in the Danube water as well. The total nitrogen concentrations in the Danube fluctuated from 1.6 to 4.4 mg.l-1, in the reservoir from 1.2 to 5,6 mg.l-1. In the right side river branch system and at Čunovo sampling point on the Mosoni Danube the concentrations varied from 1.64 to 4.96 mg.l-1, at the Vének profile from 2.4 to 5.06 mg.l-1. The lowest amount of total nitrogen was found in the seepage canal and in comparison to the previous year the amount of total nitrogen decreased as well (it varied from 0.9 to 2.5 mg.l-1). Phosphates In the hydrological year 2002 the phosphate concentrations, in comparison with the previous year again slightly decreased. In the Danube water they varied from 0.01 to 0.32 mg.l-1 (Fig 2-7), in the right side river branch system from 0.02 to 0.28 mg.l-1. The phosphates content in the Mosoni Danube at Čunovo sampling site fluctuated in the range from 0.06 to 0.25 mg.l-1; at the Vének profile the phosphates content was higher in comparison to the Danube water and varied from 0.1 to 0.8 mg.l-1. The lowest phosphate concentrations occurred in the seepage water (from 0.01 to 0.31 mg.l-1). In general higher values of orthophosphates concentrations occur during floods and in the winter period, lower values are characteristic for the vegetation period. Total phosphorus Concentration changes of the total phosphorus followed the concentration changes of phosphates. However, the impact of flood events was remarkable, since the phosphorus absorbance onto the suspended solids, which resulted in concentration increase. Exception was the seepage water, where the concentrations were low and the impact of floods was negligible. The total phosphorus concentration on all profiles, except the profile at Vének, situated on Mosoni Danube, fluctuated in the range from 0.02 to 0.26 mg.l-1 (Fig. 2-7). Total phosphorus concentrations at Vének fluctuated in the range 0.17-0.46 mg.l-1; in comparison to the previous year this represents slight increase of values. The total phosphorus content in the seepage canal fluctuated in a narrow range from 0.01 to 0.08 mg.l-1. Nutrients - summary Based on ten years observation it can be stated, that the nutrients content in the Danube water (Bratislava sampling site), after an increasing tendency during 1992-1997, continuously decreases. Decrease of nutrients content in the Bratislava section of the Danube is probably connected with decrease of pollution coming from the upper watershed of the Danube to this area. Similar situation is at the Medveďov sampling site; ammonium ions concentration in long-term decreases, phosphates and nitrites content, after a slight increase, since 1997 slightly decreases. The nitrate and total nitrogen concentration, after an increase till 1996, decreased in1997 and fluctuated without changes in 1998-2001, while in 2002 there is a slight decrease again. Since introducing the water supply the content of nutrients in the right-side river branch system mostly follows the fluctuation in the Danube. The nutrients content in the Danube water is potentially sufficient for development of eutrophic processes under other suitable conditions. 2.4. Oxygen and organic carbon regime parametersDissolved oxygen In the hydrological year 2002 the dissolved oxygen concentration in the Danube water varied from 7.4 to 12.8 mg.l-1, at sampling points in the reservoir up to 13.6 mg.l-1, maximal value occurred at site No. 308 – 18 mg.l-1. Fluctuation of the dissolved oxygen content at selected profiles is documented on Fig. 2-8. Generally higher values occur in winter period, while the lower values occur in the summer. The dissolved oxygen content proportionally decreased with increasing water temperature in the Danube. Besides this the dissolved oxygen content depends on the assimilation activity of phytoplankton. In the right-side river branch system due to the continuous water supply the dissolved oxygen content follow the course of dissolved oxygen values in the Danube river. The concentrations fluctuated in the range from 7.2 to 13 mg.l-1. The oxygen concentrations in the Mosoni Danube at Čunovo sampling point varied from 8.26 to 12.35 mg.l-1; at the Vének profile, similarly to the previous year, the oxygen content was slightly higher in comparison to the long-term values and fluctuated from 6.3 to 12.63 mg.l-1. Critical oxygen deficient conditions in the Mosoni Danube did not occurred during the evaluated period. The oxygen content in the seepage canal fluctuated from 5 to 12 mg.l-1. CODMn and BOD5 COD and BOD parameters are used for expressing the organic contamination of the water, they indicate the chemically and biologically degradable organic matter content. In the hydrological year 2002 the COD values at all measured profiles fluctuated from 1.4 to 6 mg.l-1. Higher value was measured in one occasion at Bratislava sampling site (No. 109), when during the flood in August it reached 9.1 mg.l-1. The COD values in the right side river branch system were slightly lower in comparison to the Danube water and fluctuated from 1.2 to 4.8 mg.l-1. The maximum value at Helena profile was measured in October (9.9 mg.l-1), at Szigeti river arm in August (7.2 mg.l-1). The BOD values of the Danube water fluctuated in the range from 1 to 3.5 mg.l-1 (Fig. 2-9). The BOD values in the right side river branch system were mostly higher in comparison to the Danube water and varied in the range from 0.44 to 3.67 mg.l-1, with one extreme value at Helena (7.26 mg.l-1). The organic matter content in the seepage canal is low in long term and in 2002 fluctuated from 1.2 to 3.6 mg.l-1; BOD varied from 0.8 to 2.11 mg.l-1. In the Mosoni Danube at Čunovo sampling point the COD values varied in the range from 2.15 to 4.9 mg.l-1 and the BOD values varied from 1.37 to 3.75 mg.l-1. At the Vének profile were the COD and BOD values, similarly to the values in previous years, higher because of the partially treated wastewater from the Győr (COD 3-7.5 mg.l-1, BOD 2.08-7.05 mg.l-1). Higher COD and BOD values usually occur in periods with increased flow rates in the Danube, when the water contain higher amount of natural organic matter. Oxygen and organic carbon regime parameters - summary During the hydrological year 2002 the dissolved oxygen contents were usually favourable and generally the organic carbon content was small. The oxygen and organic carbon related parameters in the Danube reflect the seasonal assimilation activity of the phytoplankton and organic carbon oxidation processes. The measured data (1992-2000) indicate decreasing tendency of organic load at the Bratislava section of the Danube, which is related to the substantial wastewater treatment improvement in the upstream Danubian countries. In the years 2001-2002 increase of CODMn values was recorded at Bratislava and Medveďov sampling sites. Higher values of oxygen regime parameters (CODMn, BOD5) occur in period of higher flow rates in the Danube. The oxygen regime parameters at Vének are influenced by local pollution (pollution originating from city Győr) together with hydrological conditions at confluence with the Danube, however in 2002 no critical oxygen deficiency occurred in the Mosoni Danube downstream of Győr. 2.5. MetalsIron The amount of suspended solids influences the iron content in the surface water. The mutual coherence of iron concentrations and suspended solids content in surface water is documented by the highest concentrations of iron measured at the time of highest suspended solids content. In 2002 the iron concentrations on all measured sites on the Danube fluctuated mainly up to 0.75 mg.l-1, in two occasions reached the value of 1.11 mg.l-1 at Bratislava. The iron concentrations in the right side river branch system mostly fluctuated up to 0.3 mg.l-1. From June to September the iron content varied in the range from 0.3 to 1.11 mg.l-1. The iron concentration in the seepage water fluctuated in narrower range from 0.05 to 0.19 mg.l-1. In the Mosoni Danube at Čunovo sampling site the iron content varied in the range from 0.2 to 0.5 mg.l-1. At Vének profile is the iron content always higher due to the character of catchment’s area (the water in the Rába river is rich in iron). In hydrological year 2002 was the iron content similar as in the Danube water; it fluctuated from 0.12 to 0.69 mg.l-1, with one extreme value at the beginning of September – 2.05 mg.l-1. Manganese Manganese, similarly to iron, occurs in surface water mainly in solid phase. The manganese concentrations in the Danube water mostly fluctuated in the range up to 0.08 mg.l-1, at Bratislava sampling site one value of 0.13 mg.l-1 occurred in August. The manganese concentrations on the Mosoni Danube at Čunovo sampling point fluctuated in a narrow range up to 0.05 mg.l-1. At the Vének profile, in comparison to the previous year three extreme values occurred, while the remaining values ranged up to 0.1 mg.l-1. In the right side river branch system and in the seepage canal at Čunovo low concentrations were measured up to 0.1 mg.l-1, with one higher value at the Szigeti arm (0.14 mg.l-1). In the left side seepage canal the manganese content ranged up to 0.3 mg.l-1. Heavy metals The heavy metals concentrations in hydrological year 2002 usually fluctuated in the range of limits corresponding to the I. class of surface water quality. The mercury content ranged at the detection limit value (0.1 mg.l-1), while one value at Bratislava reached the value of 1.1 mg.l-1, which correspond to the V. water quality class. The other heavy metals concentrations fluctuated within the I. water quality class. 2.6. Biological and microbiological parametersColiform bacteria The surface water bacteriological pollution can be determined by the number of Coliform bacteria. In the year 2002 the number of Coliform bacteria at Bratislava profile (No. 109) fluctuated in the range from 10 to 1000 NrC.ml-1, which represents slight increase in comparison to the previous year. The Coliform bacteria values at Rajka and Medveďov profile follow the fluctuation of values at Bratislava profile, while the number of Coliform bacteria were in long run lower comparing to the Bratislava sampling site. The bacteriological pollution, documented by the number of Coliform bacteria, at Medveďov profile in the main riverbed is lower comparing to the Rajka profile. The bacteriological pollution in the river arm system is lower in comparison to the Danube water and fluctuated in the range from 2.3 to 160 NrC.ml-1. Similarly to the previous year along the flow path in the right side river branch system some improvement was observed in microbiological parameters downstream of influent section. The bacteriological pollution at the Čunovo sampling site on the Mosoni Danube varied in the range from 10 to 270 NrC.ml-1, at the Vének profile fluctuated in the range from 110 to 5400 NrC.ml-1 due to the partially treated municipal wastewater discharge. The seepage canal can be considered as the cleanest from the bacteriological point of view, the number of bacteria range up to 46.5 NrC.ml-1. Chlorophyll-a The chlorophyll-a concentrations refer to the quantity of phytoplankton and provide information about the eutrophic state of water. The growth of algae on the respective section of the river is represented by the relative increase of chlorophyll-a concentration between two compared profiles. According to the observations in the Danube in 2002 the spring algae growth maximum, similarly to the previous year, occurred during the April and May, when values reached 50 mg.m-3 (Bratislava sampling site). In the following period the chlorophyll-a concentration decreased and the flood in August eliminated the potential summer culmination (Fig. 2-10). The situation in the right side river branch system was similar to the situation in the Danube water; the chlorophyll-a concentrations were similar as well. The situation in the Mosoni Danube at Čunovo sampling site was similar to that in the Danube water, while at the Vének profile two culminations was detected, the first in May (138.5 mg.m-3) and the second at the end of July and beginning of August (88.8 mg.m-3). The chlorophyll-a concentration in the seepage water remained low and fluctuated mainly from 1 to 11.5 mg.m-3. The highest values were measured during the spring algae growth in May, when the chlorophyll-a concentrations reached 11.5 mg.m-3. Saprobic index The saprobic index represents the self-purification ability of the water, the ability to degrade the organic pollution. The saprobic index in relation to the respective stretch of the river represents also the water quality in the river. Based on the measured data the saprobic index values in the influenced area fluctuate in the range from 1.78 to 2.65, which correspond to beta-mezosaprobic state. These values of saprobic index are typical for this stretch of the river. The self-purification processes, at this level of the saprobic index, run mainly as oxidising processes. Time series data of saprobic index indicate the slightly decreasing tendency during the last ten years. The saprobic index in the right side river branch system varied from 2.27 to 2.69, which correspond to alpha-beta mezosaprobic state. The saprobic index in the Mosoni Danube at Vének profile fluctuated from 2.55 to 2.82, which correspond to alpha-mezosaprobity. Other biological parameters The observations of the phytoplankton abundance and the determination of the number of algae, the number of zooplankton and the macrozoobenthos according to the Agreement are performed four times in the year. Phytoplankton Minimal values of the phytoplankton abundance were recorded during the autumn and winter period, while the maximal values occurred in the spring. According to the recorded data along the longitudinal profile from Bratislava to Komárno continuous increase of the trophic status in the Danube water is evident, similarly to the previous years. The species diversity in 2002 was rich. The Diatoms were dominant (families Achnantes, Amphora, Asterionella, Aulacoseira, Caloneis, Cocconeis, Cyclostephanos, Cyclotelle, Cymatopleura, Cymbella, Diatoma, Fragillaria, Gomphonema, Gyrosima, Hantzschia, Melosira, Naviculla, Nitzschia Rhoicosphoenia, Skeletonema, Stephanodiscus, Surirella). In the summer period number of green algae taxons increased (Desmidiales, Euglenophyta, Chlorococcales, Ulotrichales). During the spring period other algae groups were frequent as well (Cryptophyta, Chrysophycaeca, Volvocales). More intensive algae growth in the right side river branch system was observed along the main river branch between the Szigeti and Ásványi arm only during March. The population densities were higher in comparison to the previous years, especially due to the climatic conditions – in the vegetation period high temperatures and low flow rates were characteristic. Maximal values mostly occurred in May and the abundance of phytoplankton varied from 7062 NrC.ml-1 (Bratislava sampling site) to 20000 NrC.ml-1 (Medveďov). At Vének profile on the Mosoni Danube the maximum value reached 45793 NrC.ml-1. The water in the seepage canal was relatively poor in algae; the maximum value reached 6600 NrC.ml-1. Zooplankton In the year 2002 similar composition of Rotatoria and Crustacea groups occurred in the Danube as in the previous year. The number of species (60) and abundance was higher in the Rotatoria group, while the Crustacea were represented by lower species diversity (Copepods – 11, Cladocera - 31). The species numbers in Crustacea groups were slightly higher in comparison to the previous year. Rare species, similarly to the previous year, occurred in the year 2002 as well (e.g. Polyphemus pediculus, Camptocerus restrirostris, Eurycercus lamellatus). The abundance in the longitudinal profile from Bratislava to Komárno slightly increased, similarly to the previous year, and the recorded maximal values were higher. In the right side river branch system the zooplankton populations with high density occurred more rarely than in the previous year. The abundance is low at places where the flow velocity is high due to the temporary water supply. The only exception is the Ásványi river branch, where abundant community was created. The abundance and the seasonal dynamics were similar to that recorded in the previous years. The number of individuals in the seepage water shows continuous slight decrease in the last 2-3 years. In comparison to the previous year the maximum values in the seepage water were significantly lower. No huge spreading of thermophilous Rotifera and Nauplius larvae, living in eutrophic waters, has occurred. However, several rare species of Cladocera group were recorded (Polyphemus pediculus, Camptocerus restrirostris, Eurycercus lamellatus). In the Mosoni Danube at the Vének profile the abundance values peaked from March to August, however the abundance throughout the year was balanced again. Macrozoobenthon At the observed sampling points in the Danube 73 taxons were found, which give evidence of higher species richness of macrozoobenthon than in the previous year. At the Bratislava sampling site increase of diversity was detected (18 taxons). Along with the common Danube species (Dina punctata, Ancylus fluviatilis, Hydropsyche family of Trichoptera) mass growth of pontocaspic species were found (Dikerogammarus family of Crustacea, Pontogammarus obesus, Corphium curvispinum). In contrast to the previous year no rheophile larvae of Trichoptera Brachycentrus subnubilus, Crustacea Limnomysis benedeni, and Molluscs Theodoxus fluviatilis and Theodoxus danubialis were found. The Rajka sampling site in spite of significant flow rate fluctuation was rich in species (22 taxons), and in comparison to the other sampling sites higher amount of Bivalves, Gastropods, Hirudinea, Oligochaeta and Chironomidae was found. At the Medveďov sampling site 20 taxons were found, from which the Crustaceans and Gastropods were the most multifarious. Only at Komárno sampling site was the number of taxons lower in comparison to the previous year. No Hirudinea were found, vice versa Oligochaeta were richer in species. The species Theodoxus danubialis was recorded, while the Fagotia family absented. No Trichoptera were found at all, and the Ephemeroptera were represented by Caenis moesta (luctuosa) species. The results of saprobic index of the Danube water in the longitudinal profile from Bratislava to Komárno correspond to the beta-mezosaprobic state, which is typical for this stretch of the river. Average values of saprobic index in 2002 varied from 2.08 (at Bratislava) to 2.20 (at Medveďov). The minimal value was recorded at Komárno sampling site (2.04), the maximal value at Dobrohošť (2.26). In the right side river branch system in the inundation area various rheophile communities of molluscs, crustaceans and insects were observed. These communities are slowly enriched by species of slowly flowing water bodies, especially in the side arms, where several not previously registered species of insects are gradually recorded (Hydroptyla occulta, Hydropsyche incognita). Common presence of rheophile species and species of stagnant water shows that the water supplied to the flood plain become gradually richer and diverse habitat. The invertebrate communities in the longitudinal profile of the Mosoni Danube developed similarly to the previous year. Typical species of the upper stretch of the river were recorded (e.g. Theodoxus danubialis, Obesogammarus obesus and Aphelocheirus aestivalis). The rest of the species commonly occurred without special connection to the respective stretch of the river. At the Vének sampling site widespread species with wide tolerance were found only. In the mud along the shoreline large number of Oligochatea and Hypania invalida were observed. Periphyton Based on the obtained results it can be stated that the saprobic indexes of periphyton on every sampling point in the Danube in 2002 varied in the range of better beta-mezosaprobic state. The saprobic index of periphyton ranged from 1.63 (at Dobrohošť) to 2.1 (at Rajka). The range of values was wider than in the previous year. According to the species diversity of the periphyton the Diatoms (Diatoma, Melosira, Cymbella, etc.), Chlorophyta (Uhlotrix, Cladophora) and Cyanophyta (Phormidium) dominated on every sampling point. The families of Aulacoseira, Cyclotella, Cyclostephanos, Stephanodiscus and Thalassiosira, families of Fragilariaceae group (Diatoma, Fragilaria) as well as the families of Achnanthaceae group (Achanathes, Cocconeis) were frequent, but the most frequent were the families of the Naviculaceae group (Amphora, Cymbella, Cymatopleura, Surirella, Gomphonema, Naviculla, Rhoicosphaenia) and Bacillariaceae group (Nitzschia). The Cyanophyta were sparse, from among the Lyngbyia martesiana, Leptolyngbyia boryana and Phormidium retzii species and species of the Rhizoclonium family were detected. 2.7. Quality of sedimentsSampling of riverbed sediments in the frame of joint Slovak-Hungarian monitoring had been performed in May 2002 by the Hungarian Party and in October by the Slovak Party (Fig. 2-11). Inorganic and organic micro components were analysed and the content of total phosphorus and nitrogen was also determined. Similarly to previous years the “Canadian list” was used for evaluation. This standard distinguishes three levels of pollution: level without pollution, the lowest pollution level and the severe pollution level. From among the inorganic micro-pollutants seven heavy metal components (Zn, Hg, Cd, Cr, Ni, Pb, and Cu) were analysed. According to the results it can be concluded that in 2002, similarly to the previous years, the pollution by heavy metals did not reach the “severe pollution level” at any of the sampling sites. There were places where the concentrations of heavy metals, except the mercury and cadmium, were higher than the respective limit values for the “lowest pollution level”. The zinc concentrations over the limit value (120 mg.kg-1) were detected in sediments from the Ásványi river arm and at the Vének profile on the Mosoni Danube. The copper concentration was higher than the limit value (16 mg.kg-1) at all observed sampling sites, except the sites at Rajka, Medveďov and seepage canals. The chromium concentration was higher than the lowest pollution level (26 mg.kg-1) at Vének profile only. The lead concentration was higher than the lowest pollution level (31 mg.kg-1) in the Ásványi river branch. Slightly higher concentrations of nickel were recorded at the both sampling site on the Mosoni Danube and at Helena weir in the river branch system. According to the above mentioned results it can be stated that the highest accumulation of heavy metals was recorded at the Vének profile on the Mosoni Danube and the lowest concentrations were observed in the Danube main riverbed and in the seepage canal. From among the organic micro pollutants the polychlorinated biphenyls (PCB) and polynuclear aromatic hydrocarbons (PAH) were analysed. The sum of PCB’s was determined by analyses of 8 isomeric compounds. The sum of PAH’s was determined by 16 polyaromatic hydrocarbon components. According to the obtained results it can be stated that the PCB and PAH contamination did not exceed the respective limits for the “lowest pollution level”, in case of PCB 70 mg.kg-1, in case of PAH 2000 mg.kg-1. The total phosphorus content in sediments slightly exceeded the limit value of “lowest pollution level” (600 mg.kg-1) at all sampling sites apart from the sampling sites at Rajka and in the seepage canal. The total nitrogen content in sediments exceeded the limit value of “lowest pollution level” (600 mg.kg-1) on all sampling points. Moreover, the total nitrogen contents exceeded the “serious pollution level” (4800 mg.kg-1) as well, except the sampling sites in the Danube main riverbed and at Čunovo sampling site on the Mosoni Danube. 2.8. Differences in the data measured by the Slovak and Hungarian PartiesThis chapter was intended to show what results were reached in elimination of the differences in the data measured by the Hungarian and Slovak Party. Unfortunately, the Hungarian side provided no national data from the sampling sites where joint measurements are performed, so the evaluation of effectiveness of applied measures cannot be done. The unified data of the Transboundary water commission usually represent the average value of the so called national data, obtained by the Parties themselves at the same sampling points sampled at the same time. Based on the mutual comparison of the Slovak national data and the so-called unified data it was partly possible to follow the development of the reliability of joint measurements. It is evident, that measurements of some parameters got better (e.g. the oxygen values already follow the same tendency, and in most cases the values are similar). Into the next group of parameters belong parameters where, apart from 3-4 occasions, the course of the data follows the same tendency (e.g. pH, dissolved solids, ammonium ions, nitrites, total nitrogen, phosphates and COD). However, there are also parameters, where the differences are more significant, or more frequent, or even systematic (e.g. sulphates, chlorides, BOD, total phosphorus, heavy metals, saprobic index). Some of the above mentioned parameters are presented in the attached figures. In case that the measures would be effective the joint evaluation should be based on so called unified data of the Trans-boundary water commission. 2.9. ConclusionsIncreased or decreased values of some parameters in the Danube, seen from the long-term evaluation, were already observed at Bratislava profile (109) where the water quality of the Danube generally improved. This influences the surface water quality in the territory influenced by temporary measures, realised according to the Agreement. The hydrological year 2002 was different from the previous hydrological year in two flood events. Fluctuation of individual parameters characterising the surface water quality in the right-side river branch system, due to the continuous water supply since 1995, was in most cases artificially modified, and follows their fluctuation in the Danube water. The tributaries and local pollution of settlements besides the water supply influence form the water quality in the Mosoni Danube. Before the confluence with the Danube the water quality state is labile (variable in time), which is proved by unfavourable values of some parameters (coliform bacteria, BOD, nitrates, total phosphorus sulphates and saprobic index), while in parameters characterising the oxygen regime, dissolved solids, iron concentration and COD improvement can be observed. In the following table Tab. 2-3, classification of the individual sampling sites into the quality groups was done according to the trans-boundary water quality criteria. Table 2-3: Classification of parameters or group of parameters according to the agreed limits for surface water quality classification
The quality class is determined according to the 90% of measured values. The given classification does not distinguish in what conditions were the respective values recorded (e.g. extreme values during floods or high flow rate conditions, oscillation of parameters). The given classification gives only comparison of the water quality inflowing to the influenced area (sampling site at Bratislava) and the water quality leaving the system (sampling site at Medveďov). The classification of the sampling sites in the Danube old riverbed and sampling sites on the Mosoni Danube, right side river branch system and in the seepage canal were done in similar way.
|
||||||||||||||||||||||||||||||||||||||||||||||||||||||||||||||||||||||||||||||||||||||||||||||||||||||||||||||||||||||||||||||||||||||||||||||||||||||||||||||||||||||||||||||||||||||||||||||||||||||||||||||||||||||||||||||||||||||||||||||||||||||||||||||||||||||||||||||||||||||||||||||||||||||||||||||||||||||||||||||||||||||||||||||||||||||||||||||||||||||||||||||||||||||||||||||||||||||||||||||||||||||||||||||||||||||||||||||||||||||||||||||||||||||||||||||||||||||||||||||||||||||||||||||||||||||||||||||||||||||||||||||||||||||||||||||||||||||||||||||||||||||||||||||||||||||||||||||||||||||||||||||||||||||||||||||||||||||||||||||||||||||||||||||||||||||||||||||||||||||||||||||||||||||||||||||||||||||