PART 1
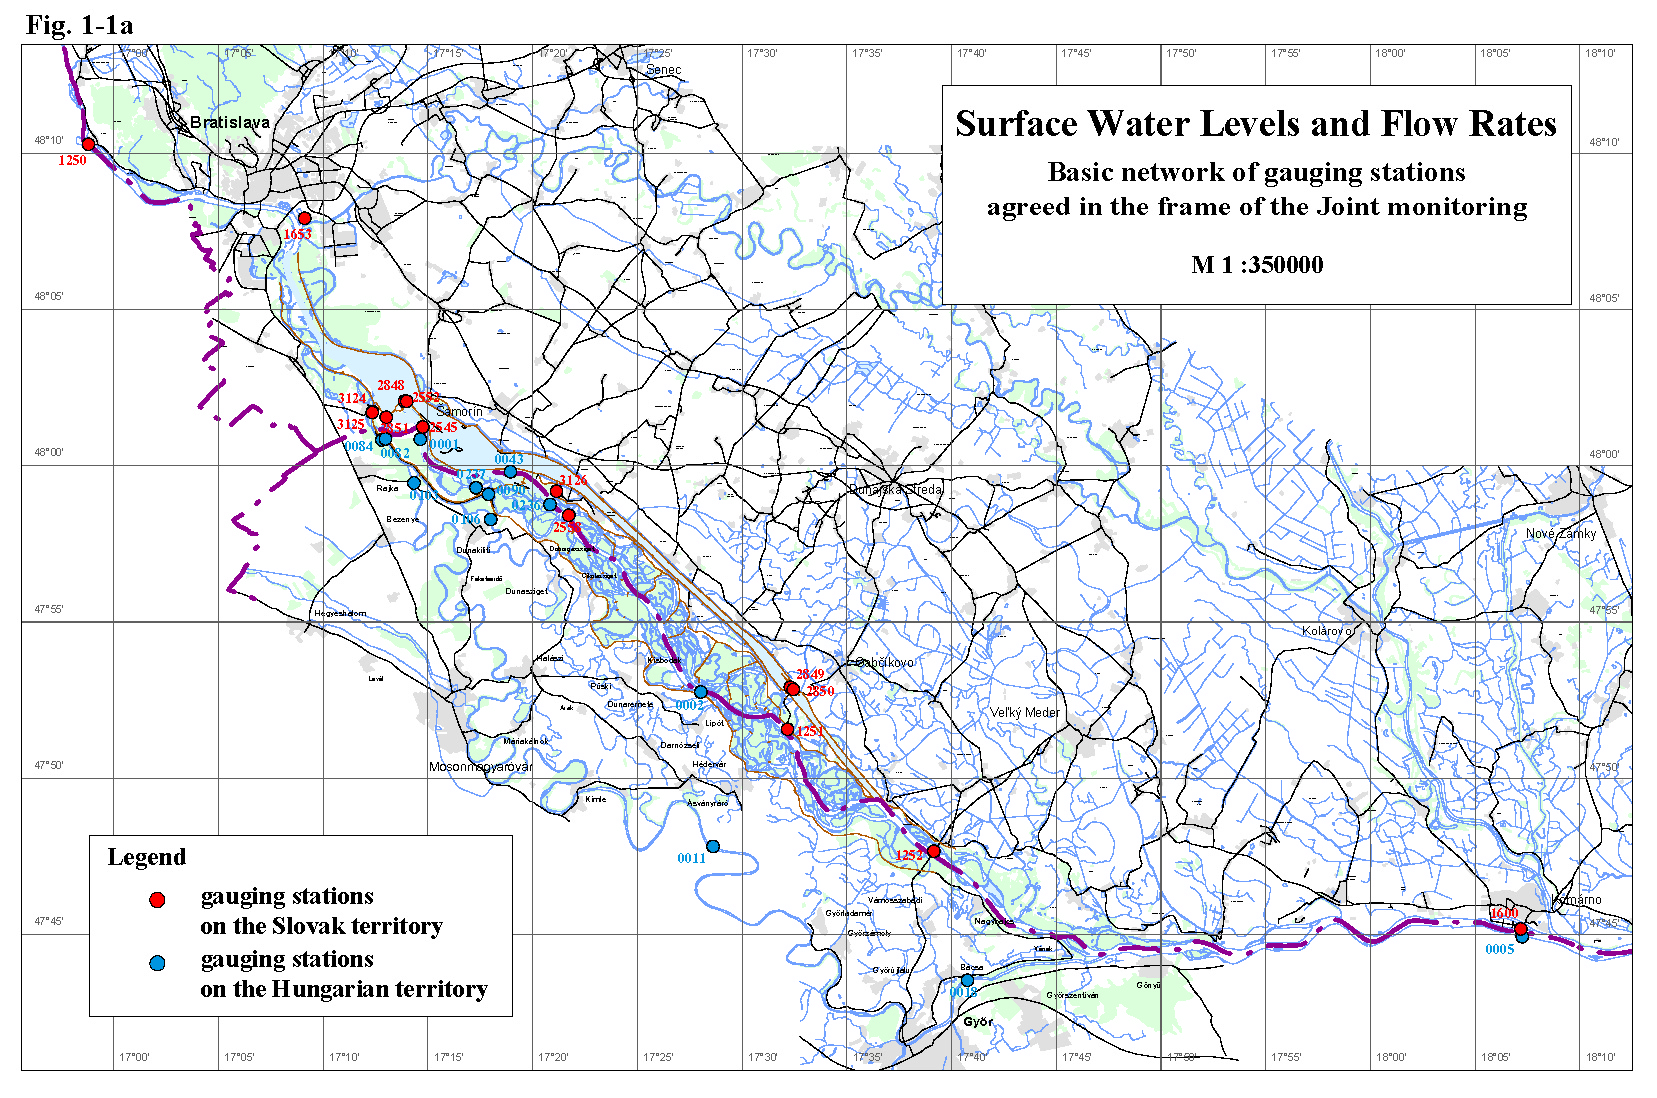
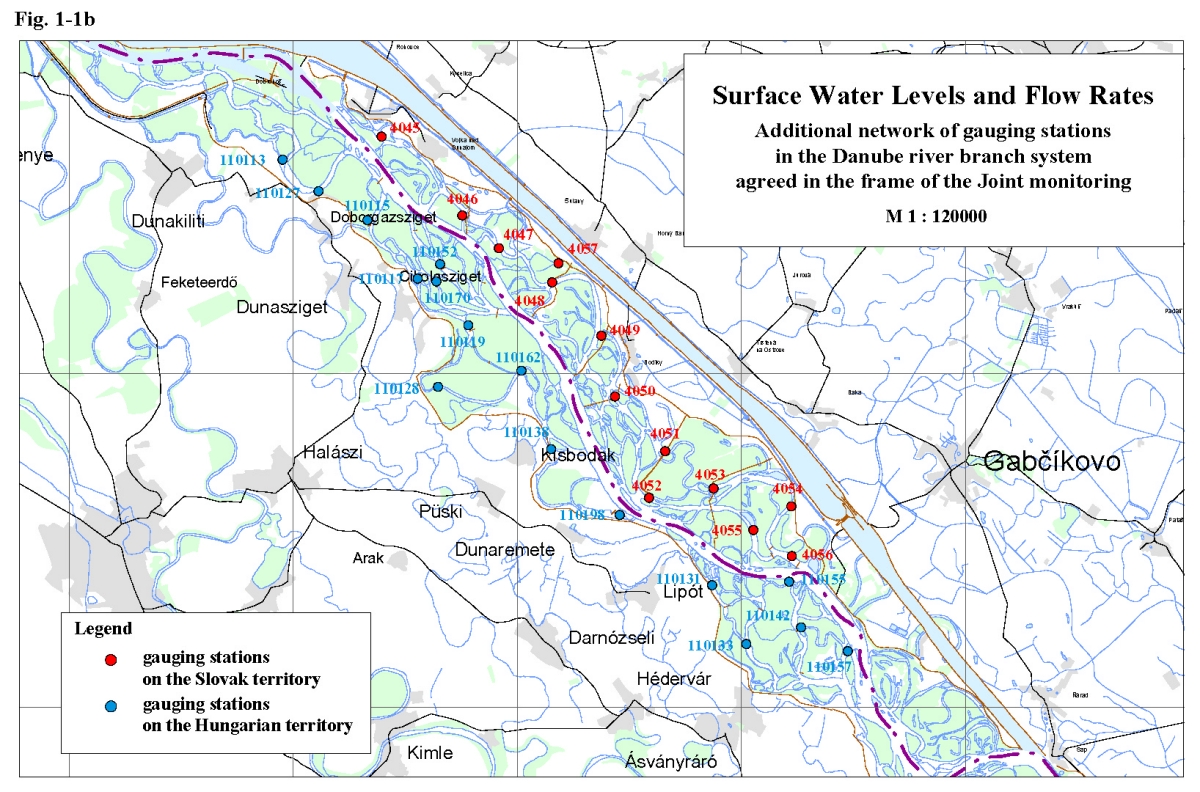
Surface water levels and dischargesIn the hydrological year 2002 there were field observations performed in the Slovak and Hungarian inundation area. During the field observations the river branch water level monitoring systems were documented. Based on the field observation 13 gauging stations in the Slovak inundation area and 16 gauging stations in the Hungarian inundation area were added to the surface water observation network. So the observations in 2002 were carried out on 28 gauging stations on the Slovak side and 29 gauging stations on the Hungarian side (Tab. 1-1). The situation of observation network is shown on Fig. 1-1a and Fig. 1-1b. In the intergovernmental Agreement the Parties have undertaken mutually exchange of data from agreed gauging stations. Joint measurements helped the joint evaluation of discharges flowing into the Danube downstream of the Čunovo dam and into the Mosoni branch of the Danube. Based on mutual evaluation of joint measurements agreed time series data were accepted. These data create the basis for joint evaluation of measures and water supply realised according to Articles 1-3 of the Agreement. Table 1-1: List of gauging stations
In the frame of the intergovernmental Agreement, signed on April 19, 1995, a temporary water management regime was set up. It was agreed that in the case of average annual flow rate of 2025 m3s-1 at Bratislava-Devín the annual average of 400 m3s-1 should be discharged into the Danube downstream of Čunovo. The daily amount of water is governed by the flow rate reaching the Bratislava-Devín profile, taking into consideration rules of operation described in the Annex 2 of the Agreement. The flow rate in vegetation period, depending on hydrological conditions, should fluctuate from 400 to 600 m3s-1; in the non-vegetation period the flow rate should not be less than 250 m3s-1. In case of floods the amount of water above 600 m3s-1 discharged through the inundation weir is not taken into consideration when the annual average is calculated. However, the term “flood” for the purpose of annual average discharge calculation was not set yet. Additional 43 m3s-1 of water was agreed in the Agreement to be discharged into the Mosoni branch of the Danube and the right side seepage canal. The gauging station Bratislava-Devín plays the key role in determination of water amount discharged into the Danube downstream of Čunovo. The yearly minimum flow rate occurred on November 6, 2001, when the flow rate was 1040 m3s-1, the yearly maximum flow rate occurred on August 16, 2002, when it reached 10390 m3s-1 (daily average maximum flow rate was 10180 m3s-1). The average annual flow rate in this station in the hydrological year 2002 was 2458.40 m3s-1, which is higher than the average flow rate considered in the intergovernmental Agreement (Tab. 1-2). Comparing the average annual flow rate at station No. 1250 with the average annual flow rates in previous years it can be stated that the average annual flow rate in 2002 was the second highest average annual flow rate since 1995. Table 1-2: Average annual flow rates
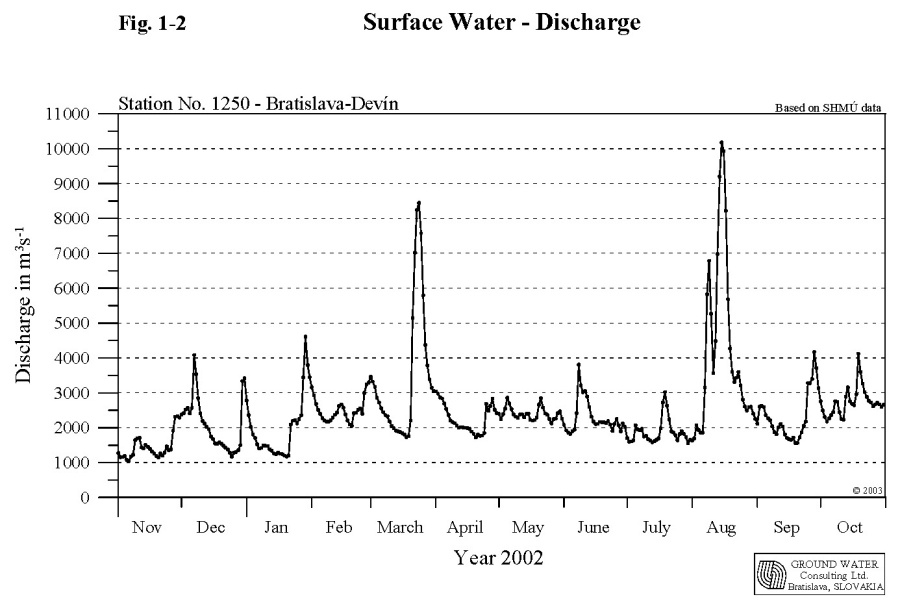
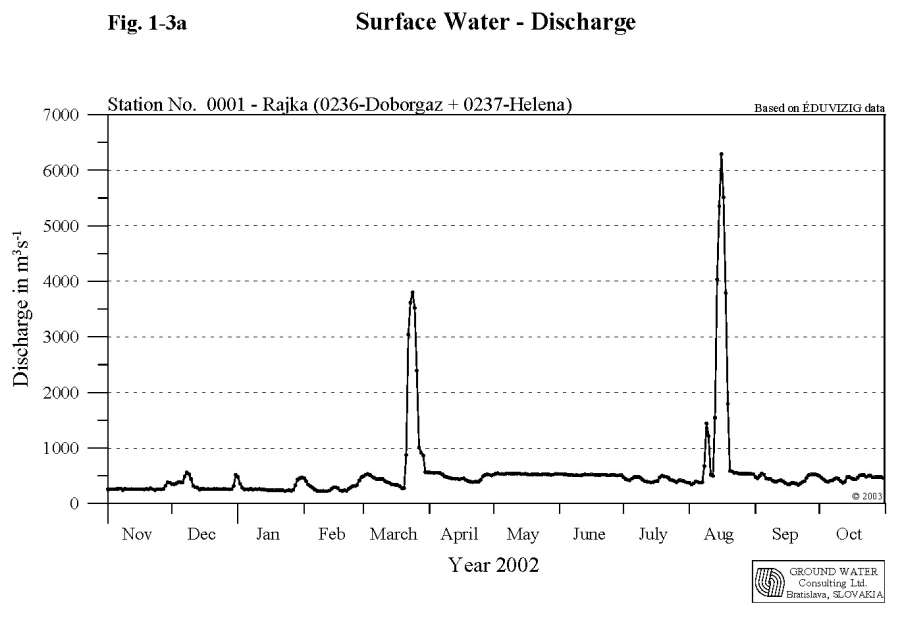
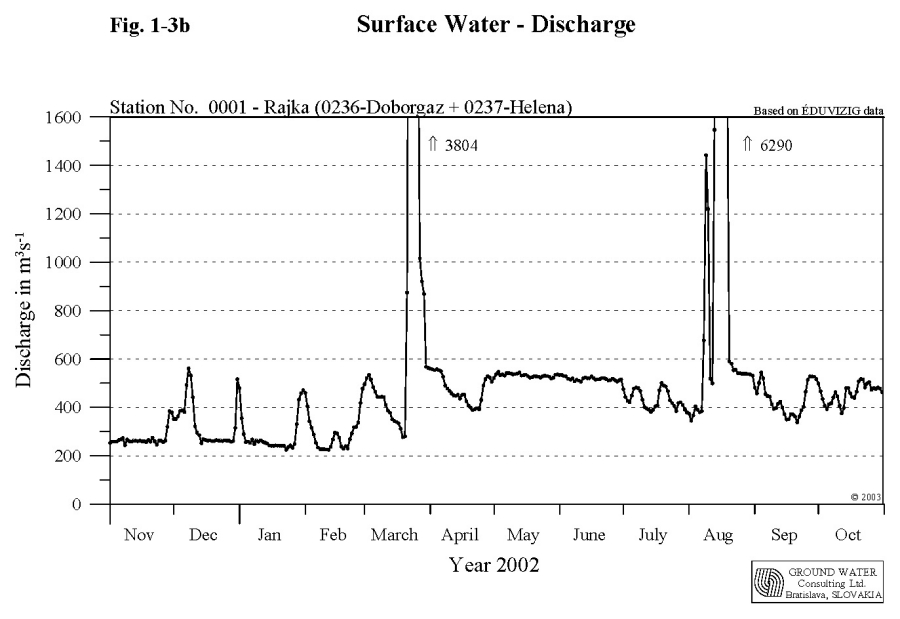
Low flow rates in the Danube during the hydrological year 2002 occurred in November 2001, at the end of December 2001 and in January 2002. The lowest average daily flow rate at station No. 1250 – Bratislava-Devín occurred at November 6, 2001, when it reached the value of 1040 m3s-1. However, due to the higher precipitation and in January due to high temperatures as well, flow rates over 3000 m3s-1 four times occurred in the winter period. Due to heavy rains in the Danube catchment’s area significant flood occurred at the end of March 2002, when the flow rate in the Bratislava-Devín gauging station culminated at 8628 m3s-1 (average daily flow rate was 8450 m3s-1). Flow rates in May, June and July 2002 fluctuated mainly from 2900 to app. 1500 m3s-1. Considering the monthly average flow rates this period can be characterised as a dry period. At the end of first decade of August heavy rains in the Austrian and German Danube catchment’s area evoked two flood waves, from which the second flood immediately followed the first one. The culmination of the first flood in station No. 1250 – Bratislava-Devín occurred on 9th August and the flow rate reached app. 7000 m3s-1. The second flood culminated on 16th August and the flow rate was 10390 m3s-1 (average daily flow rate was 10180 m3s-1). This flood situation was extraordinary from hydrological as well as historical point of view; its return period is once in 50-100 years. The flow rate at gauging stations No. 1252 – Medveďov and No. 1600 – Komárno reached values with the return period once in 100 years (9240 m3s-1 respectively 8940 m3s-1). After the flood the flow rate continuously decreased, however till end of the hydrological year the flow rate arose over 4000 m3s-1 two more times. Based on abovementioned facts it can be stated that the flow rates in the hydrological year 2002 reached extraordinary values. The annual average flow rate was 2458.40 m3s-1. The course of flow rates during the hydrological year 2002 at gauging station No. 1250 - Bratislava-Devín is shown in Fig. 1-2. 1.1. Discharge into the Danube downstream of ČunovoThe determination of the average daily amount of water discharged into the Danube downstream of Čunovo was based on average daily flow rates determined at stations Doborgaz and Helena (Fig. 1-3a, Fig. 1-3b). The monthly characteristics of the daily average flow rates into the Danube in the hydrological year 2002 were as follows:
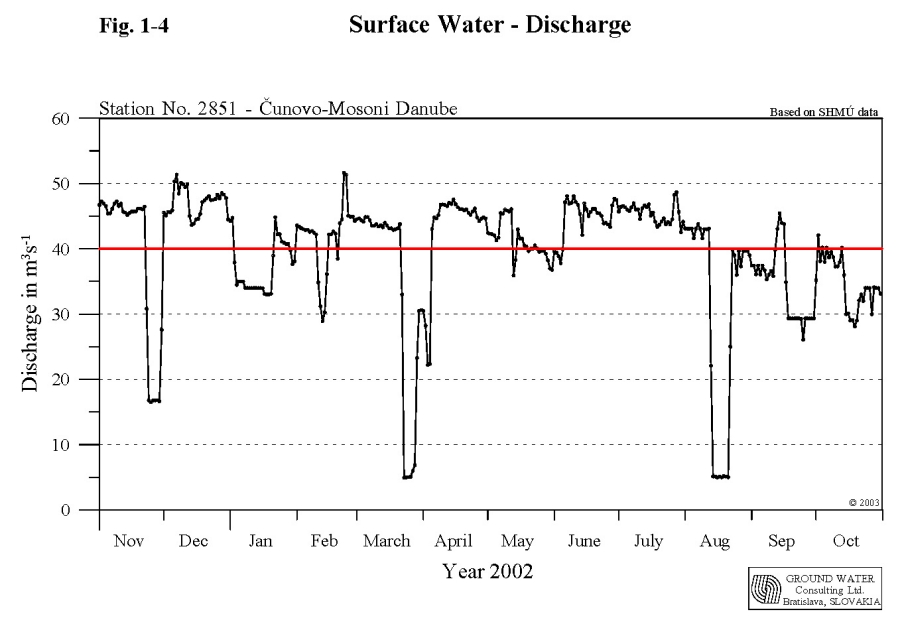
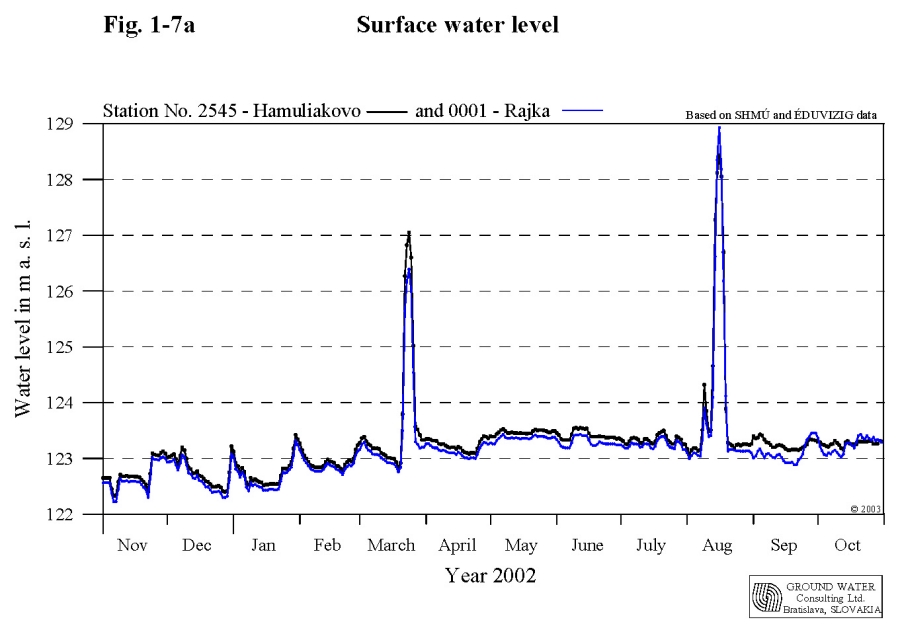
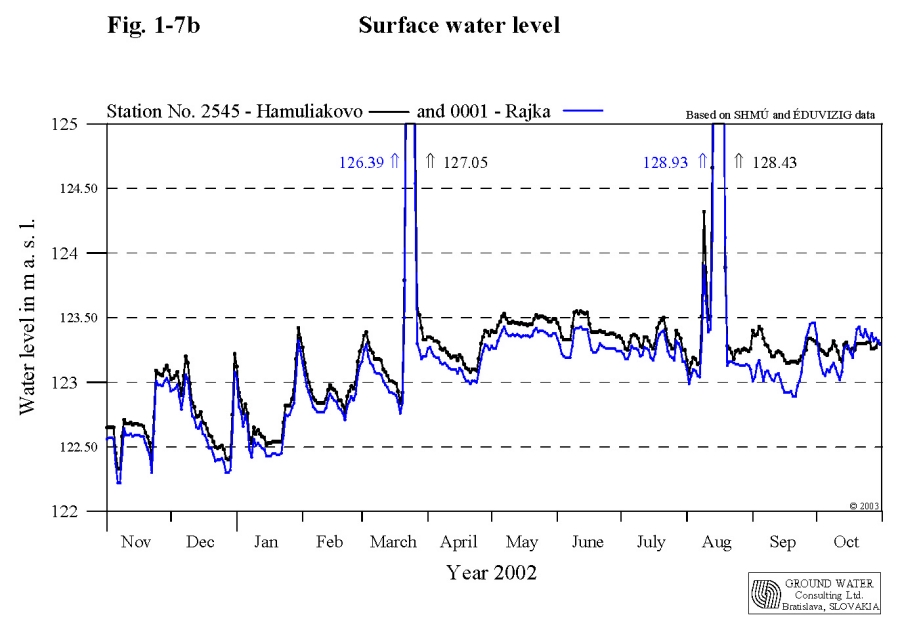
The average annual flow rate in the Danube at Bratislava-Devín profile in the hydrological year 2002 was 2458.40 m3s-1. Taking into consideration obligations envisaged in the intergovernmental Agreement the Slovak Party was obliged to release an average annual discharge of 485.61 m3.s-1 into the Danube riverbed downstream of Čunovo. The total average annual discharge released to the Danube downstream of Čunovo was 530.13 m3s-1. During the hydrological year 2002 two big flood events occurred, so it was necessary to release higher amount of water into the riverbed downstream of Čunovo. The first flood event occurred at the end of March 2002, when discharge over 600 m3s-1 was released into the Danube old riverbed for 9 days. The maximum flow rate at the station No. 0001 – Rajka occurred on 24th March 2002 and reached the value of 3804 m3s-1. The second flood event occurred in the middle of August 2002. At this occasion discharge over 600 m3s-1 was released into the Danube old riverbed for 10 days. The maximum flow rate at Rajka occurred on 16th August 2002, and reached the value of 6590 m3s-1. When subtracting the amount over 600 m3s-1 released during the flood events (19 values) the average annual flow rate of 419.66 m3s-1 is obtained. When evaluating the amount of water discharged to the Danube old riverbed, it can be stated that Slovak Party fulfilled the average annual discharge jointly agreed in the intergovernmental Agreement. Taking into consideration the minimal values prescribed in the Agreement (in the winter period not less than 250 m3s-1, in the vegetation period at least 400 m3s-1) it can be stated that the minimal daily average discharges in the winter period were lower during several days than the prescribed value in January and February 2002. The minimal daily average discharges in the summer period, except of few occasions (in April, in July and August), was satisfied. 1.2. Discharge into the Mosoni branch of the Danube The discharge into the Mosoni branch of the Danube according to the intergovernmental Agreement should be 43 m3s-1, which is composed by the discharge released to the Mosoni branch of the Danube through the intake structure at Čunovo and the discharge through the seepage canal. Discharge measurements are carried out downstream of the intake structure on the Slovak territory at 0.160 rkm and upstream of lock No. I on the Hungarian territory. The average daily discharges were agreed after the joint evaluation of joint discharge measurements performed at both profiles. In the evaluation the data measured just downstream of the intake structure were considered (Fig. 1-4). The monthly characteristics of the amount of water released into the Mosoni Danube through the intake at Čunovo in the hydrological year 2002 were as follows:
The average annual discharge was 39.5 m3s-1. The flow rate in the right side seepage canal was measured at two sites as well. The first is on the Slovak territory at Čunovo; the second is placed on the Hungarian territory at lock No. II. In the evaluation the data observed at lock No. II were considered. The monthly characteristics of the flow rates recorded at lock No. II were as follows:
The average annual flow rate was 1.93 m3s-1. There was a continuous slow decrease of discharge observed in the seepage canal during previous years, so the hydrological conditions did not allowed continuous releasing of 3 m3s-1, which are envisaged in the Agreement. However, after the flood in March 2002 significant increase of seepage water amount can be observed. The increase of flow rate in the seepage canal is related with fine sediments erosion from the reservoir bottom during the flood. The monthly characteristics of the total flow rate released into the Mosoni Danube, consisting of the amount of water released by the intake structure at Čunovo and amount of water in the right side seepage canal were as follows:
The total average annual flow rate was 41.42 m3s-1. Taking into consideration the hydrological circumstances for discharging water into the Mosoni Danube during the flood periods in March and in August 2002 (23-28.3.2002, 13-22.8.2002, from August 16 to August 22 was the intake structure at Čunovo even closed) only, the total average annual flow rate was 42.75 m3s-1. Based on the evaluation it can be stated that the average annual discharge into the Mosoni Danube envisaged in the Agreement was fulfilled. 1.3. Water distribution on the Hungarian territory The goal of the water distribution on the Hungarian side is to provide continuous water supply into the inundation area, into the river branches on the flood-protected area and into the Mosoni Danube. 1.3.1. Water supply into the inundation area The inundation area on the Hungarian side can be supplied by water from two sources: a.) Through two openings in the Danube riverbank, by manipulating the water level increased by the submerged weir and the Dunakiliti dam. The total inflowing discharge is measured at Helena profile. b.) From the seepage canal through the lock No. V. Joint flow rate measurements by both Parties were performed at the Helena profile too. The measurements were jointly evaluated and average daily flow rate data were accepted. The monthly flow rate characteristics at Helena profile in the hydrological year 2002 were as follows:
* - during the flood event (15-17.8.2002) the flow rate was set to 0 m3s-1, and it was taken into account in the flow rate of the Danube The average annual flow rate was 76.9 m3s-1. The monthly flow rate characteristics at the lock No. V:
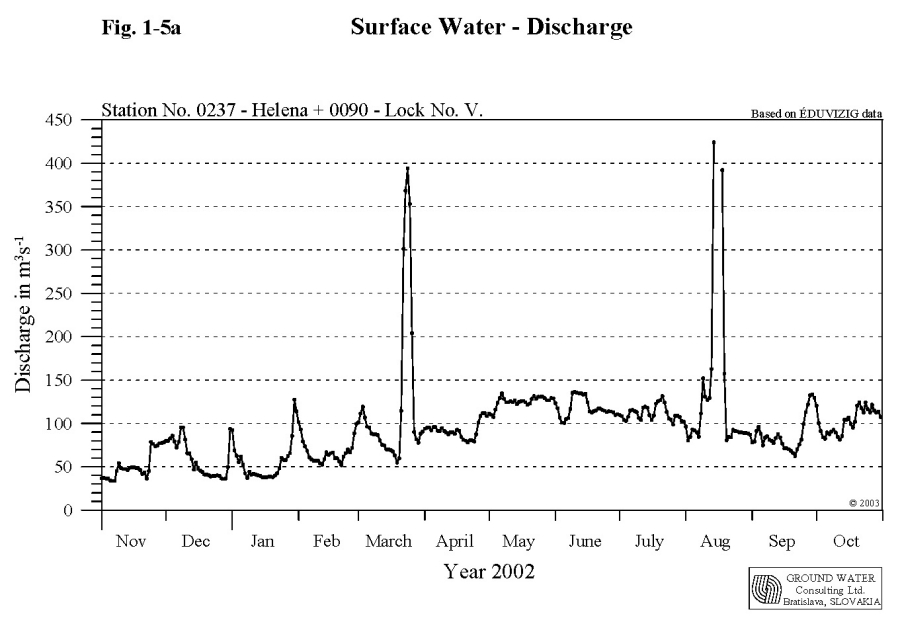
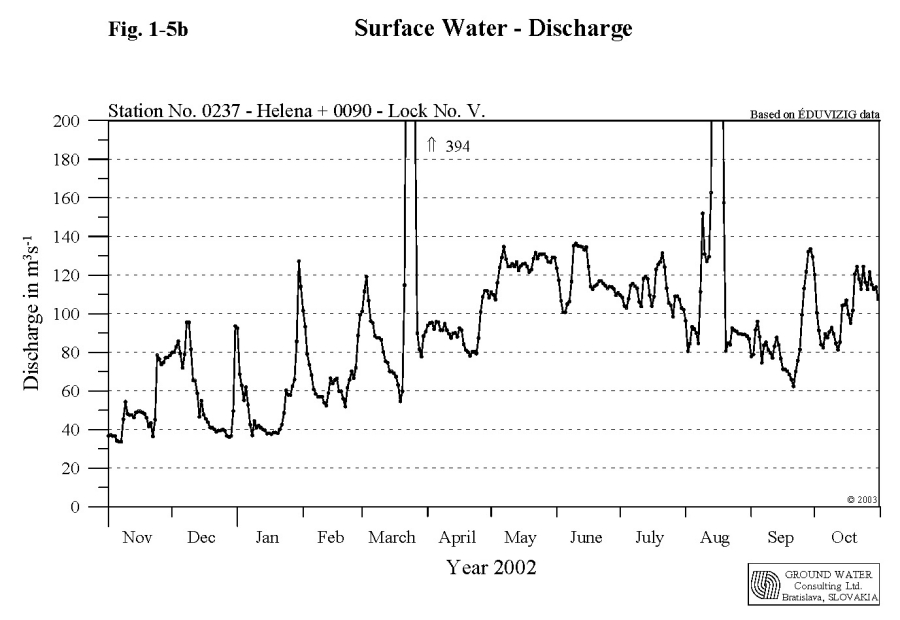
The average annual flow rate was 16.03 m3s-1. The monthly flow rate characteristics of the total amount of water released into the inundation area in hydrological year 2002 (Fig. 1-5a, Fig. 1-5b):
* - during the flood event (15-17.8.2002) the flow rate at Helena was set to 0 m3s-1, and the amount of water flowing through this profile was taken into account in the flow rate of he Danube The total average annual flow rate supplied into the inundation area was 93.1 m3s-1.
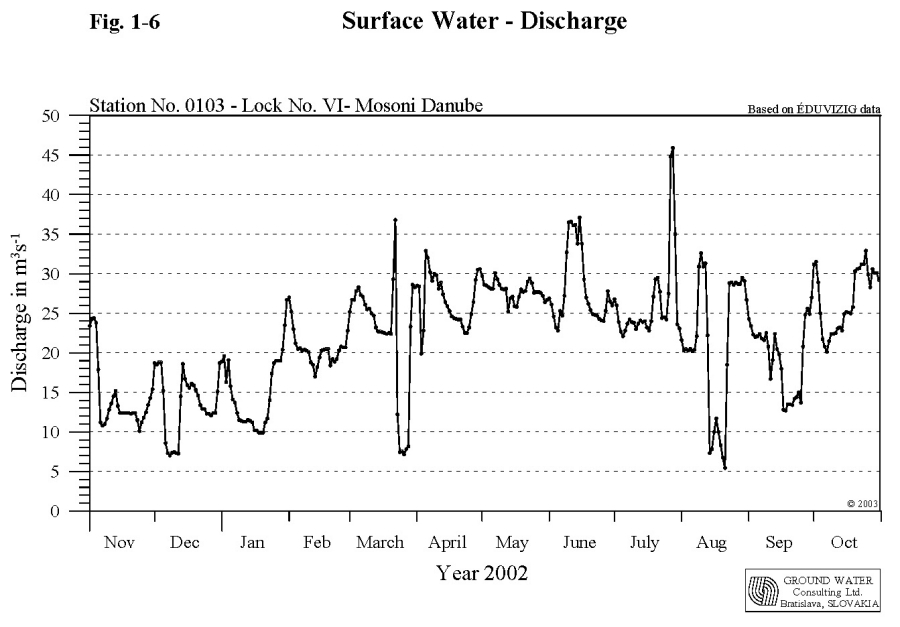
The water supply into the Mosoni Danube is secured from the seepage canal through the lock No. VI (Fig. 1-6). The flow rate is measured at the profile downstream of the lock. The monthly characteristics of the flow rates through the lock No. VI in hydrological year 2002 were as follows:
The average annual flow rate in the Mosoni Danube at lock No. VI. was 21.8 m3s-1. During the non-vegetation period low water period was simulated in the Mosoni Danube as well. This was reached by redirecting of a large part of the water from the seepage canal into the inundation area through the lock No. V., while the water amount taken from the Danube upstream Dunakiliti was reduced. Besides the water supply function the lock No. I has also a flood protection function. It prevents floods to enter the flood-protected area. 1.4. The Danube water level characteristics on the Čunovo-Vámosszabadi stretch According to the prevailing influence the Danube stretch between Čunovo and Vámosszabadi can be divided into four different sections. These sections can be characterised by data obtained from the following gauging stations: Rajka and Hamuliakovo, Dunakiliti, Doborgaz and Dobrohošť, Dunaremete and Gabčíkovo. Vámosszabadi and Medveďov. The four sections on the Čunovo-Vámosszabadi stretch are the following: a) Čunovo - Dunakiliti section. The water level in this section is impounded since constructing the
submerged weir. This impounded section allows the water supply into the right
side river branch system. The amount of water released to the river branch
system is determined by water level regulation at the Dunakiliti dam. The water
level is kept in the mid-water riverbed. The average flow velocities fluctuated
in the range between 0.54-2.26 ms-1. During the hydrological year
2002 discharge over 600 m3s-1 into the Danube old
riverbed was released two times in case of flood. In March the water covered
only the lower parts of the inundation area. In August the water covered the
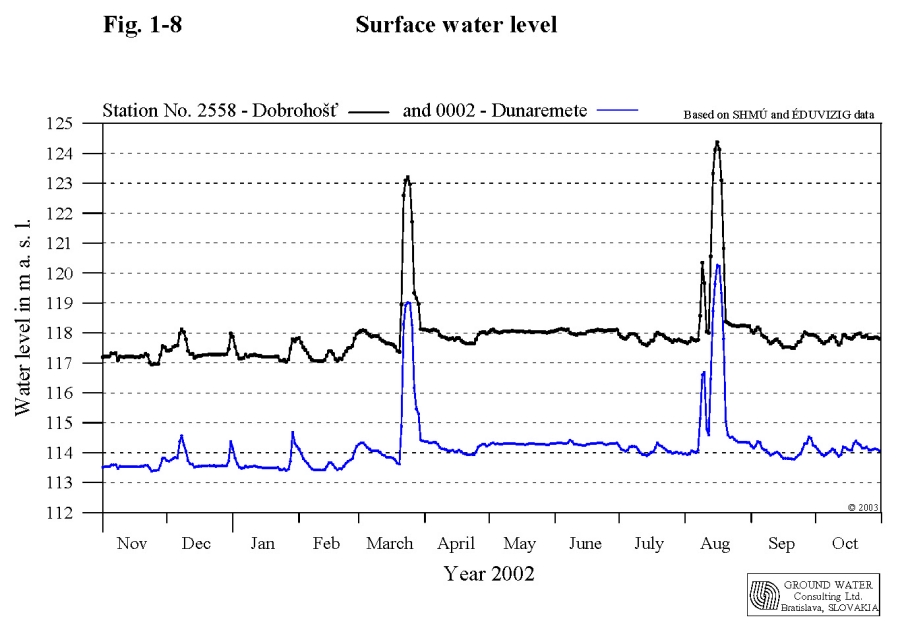
whole inundation. b) Section between Dunakiliti and Dunaremete. This section of the Danube is not influenced by any measures and the water level is determined only by the flow rate in this riverbed section. In the upper part of this section the water level in the river branches is about 3 m higher than the water level in the main riverbed. The daily average water level at the Dobrohošť gauging station (rkm 1838.6) fluctuated in the range from 116.94 to 124.37 m a. s. l. and the yearly average water level was 117.90 m a. s. l. The daily average water level in the Dunaremete profile (1825.5) fluctuated from 113.38 to 120.26 m a. s. l. and the yearly average water level was 114.18 m a. s. l (Fig. 1-8). The average flow velocities fluctuated in the range between 0.79-2.62 ms-1. c) Section between Dunaremete and Sap. The water level in this section is influenced by backwater effect
from the confluence of the tailrace canal and the Danube old riverbed (rkm
1811). The water level changes, especially in the lower part of this section,
are influenced by the flow rates in the tailrace canal. The length of the
upstream section influenced by the backwater effect depends on the actual flow
rate distribution between the hydropower station and the Danube old riverbed.
At regular operation it can be stated that the backwater effect reaches the
Dunaremete profile (rkm1825.5) at flow rates over 2500 m3s-1
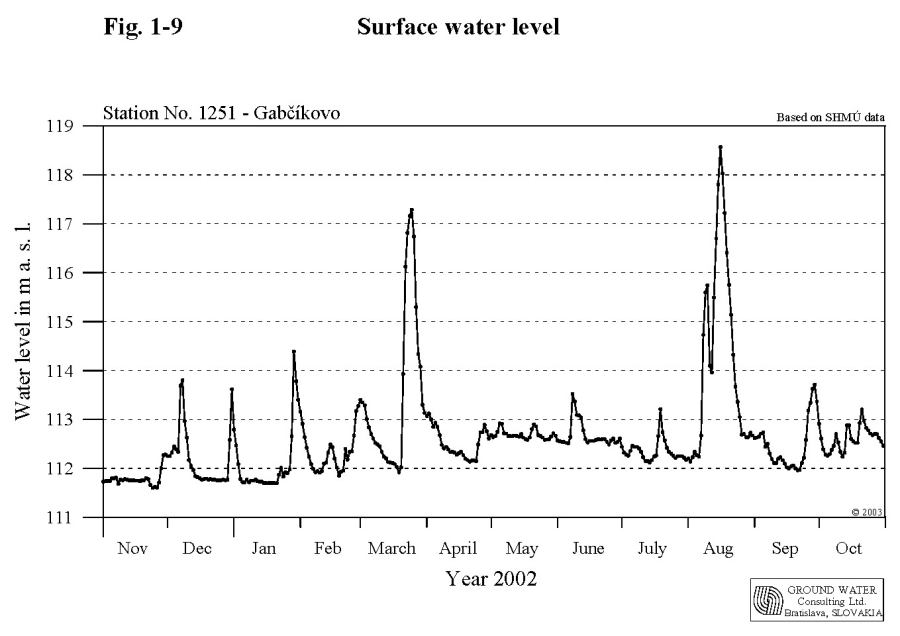
at Medveďov. The daily average water level at the Gabčíkovo gauging
station (rkm 1819) fluctuated in the range from 111.60 to 118.57 m a. s. l. and
the yearly average water level was 112.62 m a. s. l (Fig.
1-9). The daily water
level fluctuation at Gabčíkovo gauging station in the Danube old riverbed,
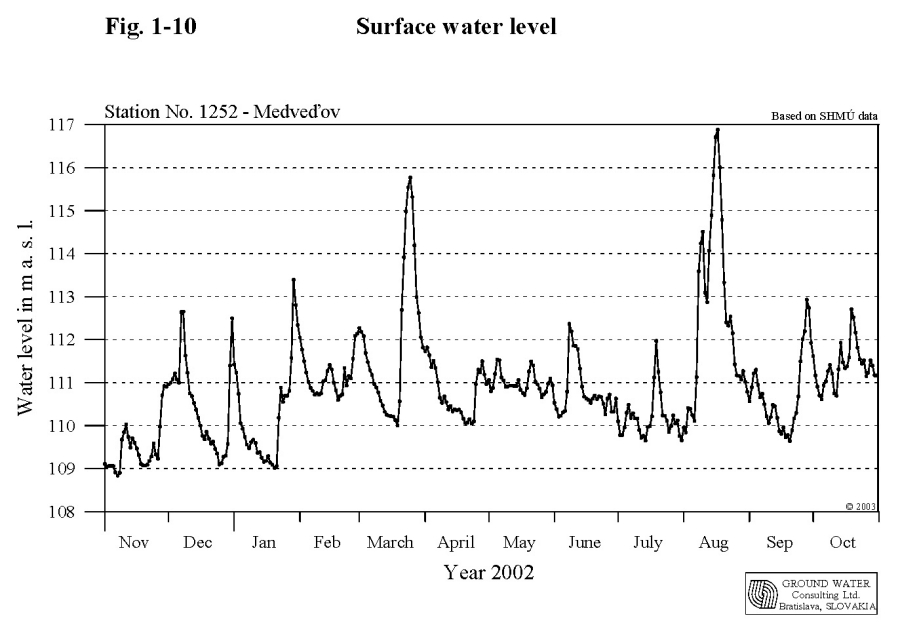
as a consequence of operation of hydropower station, can reach app. 20 cm. d) Sap – Vámosszabadi section. The flow rate in this section equals approximately to the flow rate at Bratislava and is additionally influenced by the operation of Gabčíkovo hydropower station. The daily water level fluctuation at this stretch (up to 30 cm) depends on the hydropower station operation. Higher changes occur at low flow rates in the Danube due to the ratio of the total flow rate and the capacity of one turbine, which is put into operation or stopped. The average annual flow rate at the Vámosszabadi – Medveďov profile in 2002 was 2348,66 m3s-1. The daily average water level at Medveďov profile (rkm 1806.3) fluctuated in the range from 108.84 to 116.88 m a. s. l. and the yearly average water level was 110.84 m a. s. l (Fig. 1-10).
|
|||||||||||||||||||||||||||||||||||||||||||||||||||||||||||||||||||||||||||||||||||||||||||||||||||||||||||||||||||||||||||||||||||||||||||||||||||||||||||||||||||||||||||||||||||||||||||||||||||||||||||||||||||||||||||||||||||||||||||||||||||||||||||||||||||||||||||||||||||||||||||||||||||||||||||||||||||||||||||||||||||||||||||||||||||||||||||||||||||||||||||||||||||||||||||||||||||||||||||||||||||||||||||||||||||||||||||||||||||||||||||||||||||||||||||||||||||||||||||||||||||||||||||||||||||||||||||||||||||||||||||||||||||||||||||||||||||||||||||||||||||||||||||||||||||||||||||||||||||||||||||||||||||||||||||||||||||||||||||||||||||||||||||||||||||||||||||||||||||||||||||||||||||||||||||||||||||||||||||||||||||||||||||||||||||||||||||||||||||||||||||||||||||||||||||||||||||||||||||||||||||||||||||||||||||||||||||||||||||||||||||||||||||||||||||||||||||||||||||||||||||||||||||||||||||||||||||||||||||||