PART 5
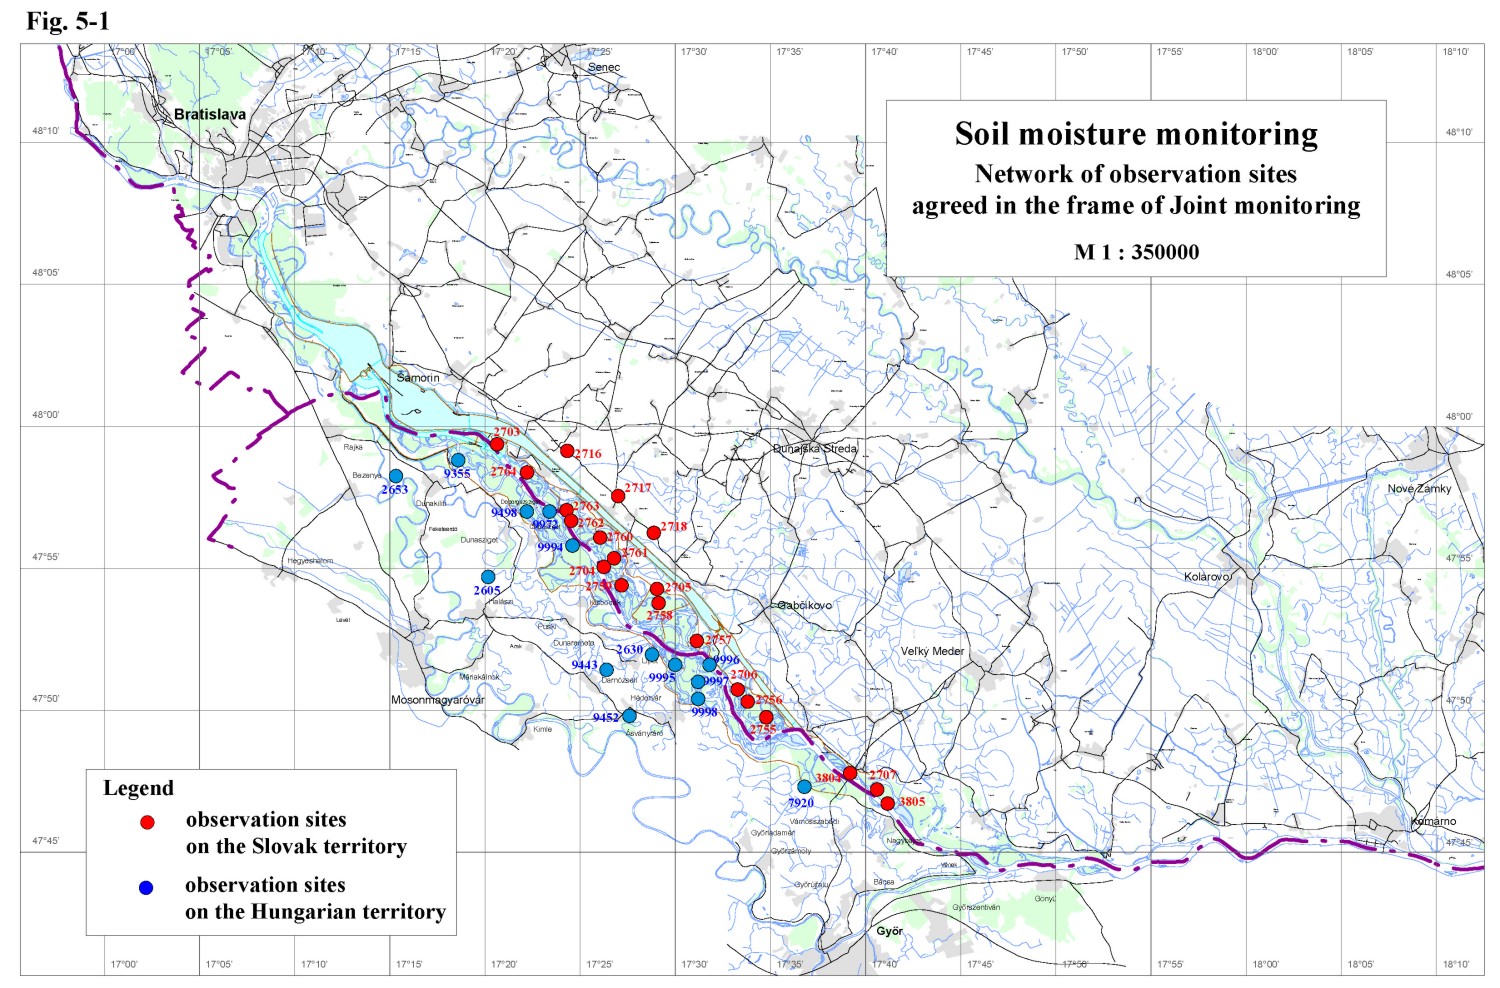
Soil Moisture Monitoring5.1. Data collection methodsThe soil moisture measurements in hydrological year 2001 on both sides were carried out by the same way as in the previous years. Measurements on the Slovak side were performed by neutron probe down to a prescribed depth or to the depth of the ground water level. Measurements on the Hungarian side were carried out with a capacity probe to the prescribed depth. The observation objects were put in the soil layer, down to the underlying gravel layer. The soil moisture on both sides is expressed by the total soil moisture content in volume percentage recorded in 10 cm depth interval for each measurement during the year. Measurements on the Slovak side were performed on 12 forest monitoring areas, on 5 biological monitoring areas and on 3 agricultural areas – Tab. 5-1. Measurements on the Hungarian side were performed on 9 forest monitoring areas and 5 agricultural areas - Tab. 5-2. The situation of observation objects is shown on Fig. 5-1. Table 5-1: List of monitoring stations on the Slovak side
Table 5-2: List of monitoring stations on the Hungarian side
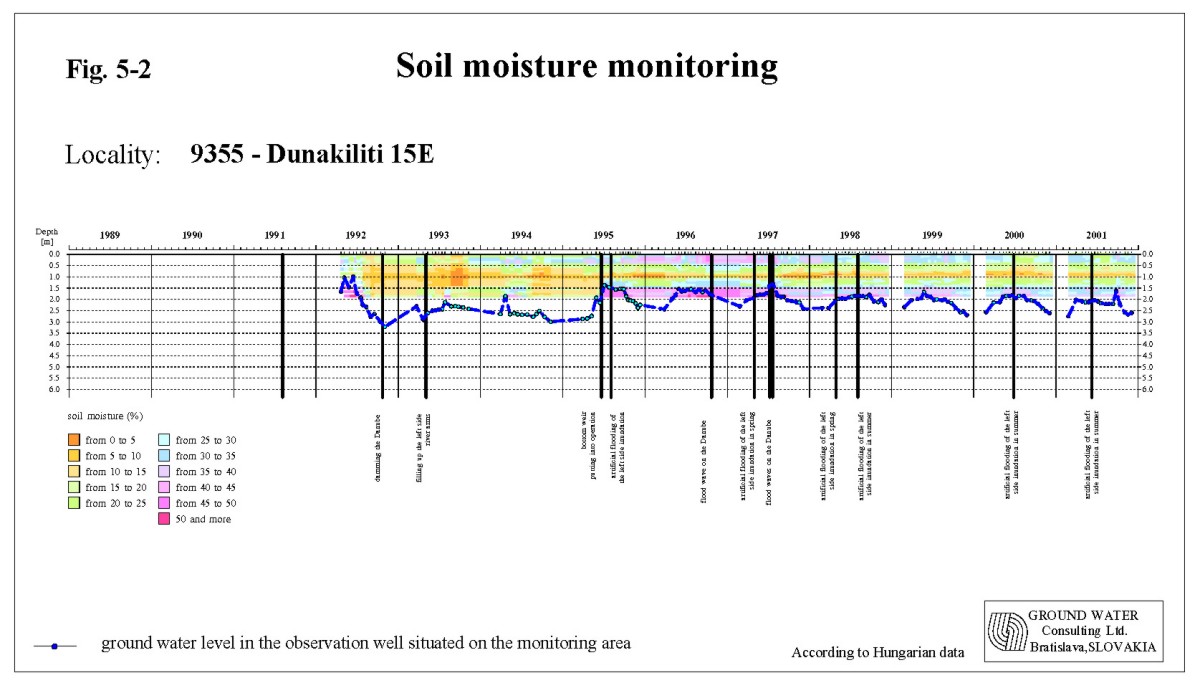
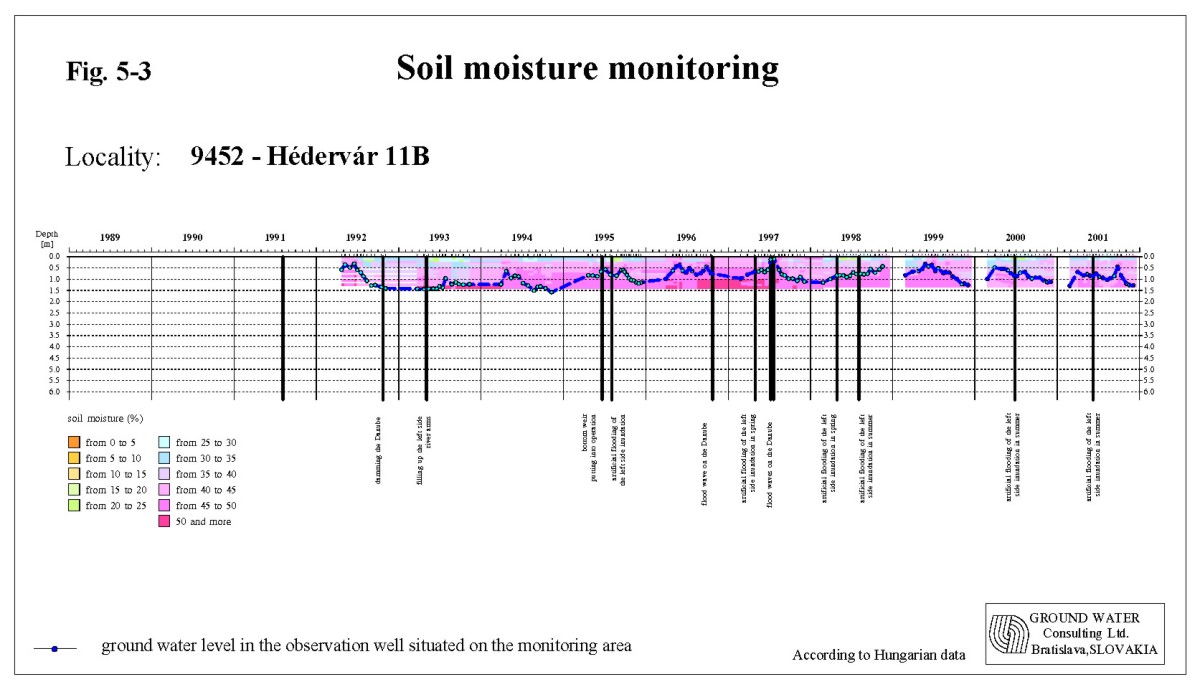
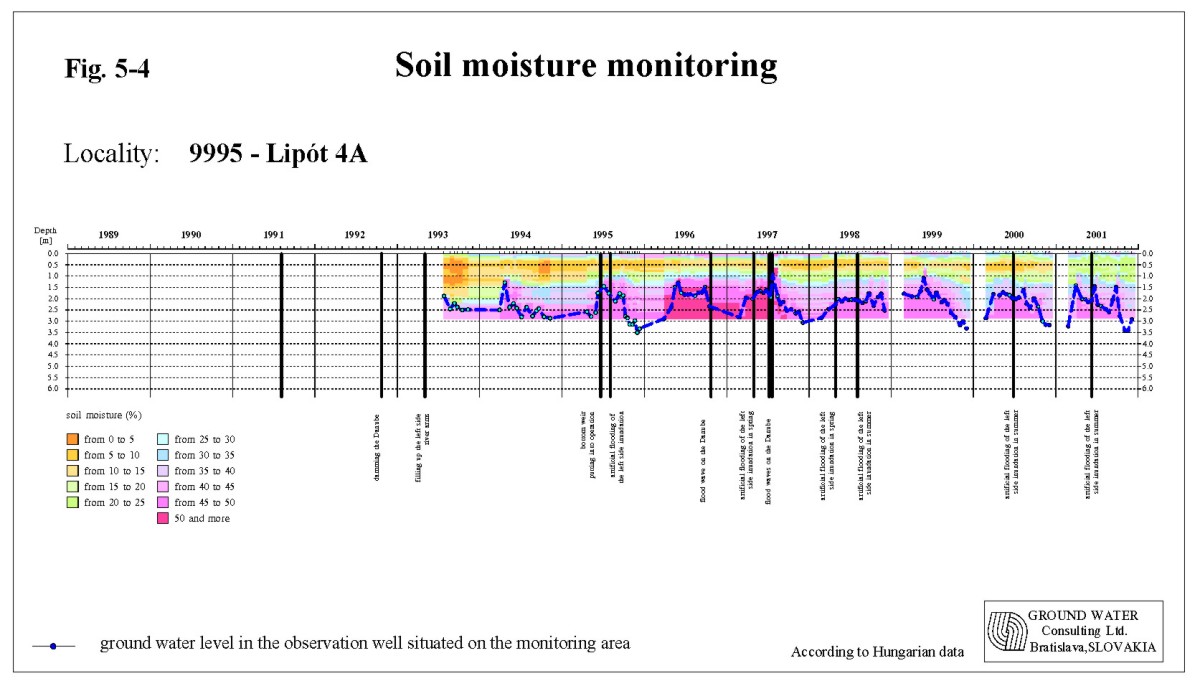
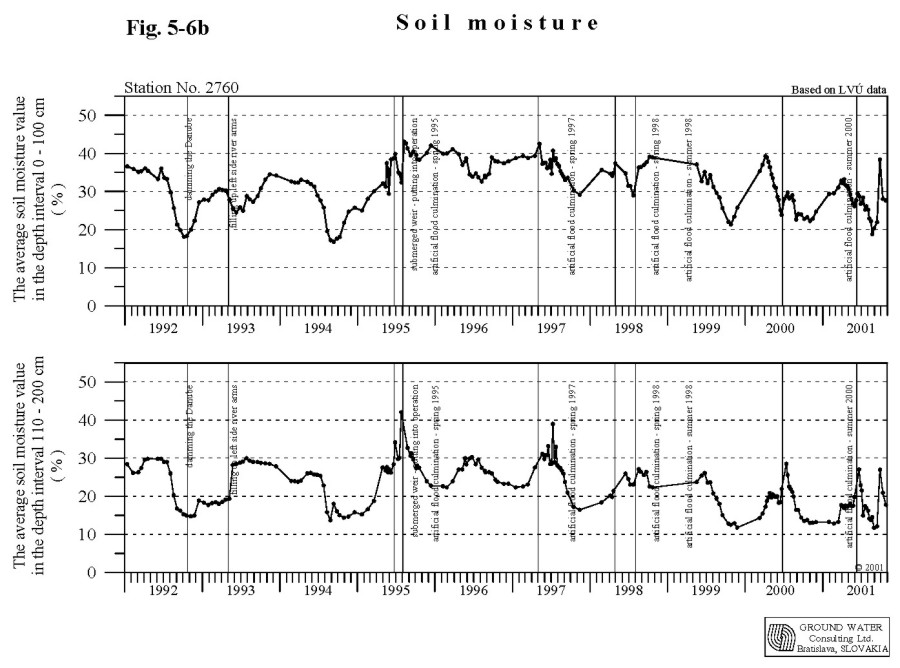
5.2. Data presentation methodsBoth Parties use the same presentation principle of soil moisture content values: figures showing the average soil moisture content in volume percentage for the depth interval from 0 to 100 cm and from 110 to 200 cm. A small difference occurs in Hungarian data, where the value for depth interval under the 110 cm represents the average value for the rest of total measured depth. The soil moisture time distribution for the whole measured depth is presented on colour figures. The graphical presentation of the whole set of measured data is given in the Slovak and Hungarian National Annual Reports.
5.3. Evaluation of results on the Hungarian sideMeasurements of soil moisture contents on the Hungarian side were conducted at forestry monitoring sites in the floodplain area as well as at agricultural monitoring sites in the flood-protected area. Soil moisture values at all monitoring points were lower than in the previous year. This was caused by less precipitation during the vegetation period (61 % of several year’s average). The average amount of precipitation occurred in April and September, while May, June, July and August had been extremely dry. Besides this the soil layer thickness, composition and the depth of the ground water level primarily influence the soil moisture conditions. Forestry monitoring sites All soil moisture monitoring point on forestry areas, except the site No. 9972 was characterised by that fact that both up to 1 m depth and below 1 m the average maximal and minimal values of the soil moisture content were higher comparing to the previous year. The maximum average soil moisture content in 1 m depth was recorded on 24th of September at seven monitoring sites, at the remaining one monitoring point it was recorded at the end of March. The minimum values were recorded in July at three monitoring sites, and at five observation points at the beginning of August. The maximum of average soil moisture contents in the depth below 1 m were recorded on 24th of September at six monitoring sites, and at one monitoring site on 10th September. The minimum was recorded on the 24th of February at six monitoring points, on the 24th of August at monitoring point No. 9972. Regarding the effect of ground water on soil moisture content, differences can be observed at monitoring points. As a result of the water supply the ground water moisturised the soil at monitoring site No. 9355, 9994 and 9995 at various depth (Fig. 5-2, Fig. 5-4). At observation point No. 9997 the ground water fluctuated in the gravel layer. The covering layer is shallow and the water supply in this place is not sufficient. The higher discharges in September increased the ground water level to the vicinity of the overlaying soil layer. At the monitoring site No. 9996 the ground water level was generally found in the gravel bed as well, but during flood events in March, June and September it raised up and moisturised the lower part of the soil layer. The soil moisture content in the soil layer at the monitoring site No. 9994 was balanced, but generally lower than in previous year. Monitoring site No. 9452 is situated close to the river arm supplied by water, on the flood-protected side, hence the ground water constantly moisturised the soil layer (Fig. 5.3). The observation point No. 9972 lying next to the Danube old riverbed and is under strong drainage effect. However, the ground water level reached the 160 cm thick soil layer during the higher discharges in September. The ground water level at monitoring site No. 9998 is influenced by the water level fluctuation in the Danube. The ground water level all the year fluctuated in the 275 thick soil layer, moreover during flood events it rose close to the surface. Agricultural monitoring sites on the flood protected side Precipitation dependent moisturising was similar to that observed at the forestry monitoring sites. Monitoring points No. 2630 and 2653 can get water only from precipitation because the ground water level is situated deep in the gravel bed. However, the ground water level got close to the soil layer during the higher discharges in September. Monitoring points No. 2605 and 9443 are situated in areas with thick covering layers, the ground water moisturised the bottom of soil layer from May till the beginning of October. The abovementioned flood waves influenced the ground water level at these sites too. At the monitoring site No. 7920 was the ground water situated in favourable range of the soil profile from February till September, while from October due to the decreasing discharges in the Danube a significant lowering of ground water level occurred. However the ground water still moderately moisturised the thick covering layer.
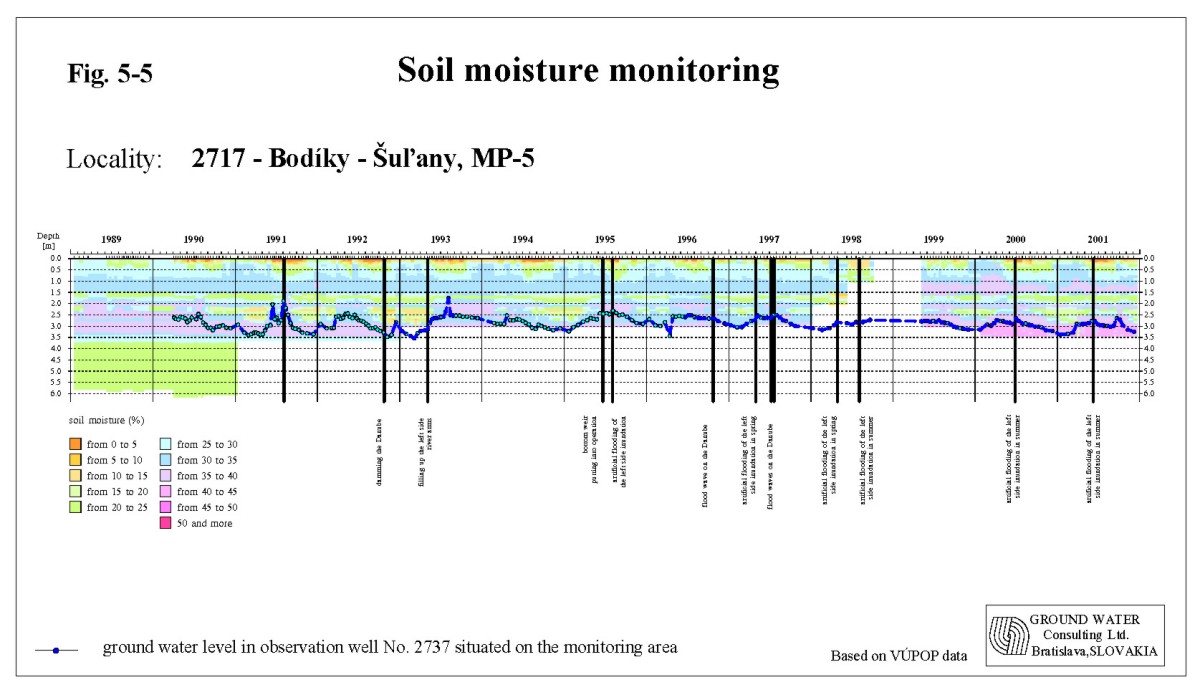
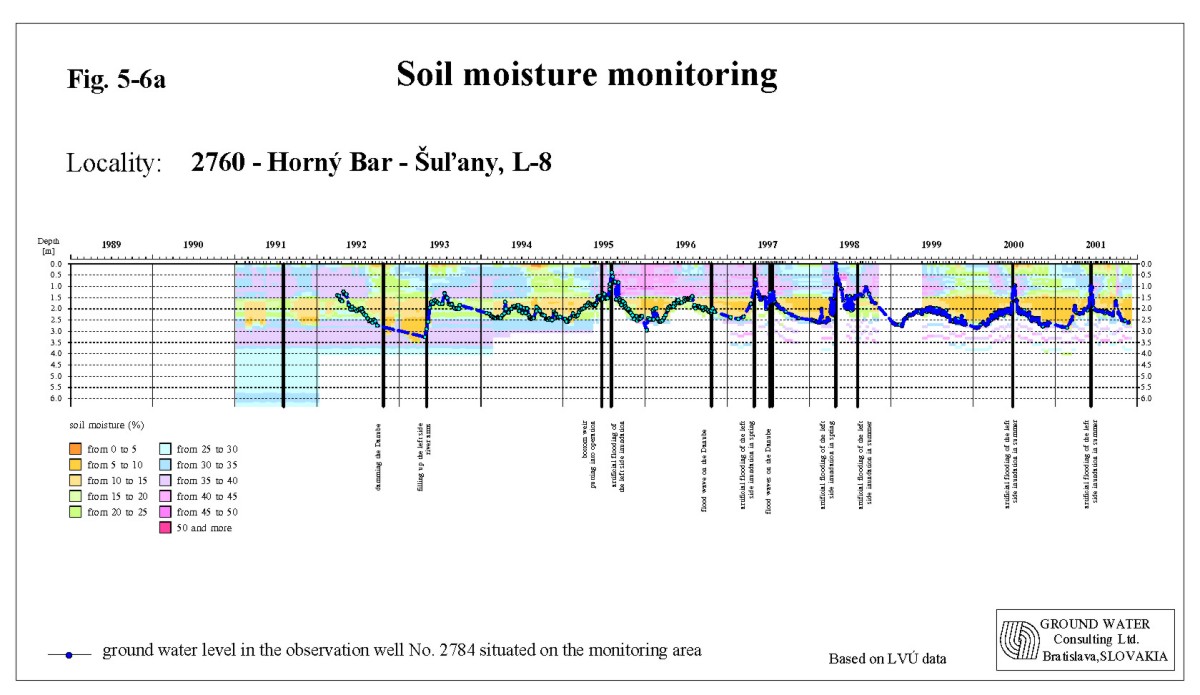
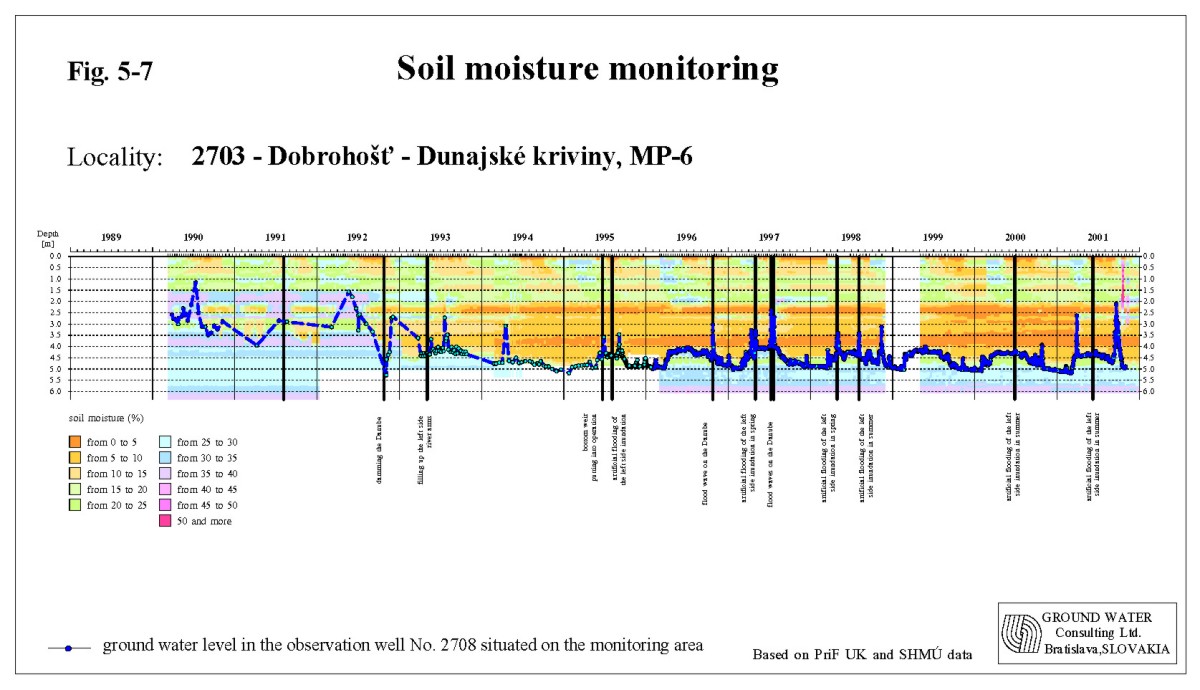
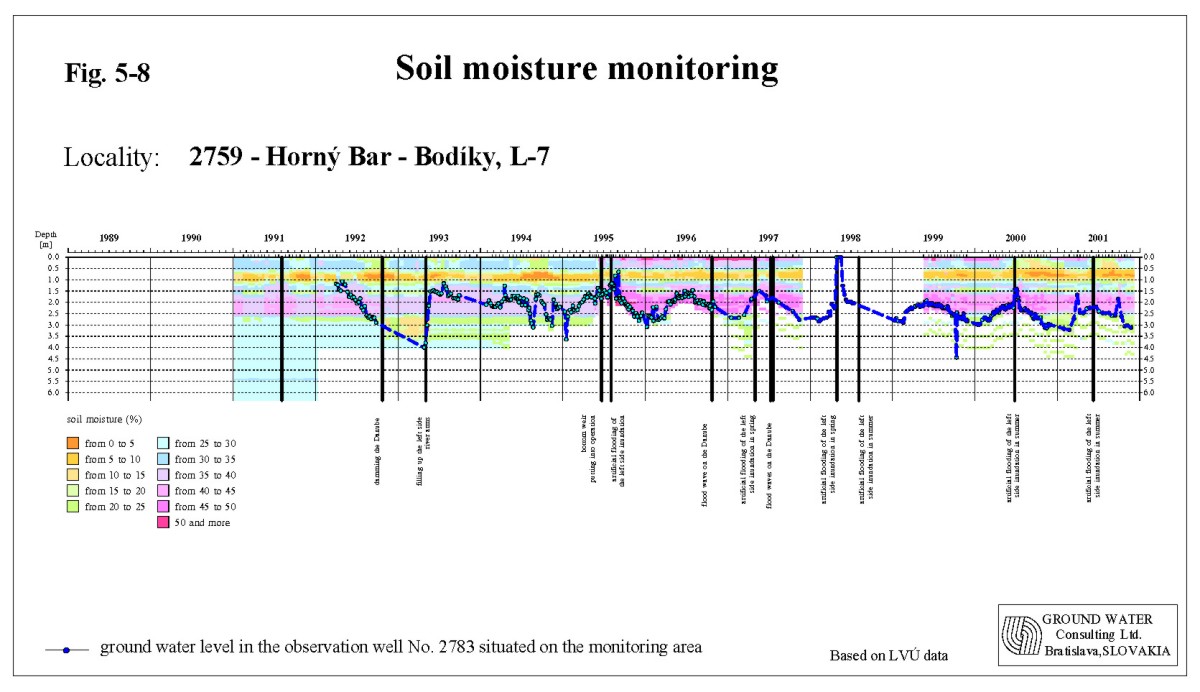
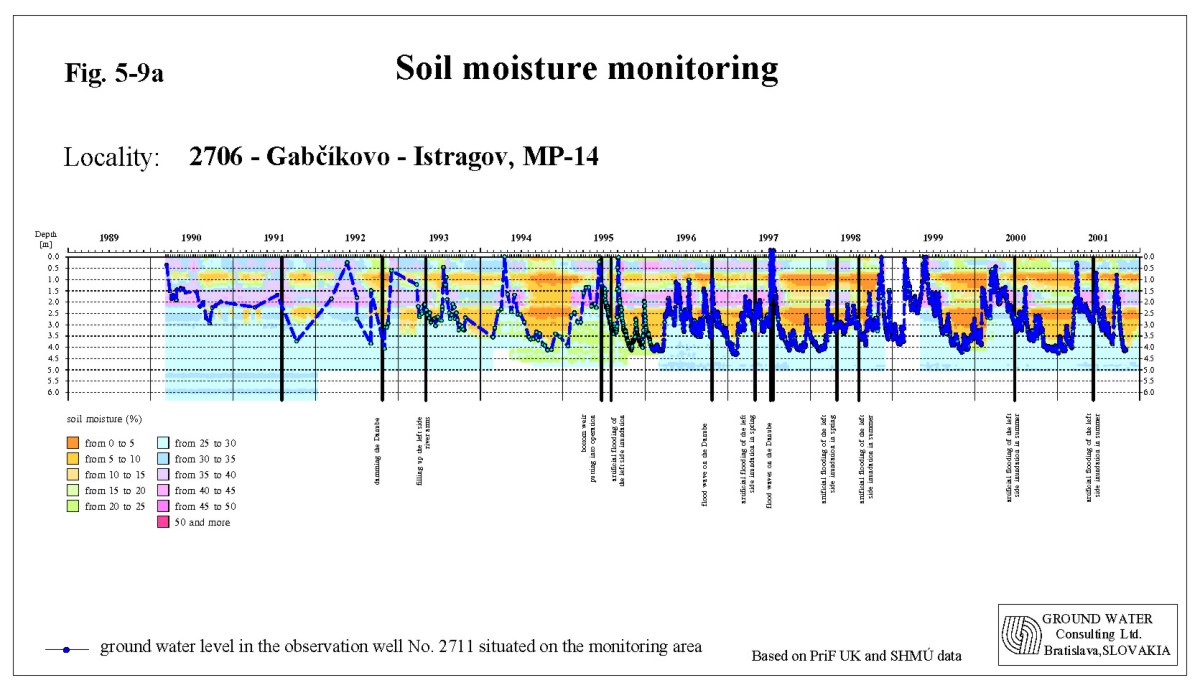
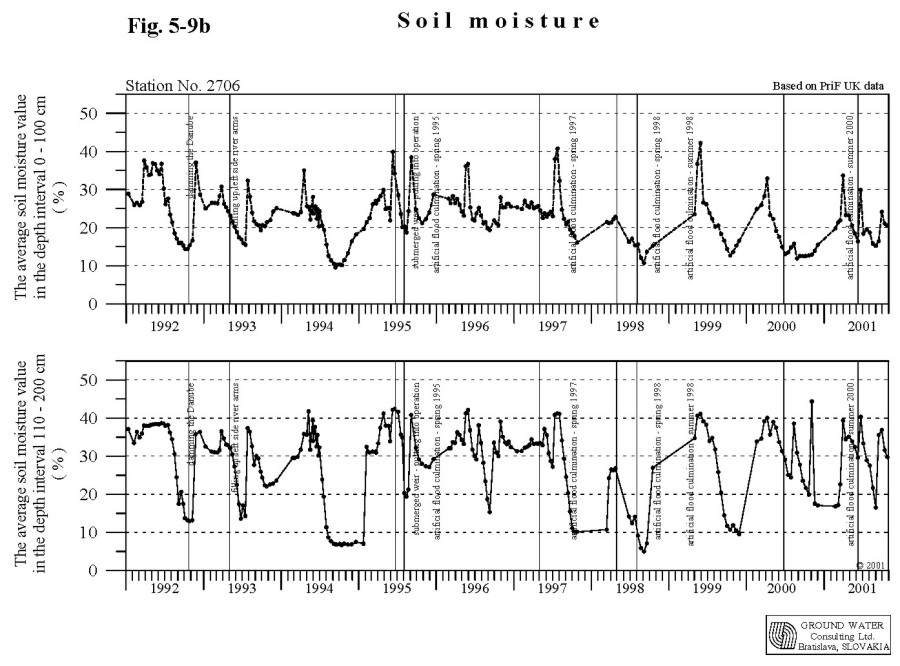
5.4. Evaluation of Slovak resultsMonitoring sites on the Slovak side are situated in the inundation area and flood-protected agricultural area (Fig. 5-1). According to the soil moisture observation at monitoring sites situated in the agricultural area it can be stated that the soil moisture content during the whole observed period remained unchanged (Fig. 5-5). The position and fluctuation of ground water level remained unchanged as well. The ground water level at the monitoring site No. 2716 fluctuated in the depth of 3-4 m, at site No. 2717 in the depth of 2.5-3.5 m and at site No. 2718 in the depth of 2.2-2.8 m. The fluctuation of soil moisture content in the depth interval from 0 to 1 m mostly depends on climatic conditions. In the depth from 1 to 2 m the soil moisture fluctuation, except the monitoring area No. 2716, is partly influenced by the ground water level. The soil moisture content in the depth to 1 m mostly fluctuated in the range from 5 to 25 % on the monitoring site No. 2716 and in the range from 15 to 35 % on the monitoring sites No. 2717 and 2718. In the depth between 1 and 2 m the soil moisture content mainly varied from 5 to 20 % on monitoring sites No. 2716 and 2718 and in the range from 10 to 40 % on monitoring site No. 2717. The situation in the inundation area is more complex. The changes of the soil moisture content depend mainly on the location of the monitoring site in respect to the Danube, in respect to the river branch water supply and to the soil profile thickness. The soil moisture is besides the ground water level and precipitation highly dependent on artificial floods. In hydrological year 2001 there was a small flood simulated in June, which helped the moisturising of the lower part of soil layers. Due to the capacity measurements in the Danube old riverbed higher discharges were released into the riverbed downstream of Čunovo in March and September, which helped the moisturising the soil profile even in the strip along the riverbed. On the other side the distribution of precipitation during the vegetation period was not favourable. In the inundation area around Dobrohošť and Bodíky villages is the thickness of the soil profile, similarly to the Hungarian side, low - monitoring sites No. 2703, 2764, 2763, 2762 and 2761. The ground water level in hydrological year fluctuated only in the gravel layer – on the area No. 2703 in the depth 4-5 m, on the areas No. 2764, 2763, 2762 and 2761 in the depth 2.7-4.5 m. However, in March and September the ground water level, when higher discharges were released into the Danube old riverbed (up to 2500 m3s-1), arose by 1.5-2 m. The average values of the soil moisture content in the depth to 1 m significantly fluctuated and it was highly dependent on the climatic conditions. The soil moisture values in the depth interval from 1 to 2 m are less dependent on the short periods of extreme precipitation or temperature. Intensive soil moisture supply from ground water was observed at higher discharges in the Danube or during the artificial flood (Fig. 5-6a and Fig. 5-6b, Fig. 5-7). The maximum average soil moisture content occurred in March and in September. During the vegetation period, except the artificial flood, the soil moisture content in the layer down to 1 m depth decreased, while in the layer from 1 to 2 m continuously remained low. The minimum values occurred at the end of August and at the beginning of September. At the end of the year the soil moisture content, influenced by the high ground water level and higher amount of precipitation, started to rise up. The thickness of the soil profile in the middle part of the inundation area is higher. The ground water regime in this region is influenced by the water supply of the river arms, introduced in May 1993. Moreover, the artificial floods are with high influence on the ground water level. The ground water level fluctuates mostly above the boundary between the soil profile and gravel layers - monitoring sites No. 2704, 2705, 2758, 2759, 2760 (Fig. 5-8). The lack of precipitation in the vegetation period in 2001 resulted in continuous decrease of the soil moisture content in the upper part of the soil layer. The ground water significantly supplies the soil profile in the depth interval from 1.5 to 3 m. During higher discharges in the Danube old riverbed and during the artificial flood the ground water level rose up by 0.7 to 2, and it got to the depth of 1-1.5 m under the surface. The monitoring site No. 2705 was even flooded. The maximal values of soil moisture content were reached in March and September and during the artificial flood in June, minimal values occurred in July and at the end of August. In the lower part of the inundation area, downstream of the confluence of river branch system and the Danube (monitoring sites No. 2706, 2756, 2755), the ground water level fluctuates around the boundary between the soil profile and the gravel layer. The average values of the soil moisture significantly fluctuate, and are strongly dependent on the ground water level fluctuation. The minimum and maximum values are related to the minimum and maximum ground water levels respectively. In 2001 the soil moisture was positively influenced by the high discharges in the Danube in March, June and September (Fig. 5-9a and Fig. 5-9b). In the second half of vegetation period, when discharges in the Danube dropped down, the soil moisture content rapidly decreased. The soil moisture contents at monitoring sites No. 2707, 3804, 3805, located in the inundation below the confluence of the tailrace canal and the Danube old riverbed, are highly influenced by the discharge regime in the Danube. The maximum values in the year 2001, in the depth down to 1 m and between 1 and 2 m, occurred during the spring, while the minimum values occurred at the end of the year. The water level fluctuated mostly in the depth 0-2.5 m.
|