PART 4
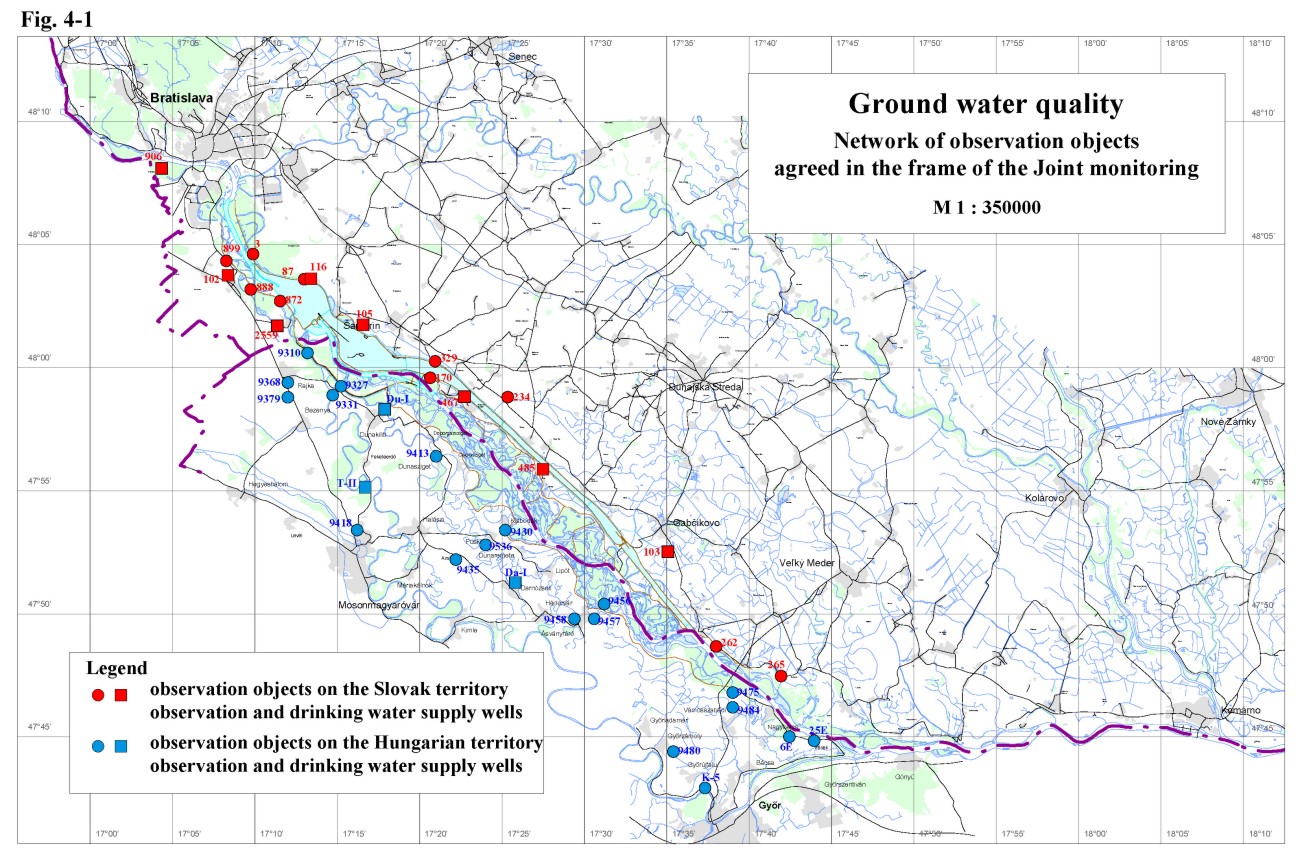
Ground Water Quality4.1. Hungarian territoryThe subject of the joint ground water quality monitoring on the Hungarian side consists of 22 wells, from among 16 objects are ground water quality observation wells, situated in the upper layer of the gravel sediments, and 6 wells are used for drinking water supply (Tab. 4-1). Samples were taken 4 times during the year in case of the ground water quality monitoring wells, and 4-10 times in case of the drinking water wells, except the Darnózseli I well, where the sample was taken once. The drinking water supply was stopped in June in case of wells 6E and 25E at Győr-Szőgye, therefore no further sampling was carried out. The sampling and analysis methods were the same as in the previous years. In case of the water quality monitoring wells the dissolved oxygen concentration had not been measured in the year 2001. The water quality monitoring in the observation wells was carried out by the North-Transdanubian Authority for the Environment Protection, the water quality monitoring in the wells for drinking water supply were carried out by Regional Waterworks Companies. Wells included in the ground water quality monitoring are shown on the Fig. 4-1. Table 4-1: List of monitoring objects on the Hungarian territory
Taking into consideration the Recommendations of the Joint Annual Report in 1999 so-called long-term evaluation of the ground water quality has been carried out in the Hungarian National Annual Report for the year 2001. The detailed evaluation as well as the data series and graphs were presented in the Hungarian National Annual Report for the year 2001. In the present Joint Report evaluation of four selected observation wells is given. Well No. 9327, location: Dunakiliti Considering the long-term data series it can be stated that the periodic, seasonal fluctuation of the water quality can be very well observed in this well. The water is of low salinity, close to the salinity of the Danube water. This periodic character is expressed in the fluctuation of water temperature, electric conductivity as well as in the sodium, chloride and nitrate concentrations. From among the salinity components slight decrease of the sodium and chloride ion concentrations, as well as decrease of salinity can be observed, while the phosphate concentration slightly increasing in last two years. According to the agreed ground water quality limit values the water from this well is suitable for drinking water supply purposes (Tab. 4-3). Well No. 9413, location: Sérfenyősziget The water temperature and the pH values in this well, similarly to the previous year, show slight fluctuation. The water is of medium salinity, and during the last ten years there is a slight increase of salinity observed. This is proved by increase of calcium and magnesium concentrations after introduction of the water supply. Comparing to previous years decrease of nitrite, nitrate and manganese concentrations was observed in 2001. Agreed limits for the drinking water quality for the three mentioned ions were not satisfied at one occasion during the year 2001. The content of organic material, ammonium and iron concentrations remained below the drinking water quality criteria. Well No. 9430, location: Kisbodak The water temperature is stable and does not follow changes in air temperature. The water is of medium salinity. Decrease of salinity was observed since 1996, which is expressed also in decrease of calcium, sulphate, chloride and hydro-carbonate concentrations. This is probably connected to the gravitational water supply introduced to the flood plain area according to the Agreement 1995. The amount of nitrogen forms and organic material is invariably low; concentrations are below the agreed limits. High iron and manganese concentrations do not meet the drinking water quality criteria. The iron concentration shows significant fluctuation from year to year, while the manganese concentration is slightly decreasing. Well No. 9456, location: Ásványráró The water temperature is stable and the pH values do not show any tendency. The water is of low salinity and no significant changes are observed during the observation period. However the conductivity values show slight increase in last two years (from app. 52 to app 64). This slight increase corresponds to slight increase of calcium, magnesium, sulphate and hydro-carbonate ion concentrations. The concentrations of nitrite and nitrate ions are minor, however the concentration of the ammonium ion increasing and fluctuate over the agreed limit for drinking water. In comparison to the previous year the iron concentration decreased and in 2001 fluctuated below the limit for drinking water, while the manganese concentration fluctuated below 0.4 mg.l-1 (limit value in Hungary is 0.5 mg.l-1). The content of organic material, indicated by CODMn shows slight decrease. Based on the long-term water quality observation results obtained on the selected 16 observation wells in the period 1992-2001 it can be concluded that the water quality has changed in certain wells. Decrease of iron and manganese was observed in the region of Dunakiliti (well No. 9327) and Kisbodak (well No. 9430) and decrease of organic matter in the region of Arak and Ásványráró was detected (wells No. 9435, 9456 and 9457). Increasing salinity, which does not affect the ground water quality, was detected in the inland area around Mosonmagyaróvár, Püski and Győrzámoly (wells No. 9418, 9536 and 9475). Increasing content of iron at Rajka and Vámosszabadi (wells No. 9310 and 9484) indicates deteriorating tendency. Increase of ammonium ion concentrations at Rajka, Ásványráró and Győrzámoly (wells No. 9368, 9456 and 9458) refers to changes in reduction anoxic conditions. These changes refer probably to changed ground water flow direction. Analysing the ground water quality data from wells used for drinking water supply it can be stated that the wells around the Győr show low iron, manganese and ammonium concentrations. The water quality in the other wells, which take the water from higher depth, is excellent and the water composition is characterised by high stability.
4.2. Slovak territoryFor the purposes of the Slovak-Hungarian monitoring data of the Western Slovakia’s Waterworks and Sewerage Enterprise (ZsVaK), the Waterworks and Sewerage Enterprise Bratislava (VaK) and Slovak Hydro-meteorological Institute (SHMÚ) were used. The objects of Waterworks are used for drinking water supply; the SHMU’s objects are observation wells (Tab. 4-2). Similarly to the previous year the evaluation was done for period of nine years (1.10.1992-31.10.2001) on each of the wells included in the joint monitoring. Table 4-2: List of monitoring objects on the Slovak territory
Short evaluation of the ground water quality objects included in the data exchange In comparison to the previous year there were no significant changes in the parameters observed during the hydrological year 2001. Values of the basic physical and chemical parameters, cations and anions and the oxygen regime parameters at all of the objects satisfy the agreed limits for ground water quality. Nutrient values except the nitrites in observation object No. 170 and ammonium ion in observation object No. 899 satisfy the agreed limits for ground water quality in long-term. The ground water quality limits for iron and manganese are satisfied at all of the observation objects, except the objects No. 872 (since June 1999 satisfy), 170, 262 and 234 (only one value in 2001) for iron, and objects No. 116, 485, 899, and 262 for manganese. Basic physical and chemical parameters Both in water sources as well as in observation objects the basic physical and chemical parameter values satisfy the ground water quality limits in long-term. The decrease of conductivity on objects No. 329, 872, 170, 105 and 888 is connected with the decrease of cation and anion concentrations on the respective objects. The decrease of conductivity representing the decrease of salinity resulted from the ground water flow direction changes in the area around the reservoir. Nutrients Nitrate concentrations in observation objects No. 116, 87, 105, 467, 2559 and 888 show decreasing tendency in the observed period. In objects No. 467 and 2559 slight increase can be observed in 2001. The nitrate content in objects No. 102, 872 and 170 slightly decreased after putting the hydropower structure into operation and similarly to the other water quality parameters had stabilised during the period 1994-1997. Since 1998 decrease of nitrate concentration is observed in object No. 170, while slight increase is detected in object No. 872. Increasing tendency of nitrate concentrations is evident in object No. 103. In object No. 329 there was a slight increase of nitrate concentrations, while continuous decrease is observed from 1997. In the rest of the objects no significant change was detected in this parameter. Nitrite concentrations in all of the observed objects, except the objects No. 170, 872 and 234 in long-term fluctuate mainly below the detection limit or fluctuate up to 0.05 mg.l-1. At the objects No. 234 and 872 the nitrite concentrations varies. In the object No. 170 the nitrite concentration increased until 1996 (0.01-0.15 mg.l-1), since 1997 a decreasing tendency is evident and values fluctuate in a range from 0.03 to 0.1 mg.l-1, but in 1998 occasionally occurred values up to 0.2 mg.l-1. The ammonium ion concentrations in all objects, except objects No. 899, 888, 872, 485, 170 and 265 fluctuate up to 0.15 mg.l-1. In objects No. 888, 872, 170 and 3 the concentrations fluctuated up to 0.3 mg.l-1, occasionally up to 0.6 mg.l-1. In the period 1997-2001 the fluctuation decreased and concentrations oscillate between 0.05-0.35 mg.l-1. The measured ammonium concentrations in objects no. 899 and 265 have increasing tendency for the whole observation period. In case of object No. 899 it fluctuate up to 0.6 mg.l-1, in case of object No. 265 fluctuate between 0.01 and 0.17 mg.l-1. The phosphate concentration in wells used for drinking water supply mainly fluctuates up to 0.05 mg.l-1 in the observed period, occasionally above (max. up to 0.38 mg.l-1). In hydrological year 2000 the detection limit in objects No. 102, 906 and 2559 was set to 0.1 mg.l-1. The situation in observation wells, except the object No. 265 is similar, and the concentrations mainly fluctuate up to 0.05 mg.l-1. In the object No. 265 the phosphate concentration fluctuates from 0.02 to 0.13 mg.l-1. The oxygen regime parameters The oxygen concentrations in waterworks situated on the left side of the Danube and waterworks No. 485 and 467 usually fluctuate up to 1 mg.l-1. The oxygen values in waterworks situated on the right side of the Danube (objects No. 102, 2559 and 906) fluctuate from 1 to 6 mg.l-1. The oxygen concentrations in the observation objects, except the object No. 3, vary in a narrower range, mainly up to 1 mg.l-1. The oxygen concentration in object No. 3 follows the values in the Danube water. CODMn values in objects situated on the right side of the Danube and reservoir (except observation objects No. 467 and 485 where the fluctuations is without changes) and in objects No. 329 and 265 had evident decreasing tendency during the period 1993-1998. Slight increase of CODMn values was recorded during years 1999-2000 in objects No. 899, 888, 872, 170, 329 and 265, however in 2001 slight decrease occurred again. Slightly increasing tendency of CODMn values was detected in objects No. 116 and 87, less expressively in object No. 105. The CODMn concentrations in object No. 3 vary, but during 1999-2000 there is a slight increasing observed, which is probably related to slight increase of CODMn values in the Danube in this period. Iron and manganese Iron and manganese are characteristic components of the hydrogeological environment in this region. The iron concentrations in all objects, except objects No. 872, 170, 262 and 234, fluctuate up to 0.3 mg.l-1. Occasionally values above 3 mg.l-1 occur. Higher iron concentration in observation objects No. 872, 170 and 234 can be also connected with the casing material. The fluctuation of iron concentration on these objects in the period 1998-2001 has stabilised and varying up to 0.4 mg.l-1, occasionally to 0.6 mg.l-1. Higher iron concentration occurs in the object No. 262 and fluctuates up to 0.55 mg.l-1. Slight increase of iron content was recorded in object No. 87 in years 2000-2001, and the values usually vary from 0.05 to 0.12, occasionally up to 2 mg.l-1. Manganese concentrations in waterworks, except objects No. 116 and 485, fluctuate up to 0.06 mg.l-1. The manganese content in object No. 116 fluctuates from 0.05 to 0.2 mg.l-1. Manganese values in water source No. 485 in long term vary in the range from 0.2 to 0.6 mg.l-1. The manganese concentrations in observation objects, except objects No. 899 and 262, fluctuate up to 0.1 mg.l-1, rarely above this value. In observation object no. 899 the manganese concentrations show in the period 1996-2001 increasing tendency and fluctuate from 0.2 to 0.9 mg.l-1. In years 1999-2001 slight increase of manganese concentration was observed in object No. 262, and the values usually vary from 0.06 to 0.11 mg.l-1. Limits for drinking water quality used for evaluation in the frame of joint monitoring is given in the following table: Table 4-3: Ground water quality limits for drinking water.
|
||||||||||||||||||||||||||||||||||||||||||||||||||||||||||||||||||||||||||||||||||||||||||||||||||||||||||||||||||||||||||||||||||||||||||||||||||||||||||||||||||||||||||||||||||||||||||||||||||||||||||||||||||||||||||||||||||||||||||||||||||||||||||||||||||||||||||||||||||||||||||||||||||||||||||||||||||