PART 3
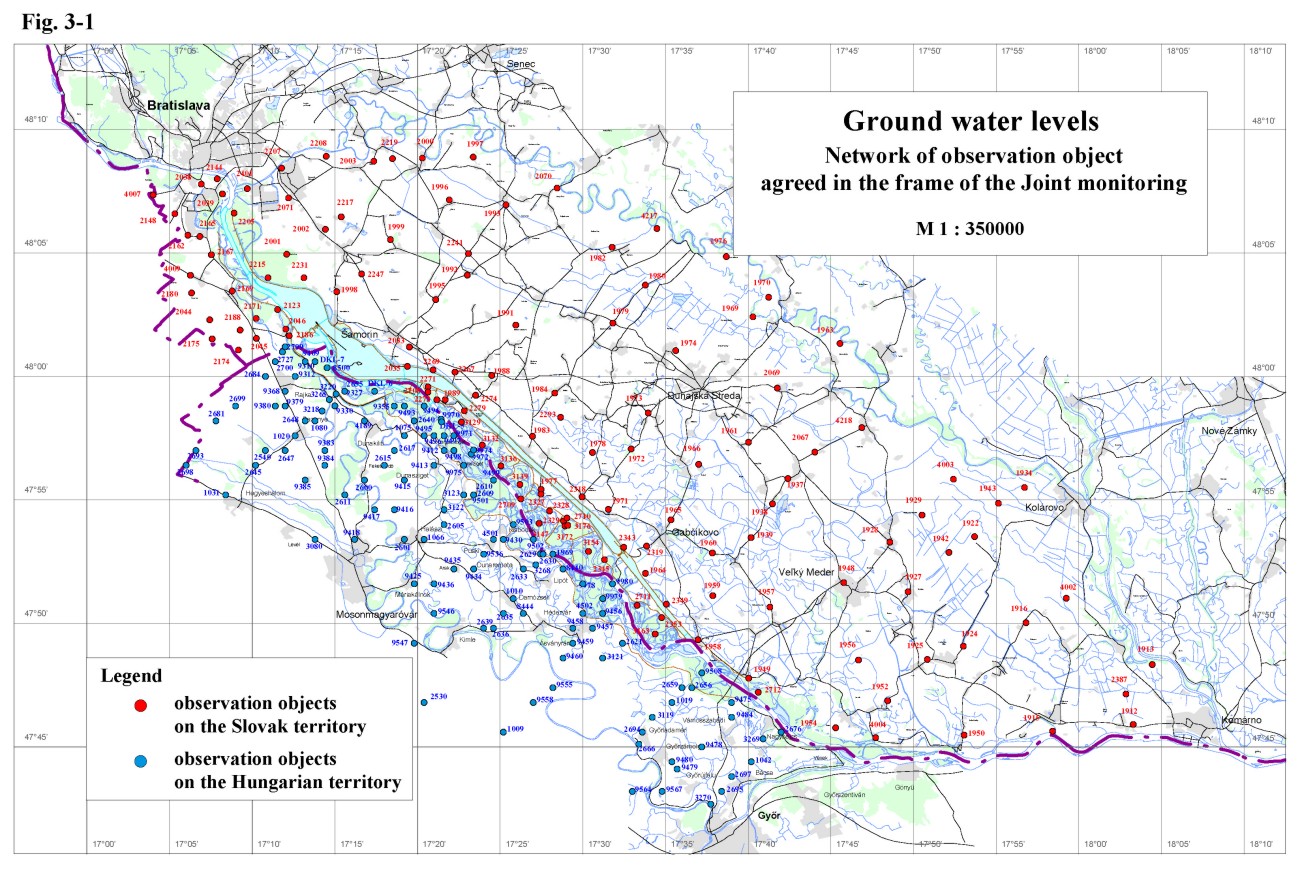
Ground Water RegimeIn the hydrological year 2001 the impact of temporary technical measures and discharges into the Danube and Mosoni branch of the Danube, realised according to the Agreement, and the impact of the water supply on the ground water regime and ground water levels was monitored by 257 observation wells. These objects are situated in the area of Žitný ostrov and in the Szigetköz region. The network of observation objects on both sides is shown in Fig. 3-1. The evaluation of ground water level data in 2001 in local scale was done by the Parties themselves, and is given in the respective National Annual Reports. The jointly elaborated regional evaluation given in this report was prepared according to the jointly constructed ground water level equipotential lines. The equipotential lines were constructed for comparison of the ground water levels in the influenced area in the current year and the ground water levels before construction of bottom weir and introducing the water supply into the river branches on the Hungarian side.
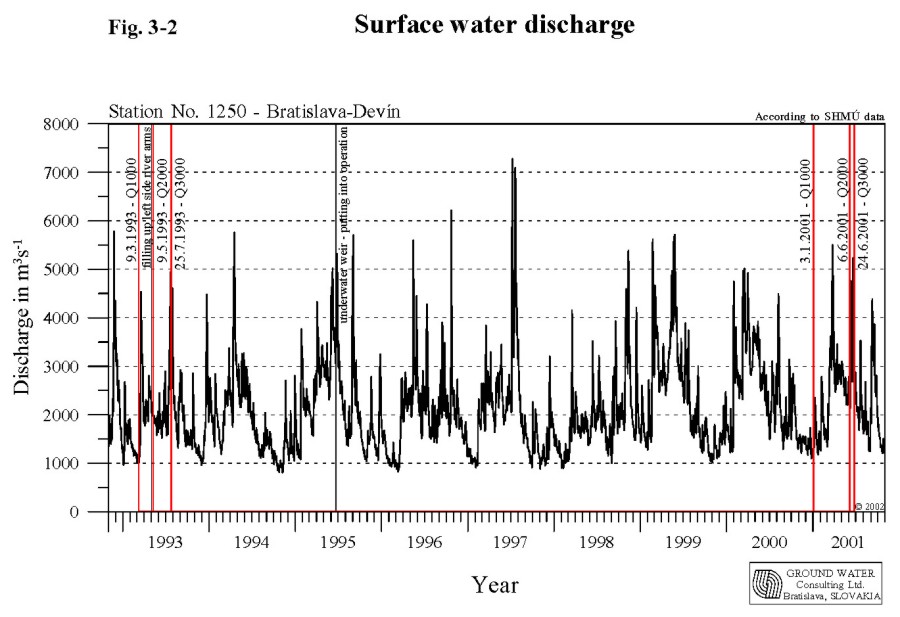
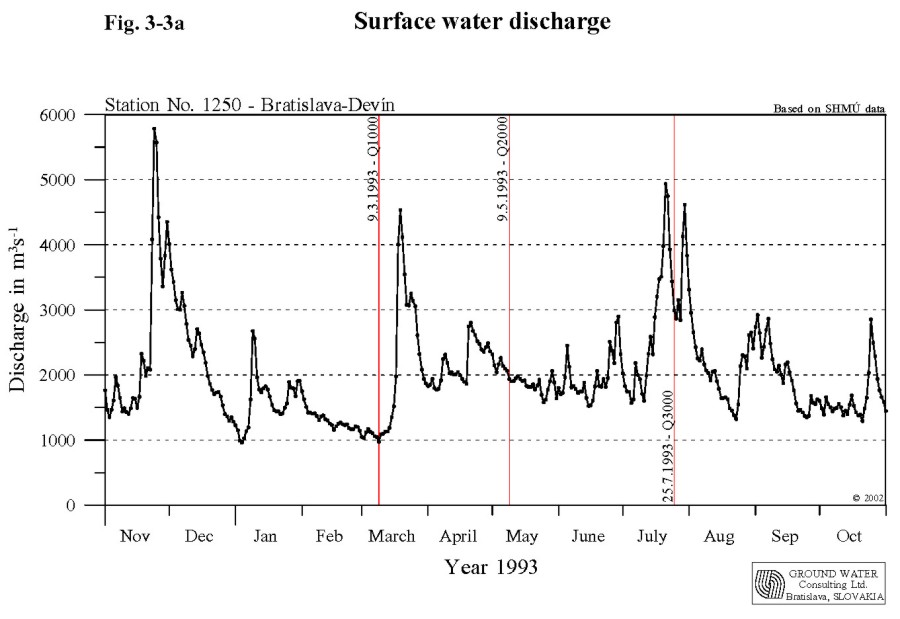
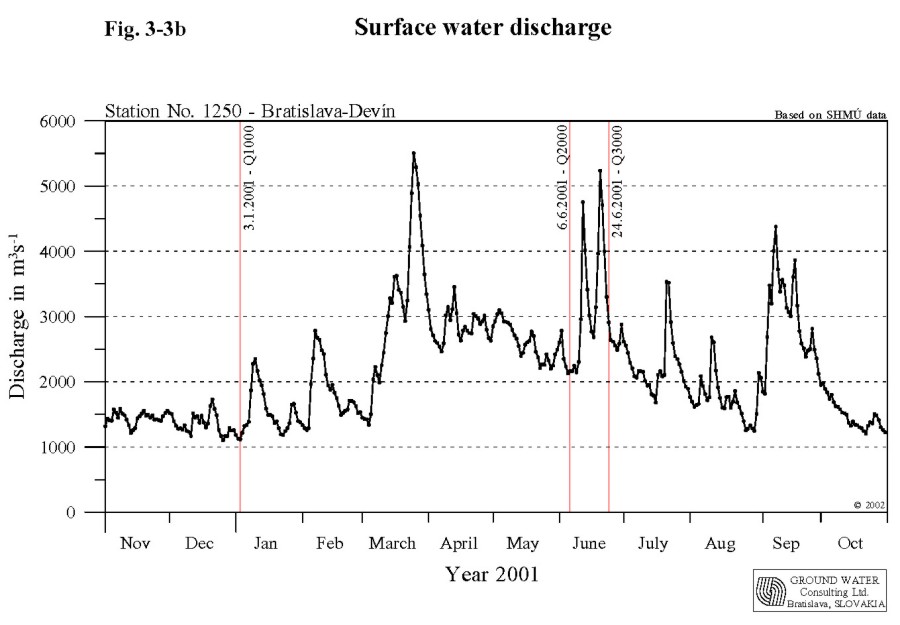
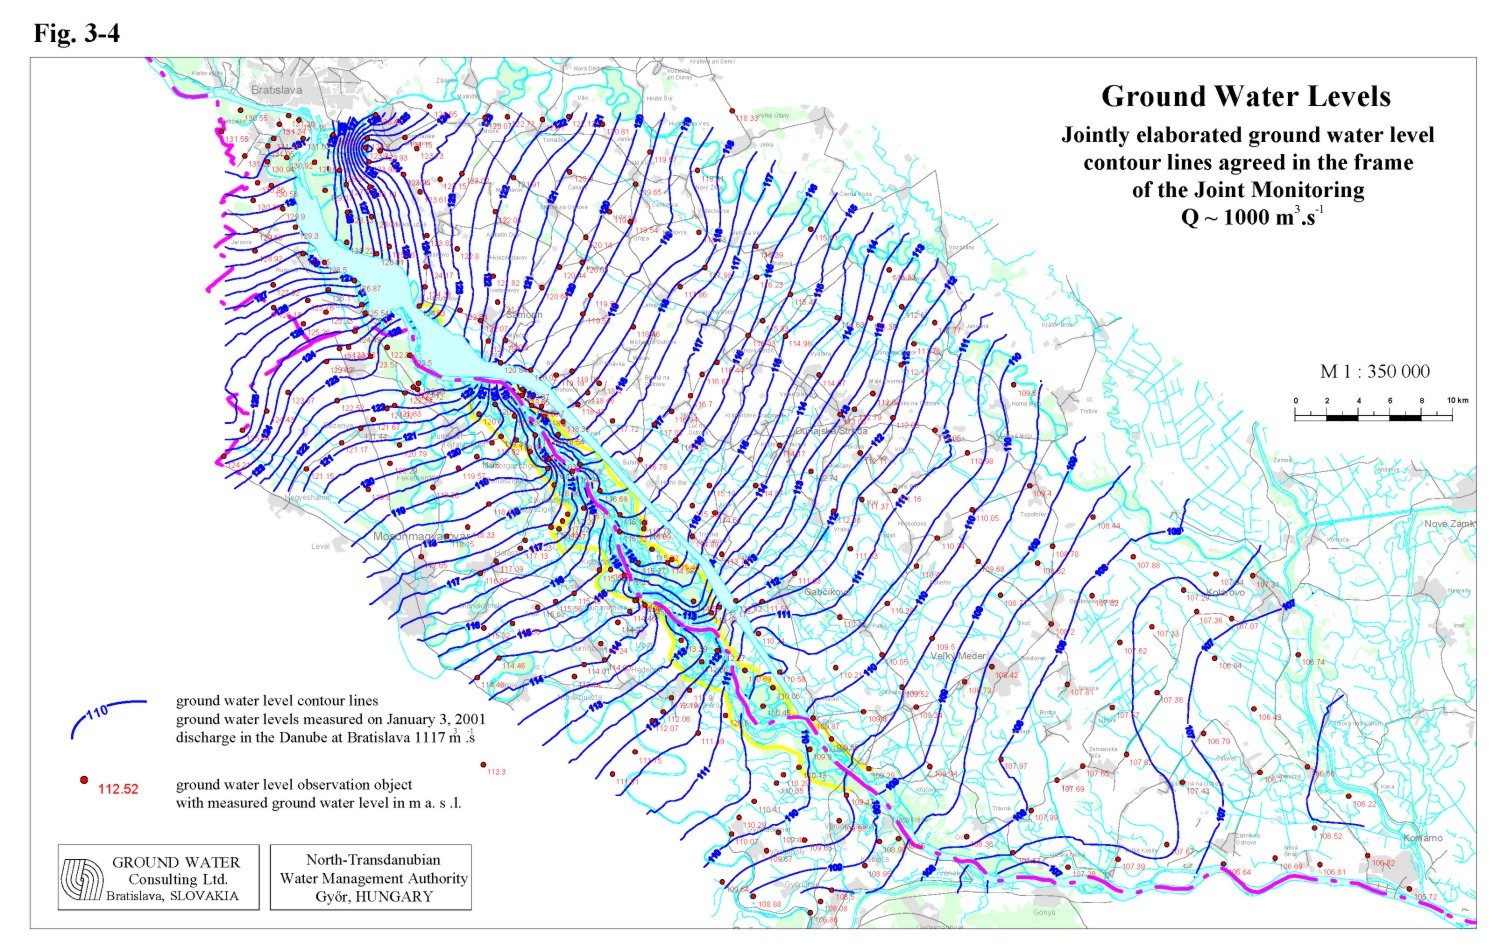
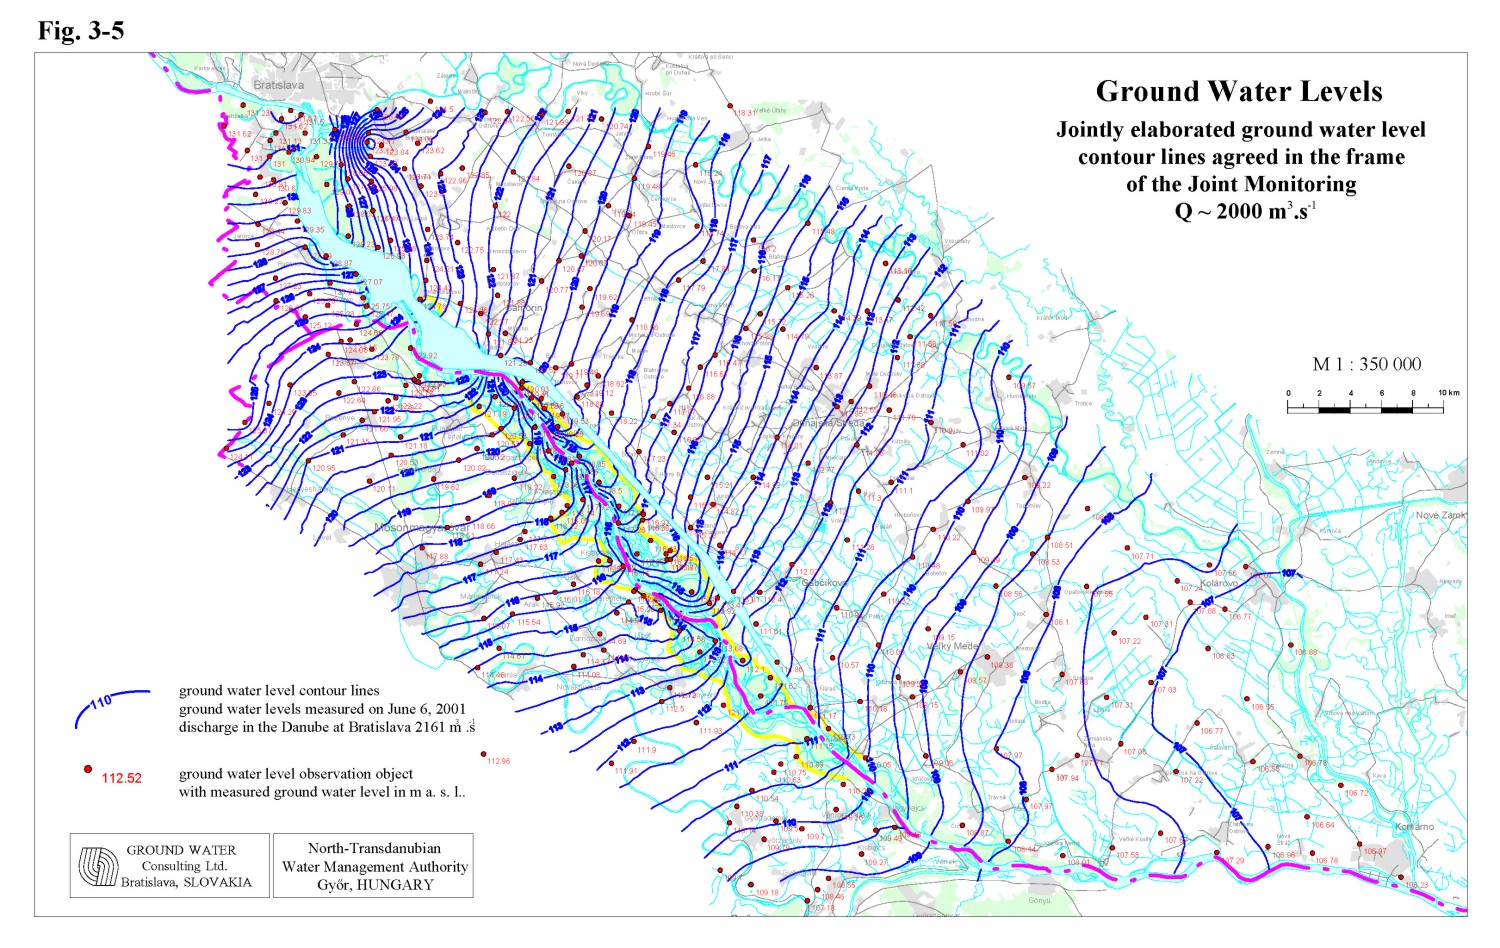
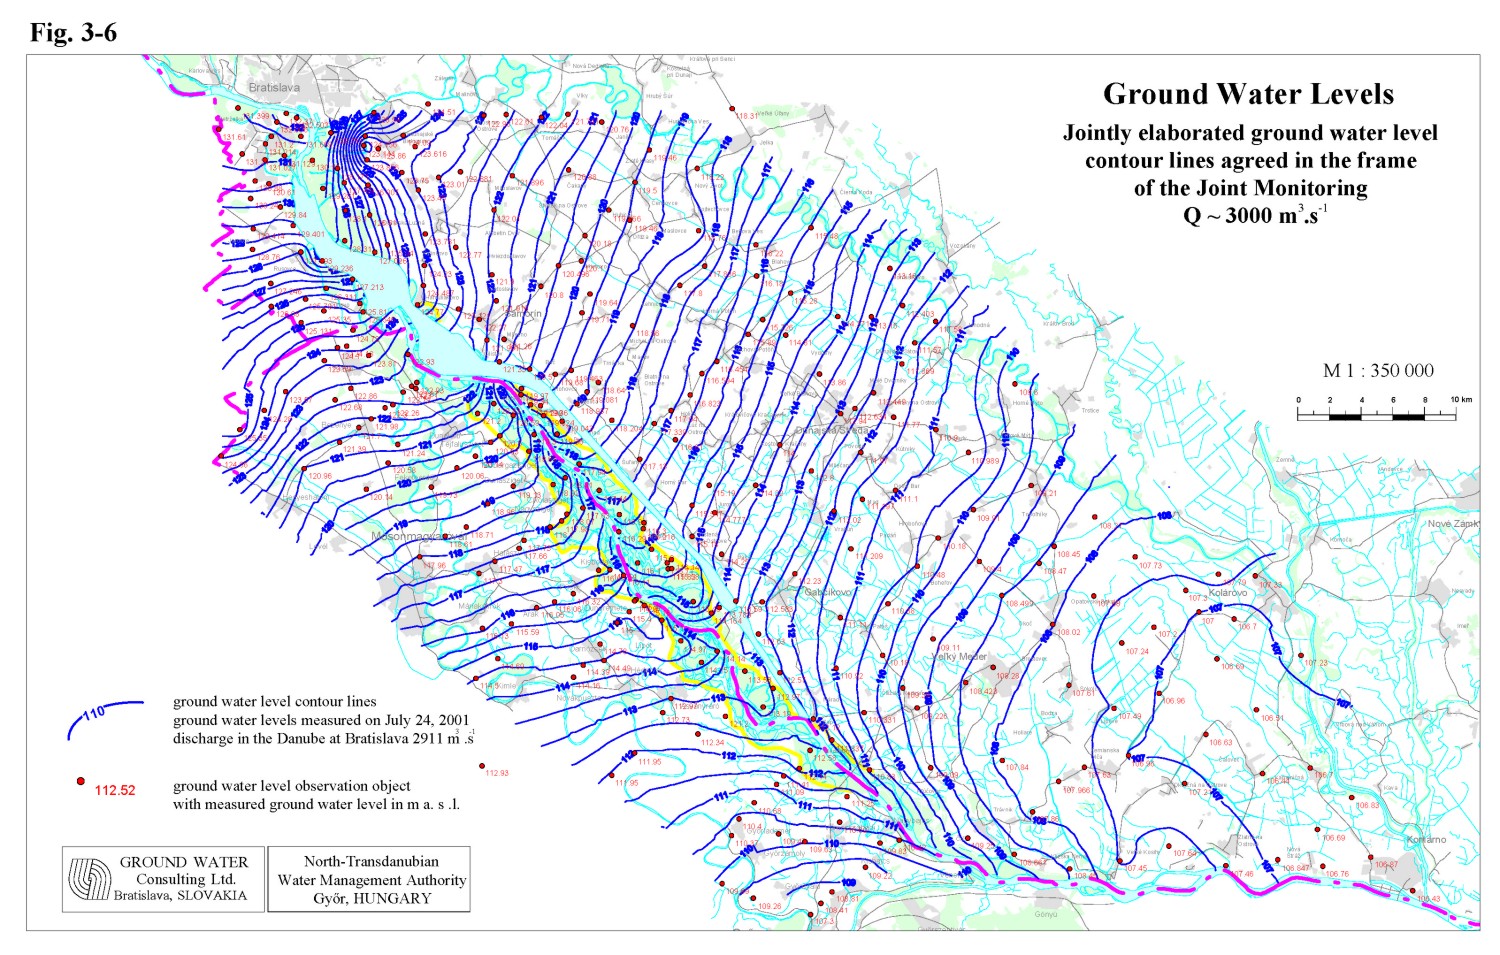
3.1. Joint evaluation of the ground water regimeThe ground water levels in the area influenced by the water supply depends mainly on the water level fluctuation in the Danube, water level in the reservoir and water levels in the river branches. For computing the ground water level differences comparable hydrological situations were chosen in the period before and after introducing the water supply. Three different hydrologic situations were selected to characterise the low, average and high discharge conditions in the Danube, corresponding to discharges approximately 1000, 2000 and 3000 m3.s-1. The selected dates and the corresponding discharges in the Danube at Bratislava-Devín gauging station are the following Tab. 3-1, Fig. 3-2, Fig. 3-3a and Fig. 3-3 b: Table 3-1
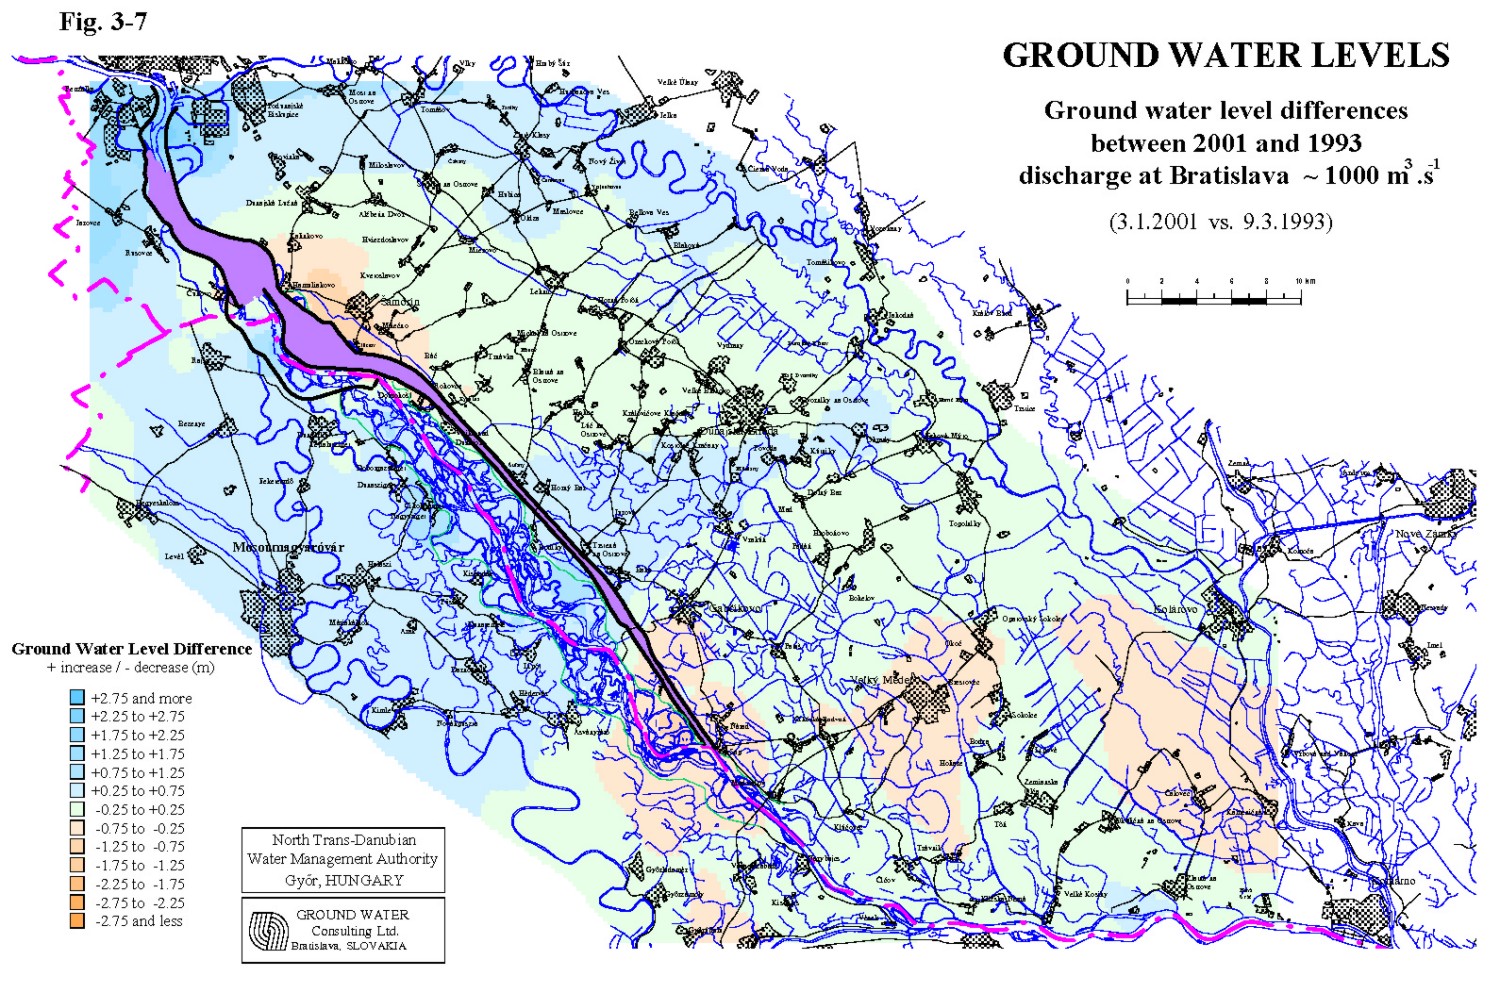
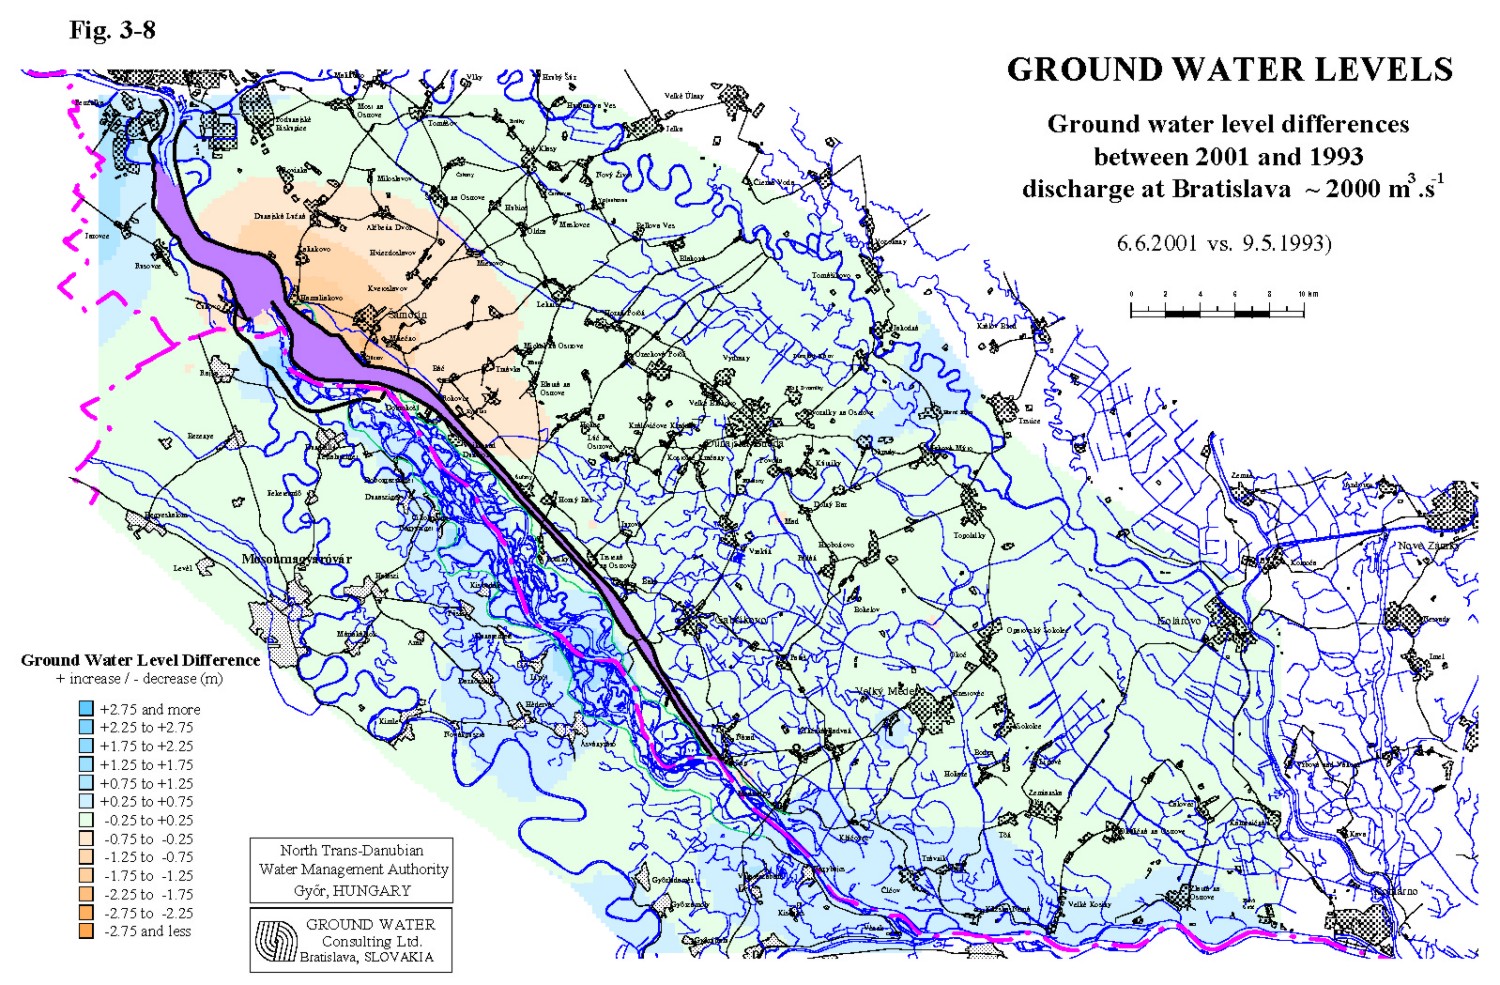
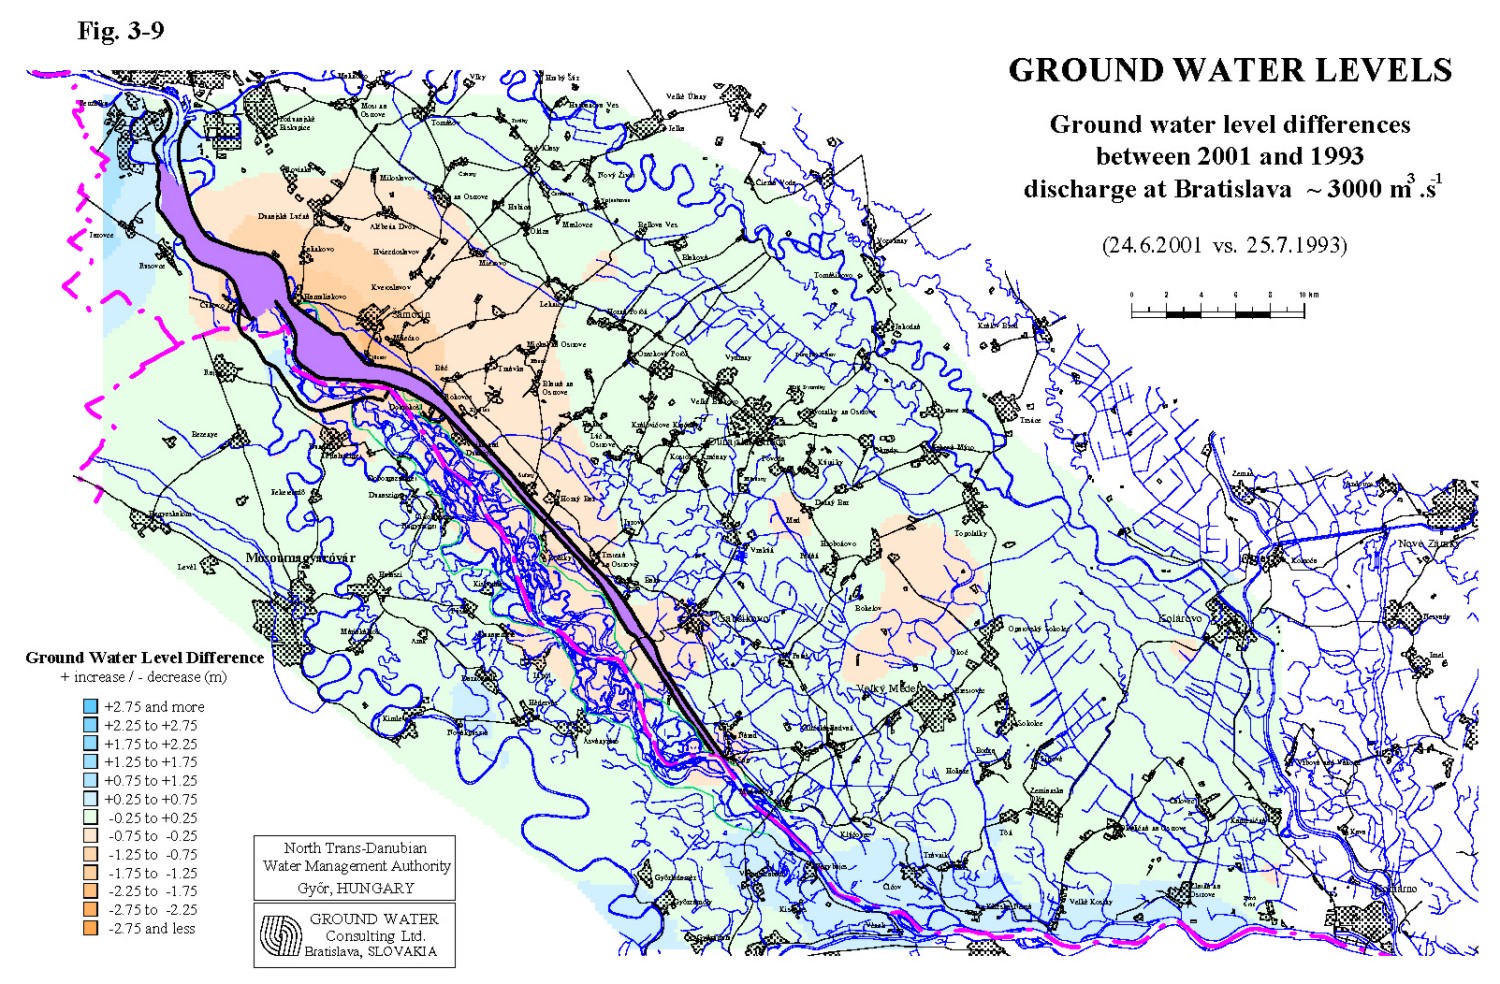
In the hydrological year the low discharge period was chosen at the beginning of January, when the low water period ended. The average discharge period was chosen in the first decade of June, in a comparable hydrological situation as the period chosen in 1993. The high discharge period was chosen at the end of June, when the preceding hydrological situation was similar to that in 1993. In the chosen periods comparable climatic conditions were present as well. Maps of equipotential lines were jointly constructed for the selected dates using the measured ground water levels (Fig. 3-4, Fig. 3-5 and Fig. 3-6). In wells where the water level is measured once a week the ground water level for the selected dates were computed by linear interpolation. In the all other wells the daily average value was used. The altitudes of the ground water levels are given on maps for each observation object used for the equipotential line construction. For the equipotential lines construction computed surface water level data in the Danube were used as well. These levels were computed by calibrated model, using river morphology data and measured water level data on given stretch. The other surface water levels were not used for construction of the equipotential lines. The constructed equipotential lines represent general ground water levels and do not show local influences of the channels or river branch systems. Differences between ground water levels for selected comparable hydrological situations are expressed in Fig. 3-7, Fig. 3-8 and Fig. 3-9. The evaluation is mainly focused to the area influenced by the technical measures and discharges according to the intergovernmental Agreement and by the water supply realised on the Hungarian side. The inundation and the flood-protected area on the Hungarian side, and partly by the inundation area on the Slovak side represent the influenced area in this sense. Low discharge conditions Comparing the hydrological situation in periods before and after realising the technical measures and releasing discharges according to the Agreement (2001 versus 1993) it can be stated that as a consequence of increased water level in the Danube old river bed and water supply to the right side river branch system and to the Mosoni Danube on a major part of influenced area significant increase of ground water levels occurred, both on the flood-protected area and inundation area as well (Fig. 3-7). Comparing to the year 1993 higher ground water levels at low discharge conditions were created in the upper and middle part of the Szigetköz area. Significant increase of ground water level occurred also along the Mosoni Danube and in the lower part of Szigetköz area. In the area around Bagoméri river branch system, where the water supply is still not solved, the ground water levels were similar to levels in 1993. This region is influenced by the drainage of the tailrace canal. In general, the increase of ground water levels is about 0.5-1.0 m. It occurs mainly in the area affected by the water supply realised on the Hungarian side. There is increase of ground water levels in the inundation area on the Slovak side as well, which is evoked by the water supply on the Slovak side, however this is independent on the measures according to the Agreement. On the left side of the reservoir a decrease can be observed. This is connected with lower water level in the reservoir comparing to the 1993 and decrease of permeability of the reservoir bottom as well. However, the ground water levels at present are much higher than before constructing the dam. Slight decrease of ground water levels upstream the confluence of the Danube old riverbed and the tailrace canal is caused by partial deepening of the tailrace canal and erosion of the Danube riverbed downstream of the confluence. Average discharge conditions Comparing the ground water levels in the period before realising the technical measures and increasing the discharges according to the Agreement and introducing the water supply on the Hungarian side at average discharge conditions in the Danube (approximately 2000 m3.s-1) the resulting effect is similar to that at low water conditions. Significant increase of ground water levels occurred in both, the upper and middle part of the Szigetköz area. The increase of ground water level is about 0.3-1 m (Fig. 3-8). Comparing to the year 1993 ground water levels in the lower part of the Ásványi and Bagoméri river branch systems have not been influenced significantly by the water supply and the ground water levels generally remained unchanged. Slight decrease of ground water levels can be observed downstream of the confluence of the Danube old riverbed and the tailrace canal, which is probably caused by riverbed erosion in this Danube stretch. On the Slovak territory no impact of the technical measures according to the Agreement appears. Decrease of ground water levels can be observed mainly around the left side of the reservoir. This results from lower water level in the reservoir comparing to the 1993 and decrease of permeability of the reservoir bottom as well, but in general the ground water levels are higher than before damming the Danube. Certain increase of ground water levels can be observed in the inundation area on the Slovak side as well, which is related to different water supply regime in the inundation area. On a large part of the Slovak side there were no change in ground water levels observed. High discharge conditions When comparing the high discharge conditions in the Danube (approximately 3000 m3.s-1) for the period before and after realising the measures according to the Agreement, generally no significant impact on ground water levels in the Szigetköz region can be presented (Fig. 3-9). On most of the area no change is documented, locally in the inundation area an increase or decrease up to 0.5-0.7 m occurred. However, in the Ásványi and Bagoméri river branch system decrease occurred, which is probably connected with the insufficient water supply in these regions. The ground water level decrease downstream the confluence of the tailrace canal and the Danube old riverbed is probably caused by riverbed deepening and related surface water level decrease. Changes in the area around the reservoir on the Slovak side are related to the lower water level in the reservoir and decrease of permeability of the reservoir bottom.
3.2. Conclusions In general it can be stated that the water supply of the right side river branch system plays an important role in influencing ground water levels over the Szigetköz region. As a result of the measures realised according to the intergovernmental Agreement significant increase of ground water levels occurred for low and average discharge conditions in the Danube. However, no significant changes in the upper and middle part of the Szigetköz region and decrease of ground water levels in the lower part is characteristic for the high discharge condition. The ground water level decrease in this region (area around the Ásványi and Bagoméri river branch systems) could be solved by extension of the water supply system to these areas. This can help to increase the ground water level and improve the situation in this region. Increase of ground water levels in the strip along the Danube old riverbed on both side could be ensured only by increasing water level in the Danube by measures realised in the riverbed. The most simple, quickly realisable seems to be the solution applied at Dunakiliti at rkm 1843, realised according to the “Agreement”.
|
||||||||||||||||||||||||