PART 2
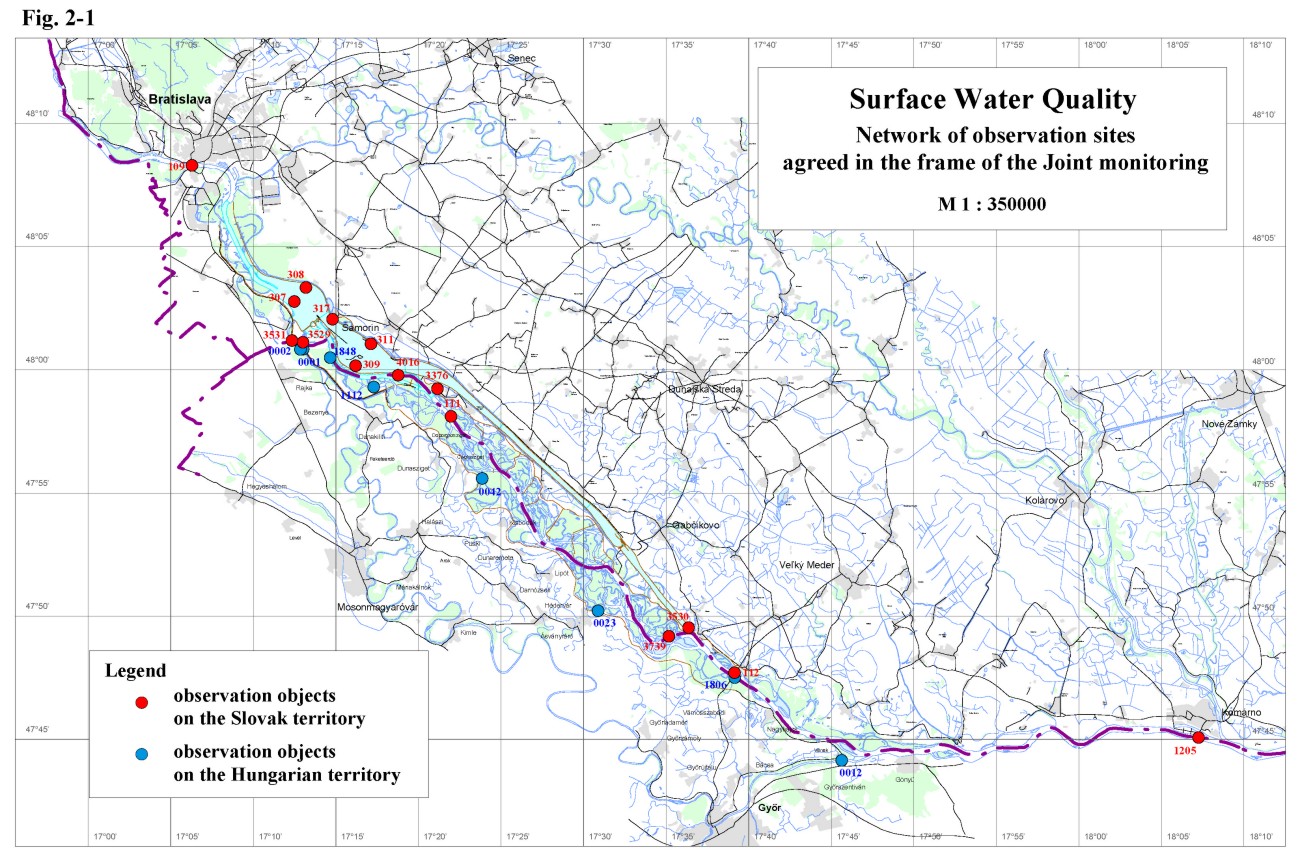
Surface Water QualitySurface water quality measurements in 2001, according to the Agreement, were carried out at 8 monitoring sites on the Hungarian territory and at 15 monitoring sites on the Slovak territory - Table 2-1, Fig. 2-1. At all of monitoring sites the influence of the measures, described in the Agreement, on the surface water quality was observed. Main factors which could influence the water quality are: the backwater effect upstream of the bottom weir, the increased discharges into the Danube downstream of the Čunovo dam and into the Mosoni branch of the Danube, the water supply into the right side river arm system, and morphological changes in the riverbed. Sampling and analysing were mainly performed according to methods agreed by the Sub-commission for Water Quality Protection of the Slovak-Hungarian Trans-boundary Water Commission. Surface water quality and sediment quality data for agreed monitoring sites are given in the Annexes to the Slovak and Hungarian National Reports on the Environment Monitoring in 2001. The evaluation was done for the hydrological year 2001 compared to the previous long-term surface water quality development. The time series diagrams for the respective parameters of the surface water quality are given in the Annexes to the National Reports. In the evaluation the agreed limit values for surface water quality, agreed on LV. session of the Slovak-Hungarian Trans-boundary Water Commission, were used (Table. 2-2). Table 2-1: List of monitoring sites
Table 2-2: Agreed limits for surface water quality classification
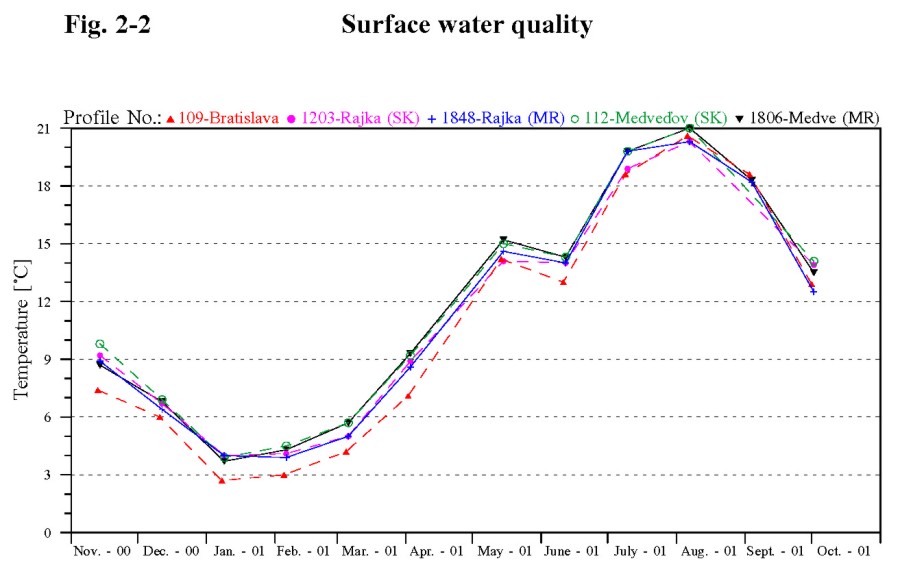
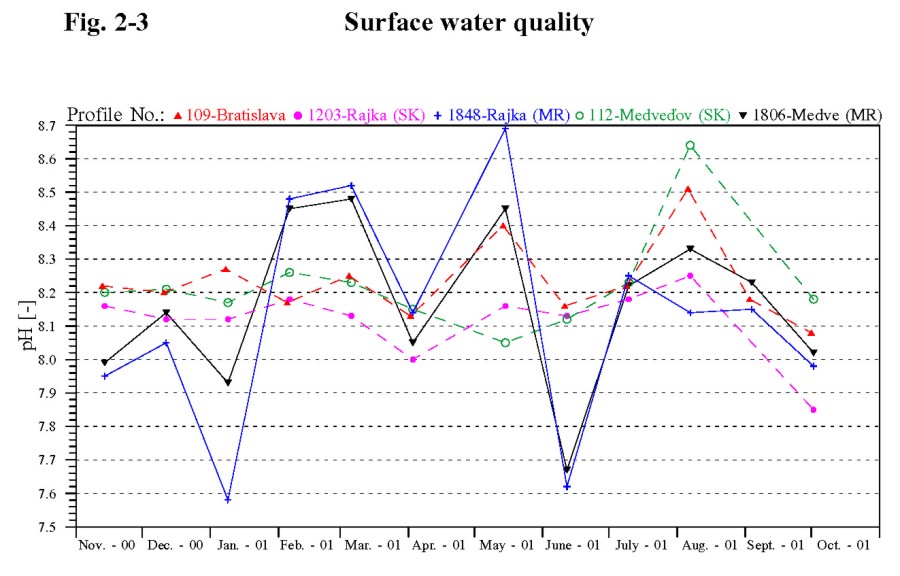
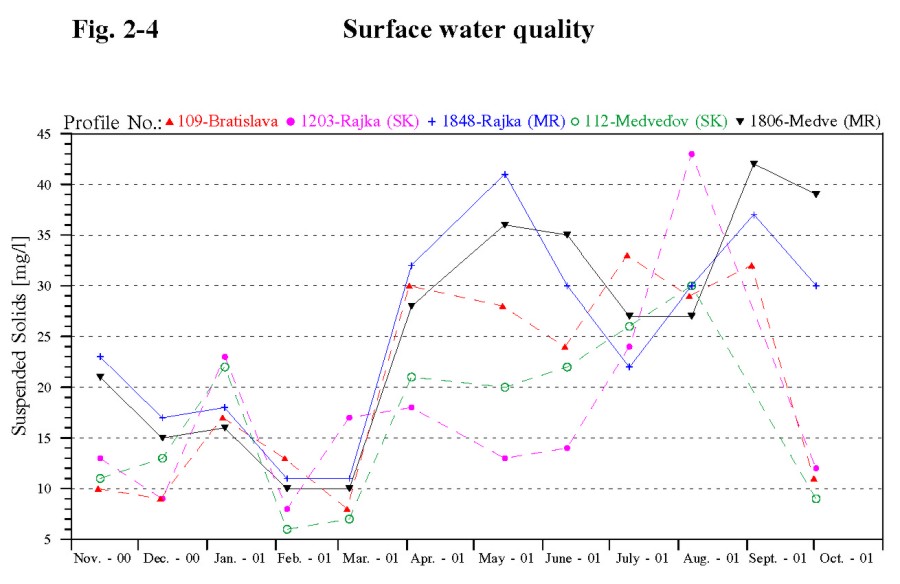
2.1. Basic physical and chemical parametersWater temperature The water temperature fluctuation in the whole Danube stretch downstream of Čunovo follows the water temperature course observed in the Danube at Bratislava (sampling site No. 109). In the actual year it fluctuated in the range from 0 to 25 °C, while maximum values occurred in August and minimum values in January. The water temperature in the seepage canal was different, just as in the previous years. In the winter period it was warmer (by 2-4 °C) and in the summer period cooler (by 1-2 °C), because the seepage canal is supplied by the ground water. The water temperature in the right side river branch system and in the Mosoni Danube was due to slower flow velocity warmer by 2-3 °C in the summer period than the water temperature of the Danube. The water temperature in the Danube for hydrological year 2001 is documented in Fig. 2-2. pH The pH value indicates the alkalinity of water. Higher values occur in seasons corresponding with periods of increased assimilation activity of phytoplankton. Resulting from the decreased assimilation activity in winter period the pH values were lower than in summer period. The Danube water pH values in the hydrological year 2001 fluctuated in the range from 7.58-8.69, while the higher value occurred during the algae growth (mainly in May and August). The pH values in the river branch system and in the Mosoni Danube fluctuated between 7.49 and 8.94 and during the hydrological year sudden decreases and increases occurred. The minimum value was recorded in the Mosoni Danube at Vének during the flood, the maximum value occurred in the Ásványi river branch in May. The pH values in the seepage canal varied from 7.6 to 8.3. Hungarian and Slovak values measured at the same locations are documented in Fig. 2-3. Electric conductivity The electric conductivity of the surface water refers to the dissolved solids content of mineral origin. The conductivity values in the Danube and in the right-side river branch system in 2001 in principle follows the conductivity values at the Bratislava profile (No. 109) and fluctuated between 28.4 to 50 mS.m-1. Higher salinity was characteristic for the beginning of spring, while the following decrease of conductivity occurred during higher discharges because of dilution. The dissolved solids content in the Mosoni Danube at Vének profile is higher comparing to the other water bodies (it is connected to the impact of the affluents and also due to the loads coming from the wastewater). However, it did not reach the values from previous years and fluctuated in the range from 38 to 56 mS.m-1. The electric conductivity values in the seepage canal, similarly to the previous years, fluctuated in the range from 35 to 47 mS.m-1. Suspended solids The suspended solids content is closely related to the discharge. The suspended solids content fluctuations during the hydrological year 2001 in the whole Danube stretch downstream of Čunovo follow the suspended solids content fluctuation in the Danube at Bratislava (No. 109). However, the reservoir, situated downstream of Bratislava, depending on the actual discharge and flow velocity, play relevant role in settling and in removing of suspended solids. The suspended solids content values mainly fluctuated in the range from 6 to 44 mg.l-1. Three samples taken at the Bratislava sampling site during the flood periods (March, June and July) exceeded the 50 mg.l-1, which represents the IV. water quality class. In the seepage canal the content of suspended solids fluctuated between 1-28 mg.l-1. The suspended solids content along the longitudinal profile of the right side river branch system showed slight decrease, similarly to previous years. In the Mosoni Danube at Vének profile the suspended solids content increased from 10 mg.l-1 in March to 68 mg.l-1 in September, while the measured values in August and September exceeded the value of 50 mg.l-1. The course and fluctuation of the suspended solids content is documented in the Fig. 2-4. Basic physical and chemical parameters - summary The basic physical and chemical parameters in the Danube and river branch system connected to the Danube main riverbed show seasonal variation and some of them predominantly depend on the discharges. The suspended solids content fluctuations in the whole Danube stretch downstream of Čunovo follow the suspended solids content fluctuation in the Danube at Bratislava (No. 109). However, the reservoir, situated downstream of Bratislava, depending on the actual discharge and flow velocity, play relevant role in settling and in removing of suspended solids. The fluctuation of basic physical and chemical parameters in the Mosoni Danube and right side seepage canal reflect the different characteristics of these water bodies. The water quality in the Mosoni Danube is influenced by its affluents and wastewater from Győr; the water in the seepage canal is influenced mainly by the leaking ground water. No significant changes in the water quality were recorded in the hydrological year 2001 in comparison to the previous year.
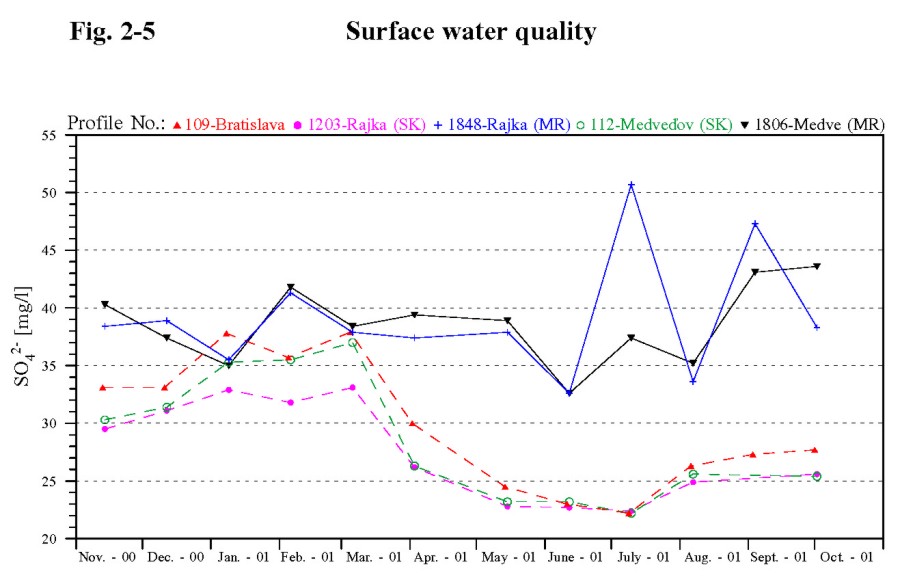
2.2. Cations and AnionsThe quantitative ratio of the ionic composition of the Danube water during the hydrological year 2001 showed high stability, just as in previous years. The seasonal fluctuation of the quantitative ratio of the ionic content followed the changes in salinity (first of all changes of magnesium, calcium, sodium, chloride and hydro-carbonate ions), which is related to the discharge fluctuations in the Danube. Comparing to the long-term measurements the values of basic cations and anions have not changed. The course of the sulphates concentrations measured by the Slovak and Hungarian Party is showed on Fig. 2-5. The most stabile ionic content was characteristic to the seepage water. The higher dissolved solids contents in the Mosoni Danube downstream of Győr occurred in relation with higher concentration of sodium, magnesium and sulphate ions in the first half of the hydrological year.
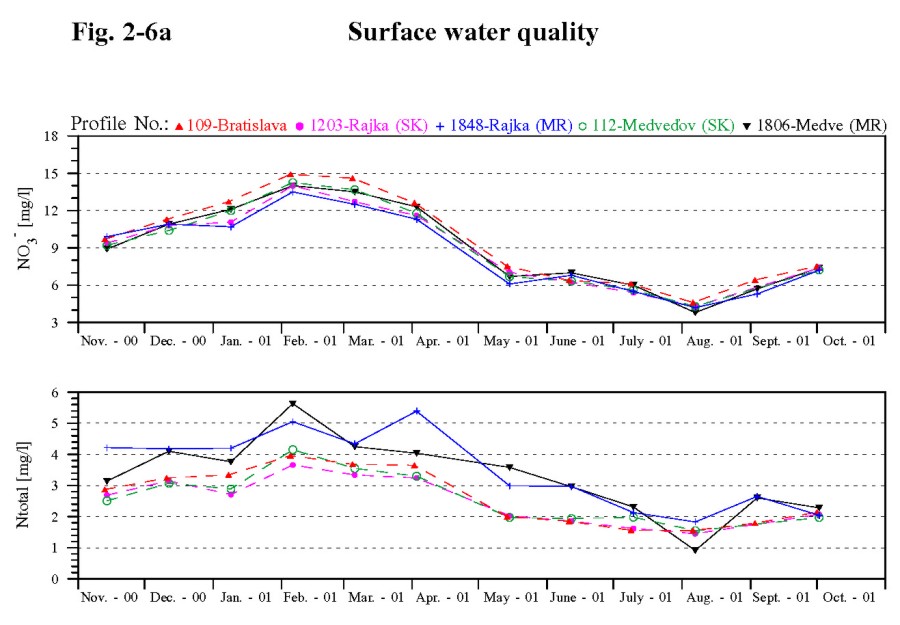
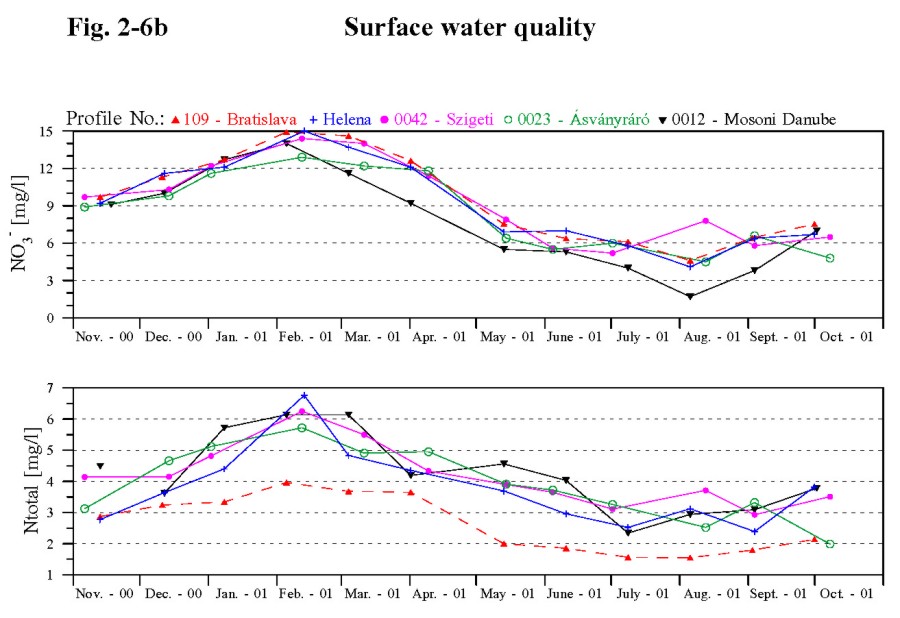
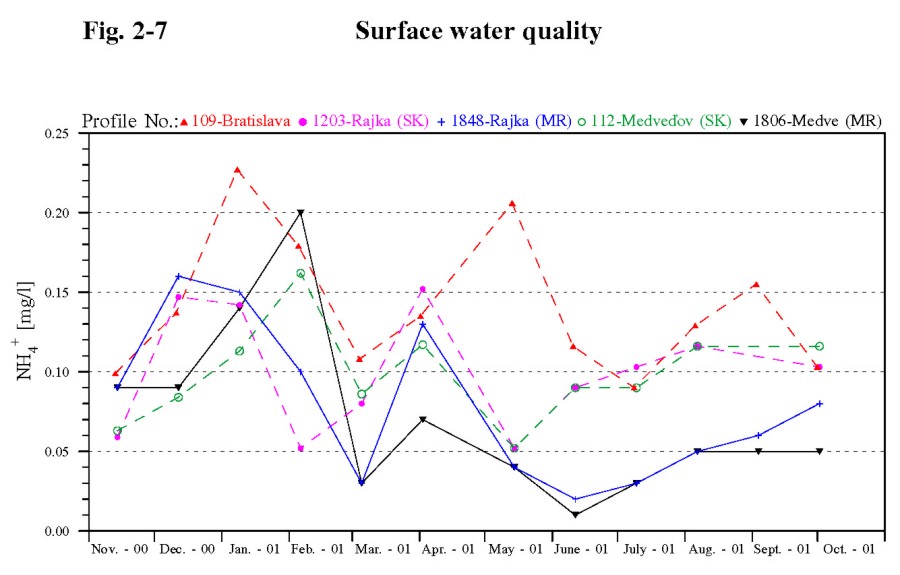
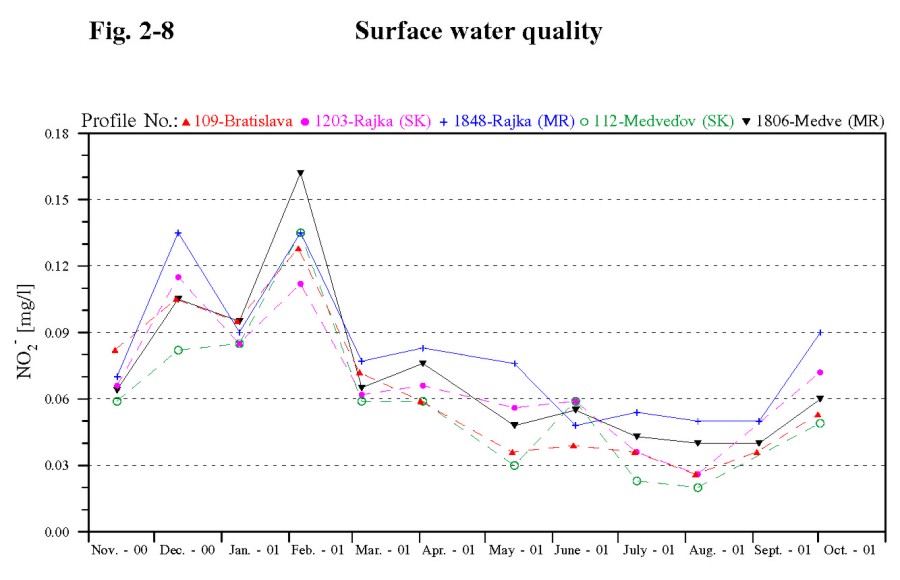
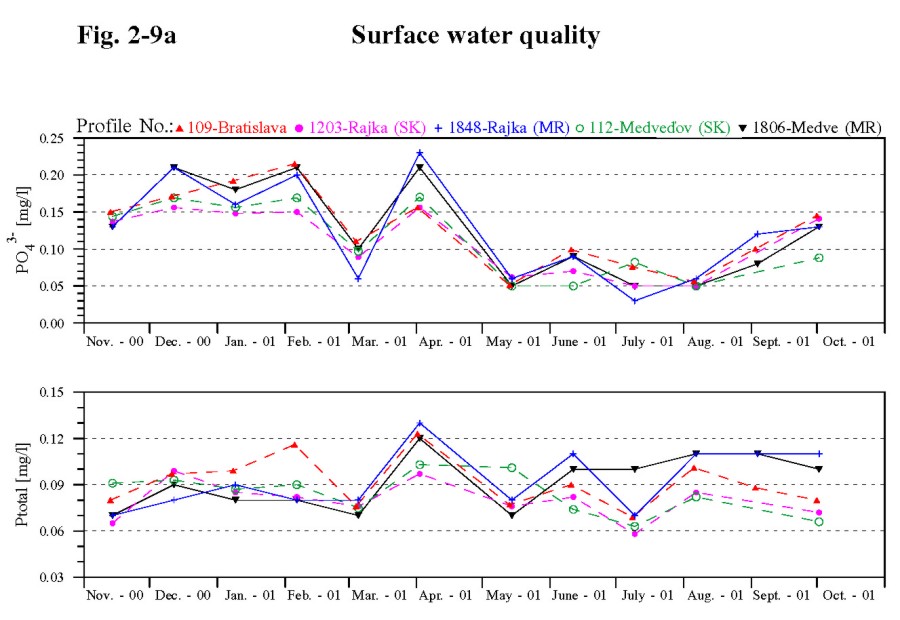
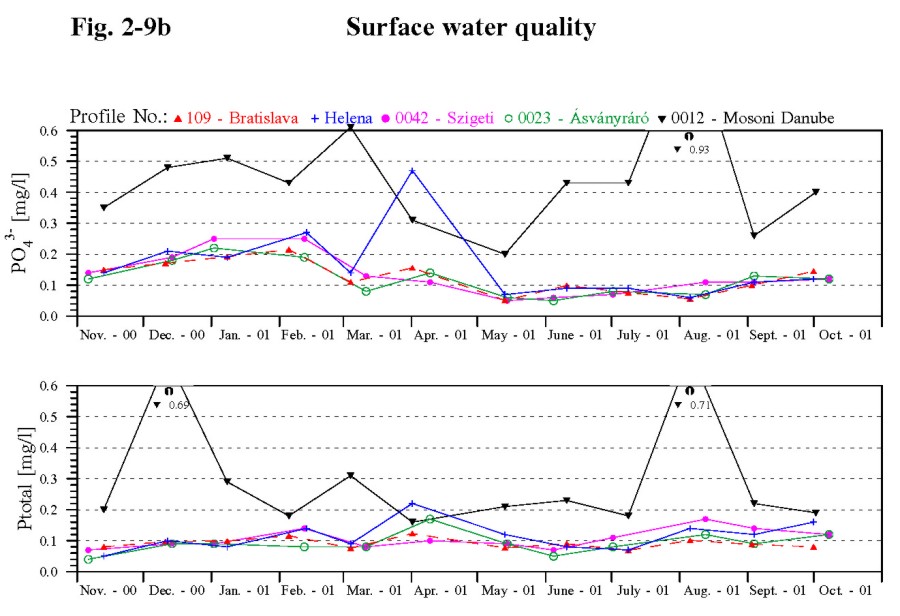
2.3. NutrientsNitrates Nitrates concentrations in 2001 at all monitoring sites in the Danube as well as in the right-side river branch system show seasonal fluctuation. Values mainly fluctuated in the range from 3 to 16 mg.l-1 (Fig. 2-6a and Fig. 2-6b). The nitrates concentrations in the Mosoni Danube fluctuate similarly to the other monitoring sites; the maximum (14 mg.l-1) was observed in February, minimum in August (1.7 mg.l-1). The values in the seepage canal in 2001 equally fluctuated in the range from 2.5 to 9.7 mg.l-1. Ammonium ion In the hydrological year 2001 the ammonium ion concentrations at all measured sites in the Danube, except Bratislava sampling site, and in the right-side river branch system, except the Vének profile situated on the Mosoni Danube, vary mainly from 0.01 to 0.2 mg.l-1. Comparing to the other water bodies higher values of ammonium ion concentration during the observed period occurred at the Bratislava profile (No. 109) and fluctuated from 0.064 to 0,371 mg.l-1 (Fig. 2-7). In general higher concentrations occur during the periods with lower water temperature due to the slower nitrification processes. The ammonium ion concentrations are the lowest in the seepage canal, where varied from 0.1 to 0.12 mg.l-1. The ammonium ion concentration in the Mosoni Danube at Vének profile was in the winter period several times higher than the concentrations observed on the other profiles (maximum value 1.02 mg.l-1 was measured in January). Nitrites The nitrite ions concentrations, considered as a temporary product of nitrification and denitrification processes, showed a seasonal variation and fluctuated in the range from 0.02 to 0.16 mg.l-1 - Fig. 2-8. In the right side river branch system one extremely high value occurred in the Szigeti river branch in February, when concentration of nitrites reached 0.32 mg.l-1. Total nitrogen The total nitrogen content is predominantly affected by the fluctuation of the nitrate-nitrogen and organic nitrogen concentrations, which results from the quantitative ratio of nitrogen forms. The tendency of fluctuations of the total nitrogen in the Danube, Mosoni Danube and in the right side river branch system was similar to each other. Comparing to the previous year a slight increase of the total nitrogen values can be observed in the right side river branch system. The total nitrogen concentrations in the Danube fluctuated from 0.91 to 5.63 mg.l-1; in the right side river arm system and in the Mosoni Danube the concentrations varied from 2 to 6.76 mg.l-1 (Fig. 2-6a and Fig. 2-6b). The lowest amount of total nitrogen was found in the seepage canal (from 1 to 4.08 mg.l-1). Phosphates In the hydrological year 2001 the phosphate concentrations slightly decreased in comparison with the previous year. At all of the sampling sites, except the Vének profile on the Mosoni Danube, phosphates fluctuated from 0.03 to 0.27 mg.l-1 (Fig. 2-9a and Fig. 2-9b). Higher value occurred once at Helena profile in April, when it reached 0.47 mg.l-1. In general high values of orthophosphates concentrations occur during floods and in the winter period, lower values are characteristic for the vegetation period. The concentrations of phosphates on the Mosoni Danube, due to the higher pollution fluctuated from 0.2 to 0.93 mg.l-1. The lowest phosphate concentrations occurred in the seepage water (from 0.01 to 0.15 mg.l-1). Total phosphorus Concentration changes of the total phosphorus followed the concentration changes of phosphates. The effect of flood waves can also be observed, since the phosphorus content mainly bound to the suspended solids results in increase of total phosphorus concentrations. The total phosphorus concentration on all profiles, except the profile at Vének, situated on Mosoni Danube, fluctuated in the range from 0.02 to 0.2 mg.l-1 (Fig. 2-9a and Fig. 2-9b). Total phosphorus concentrations at Vének fluctuated in the range 0.16-0.3 mg.l-1, however two extremely high values occurred in December 2000 (0.69 mg.l-1) and in August 2001 (0.71 mg.l-1). The lowest concentrations of total phosphorus occurred in the seepage water (0.01-0.09 mg.l-1). Nutrients - summary The concentration of anions containing nitrogen and phosphorus slightly increased in the period of 1993-1996 on each of the monitoring sites on the Danube. The period 1997-2001 is characteristic by lowering and stabilisation of nutrients content (monitoring site No. 109). Decrease of nutrients content in the Bratislava section of the Danube is probably connected with decrease of pollution coming from the upper watershed of the Danube to this area. Similar situation in the period 1997-1998 could be observed on the Danube at Medveďov. In 1999 slight increase of nutrients was detected and their concentrations have not changed during the years 2000-2001. Since introducing the water supply the content of nutrients in the right-side river branch system follows the fluctuation in the Danube. The nutrients content in the Danube water is potentially sufficient for development of eutrophic processes under other suitable conditions.
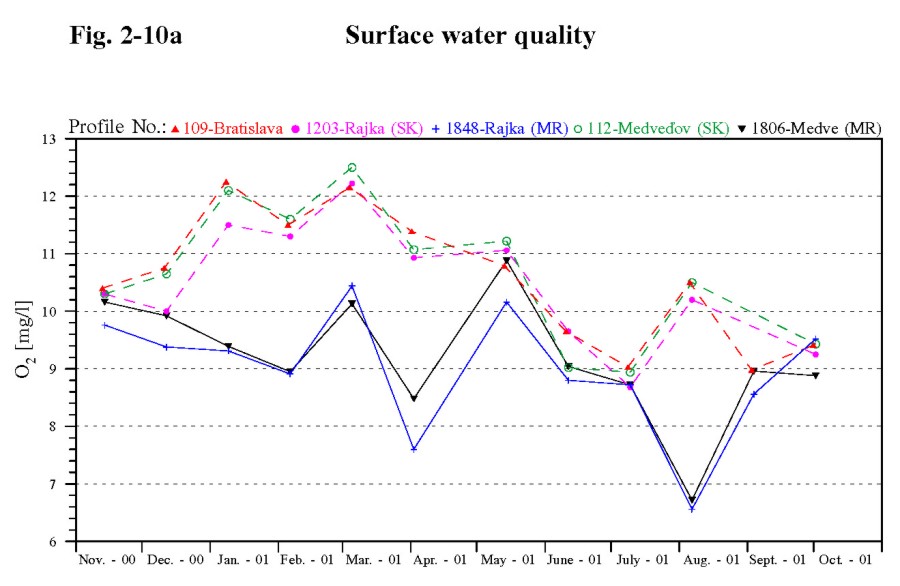
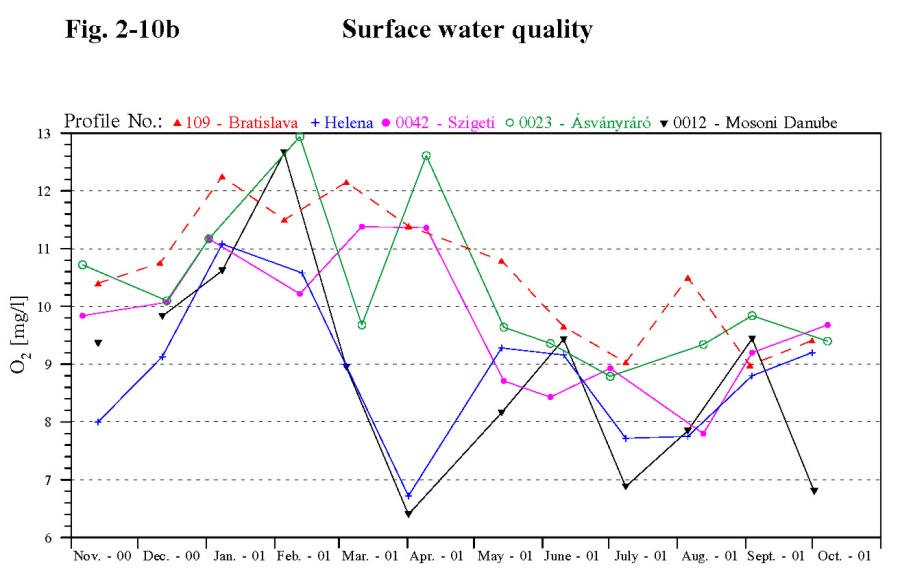
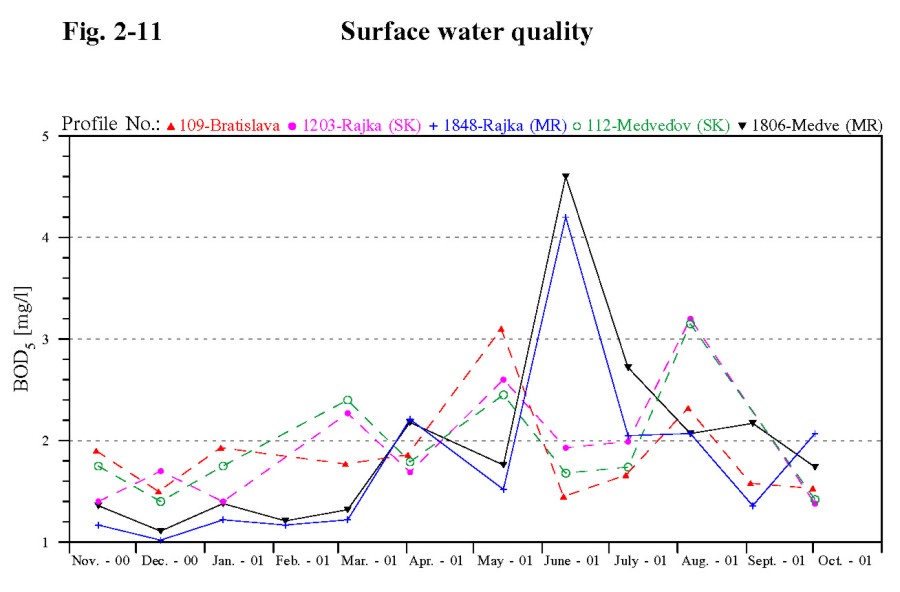
2.4. Oxygen and organic carbon regime parametersDissolved oxygen In the hydrological year 2001 the dissolved oxygen concentration at monitoring sites on the Danube measured by the Slovak party fluctuated from 8 to 14 mg.l-1, at monitoring site No. 308 up to 18 mg.l-1. The dissolved oxygen concentration measured by the Hungarian Party varied from 6.56 to 10.88 mg.l-1. Fluctuation of the dissolved oxygen content at selected profiles is documented on Fig. 2-10a. Generally higher values occur in winter period, while the lower values occur in the summer. The dissolved oxygen content proportionally decreased with increasing water temperature in the Danube. Besides this the dissolved oxygen content depends on the assimilation activity of phytoplankton. During the measurements the dissolved oxygen content in the right side river branch system in the first half of the year were more favourable then in the Danube main riverbed. The fluctuation of the dissolved oxygen content was more variable in comparison to the previous year. The concentrations fluctuated in the range from 6.72-13 mg.l-1. In the right-side river branch system due to the continuous water supply the dissolved oxygen content follow the course of dissolved oxygen values in the Danube river (Fig. 2-10b). The oxygen concentrations in the Mosoni Danube at Vének profile were slightly higher than in the previous year and fluctuated from 6.4 to 12.66 mg.l-1. Critical oxygen deficient conditions in the Mosoni Danube did not occurred during the evaluated period. CODMn and BOD5 COD and BOD parameters are used for expressing the organic contamination of the water, they indicate the chemically and biologically degradable organic matter content. In the hydrological year 2001 the COD values at all measured profiles fluctuated from 1 to 6 mg.l-1. Higher value was measured in one occasion at Bratislava sampling site (No. 109) when it reached 7.76 mg.l-1 in March. The COD values in the right side river branch system were slightly lower comparing to the Danube water and fluctuated from 2 to 4.6 mg.l-1. The maximum value at Helena profile was measured in March (4.4 mg.l-1), at Szigeti and Ásványi river branches in July (4.6 mg.l-1). The organic matter content in the seepage canal is low in long-term and in 2001 fluctuated from 1 to 3 mg.l-1. The BOD values of the Danube water fluctuated in the range from 1 to 3 mg.l-1, except values measured at Rajka and Medveďov in June (4.6 mg.l-1). The BOD values in the river branch system are lower comparing to the Danube water. Higher COD and BOD values usually occur in periods with increased discharges in the Danube, when the water contain higher amount of natural organic matter. The seepage water was found to be scare in organic material, the BOD fluctuated from 0.5 to 2.3 mg.l-1. In the Mosoni Danube at Vének, similarly to the previous years the COD and BOD values were higher because of the partially treated wastewater from the Győr (COD 3-5.5 mg.l-1, BOD 1.3-6.3 mg.l-1). Oxygen and organic carbon regime parameters - summary During the hydrological year 2001 the dissolved oxygen contents were usually favourable and generally the organic carbon content was small. The oxygen and organic carbon related parameters in the Danube reflect the seasonal assimilation activity of the phytoplankton and organic carbon oxidation processes. The measured data (1992-2000) indicate decreasing tendency of organic load at the Bratislava section of the Danube. This phenomenon is the consequence of substantial wastewater treatment improvement in the upstream Danubian countries. Higher values of oxygen regime parameters (CODMn, BOD5) occurred in period of higher discharges in the Danube. The oxygen regime parameters at Vének are influenced by local pollution (pollution originating from city Győr) together with hydrological conditions at confluence with the Danube.
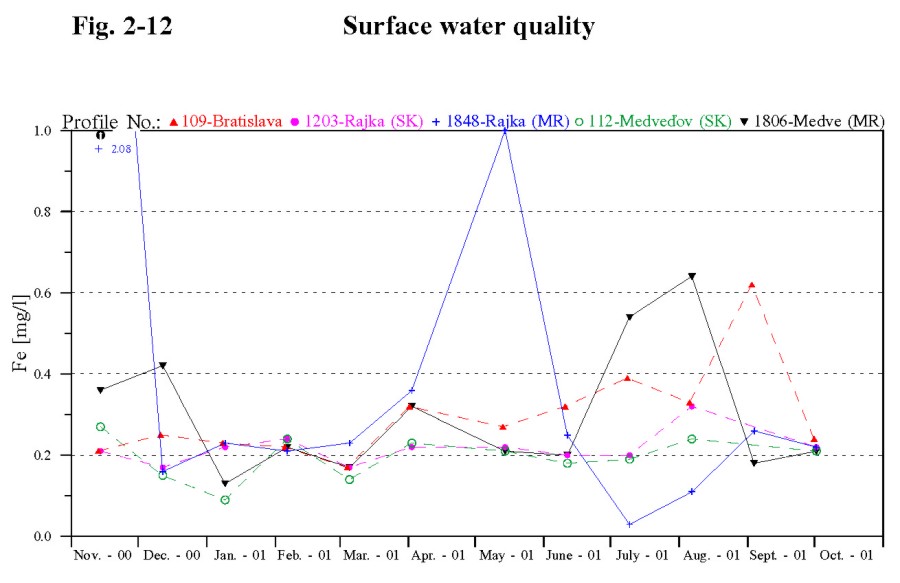
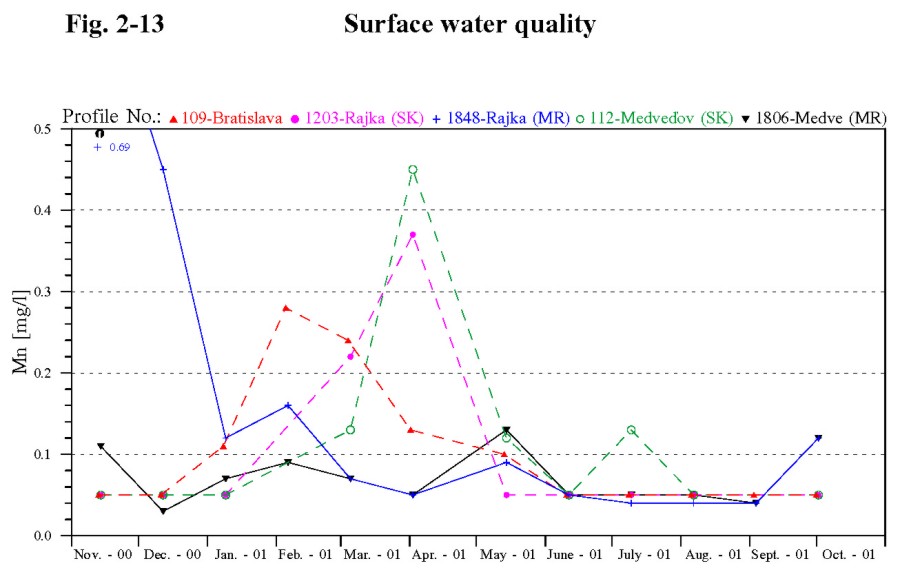
2.5. MetalsIron The amount of suspended solids influences the iron content in the surface water. The mutual coherence of iron concentrations and suspended solids content in surface water is documented by the highest concentrations of iron measured at the time of highest suspended solids content. In 2001 the iron concentrations on all measured sites on the Danube fluctuated mainly up to 0.7 mg.l-1, in one occasion reached the value of 1.19 mg.l-1 at Bratislava. The iron concentrations in the right side river branch system mostly fluctuated up to 0.4 mg.l-1. Only in April there were measured higher value at Helena profile (0.49 mg.l-1) and in July in the Szigeti arm (0.72 mg.l-1). The iron concentration in the seepage water fluctuated in narrower range from 0.03 to 0.2 mg.l-1. In the Mosoni Danube at Vének profile is the iron content always higher due to the character of catchment area (the water in the Rába river is rich in iron). In hydrological year 2001 it fluctuated from 0.14 to 0.69 mg.l-1. Manganese Manganese, similarly to iron, occurs in surface water mainly in solid phase. The manganese concentrations in the Danube water mostly fluctuated in the range up to 0.3 mg.l-1. However, in November 2000 an extreme value was measured at Rajka profile (0.69 mg.l-1). The highest concentrations of manganese were measured at the time of highest suspended solids content. The course of the manganese concentrations measured by the Slovak and Hungarian Party at selected profiles is documented on Fig. 2-13. The manganese concentrations at Vének profile on the Mosoni Danube fluctuated up to 0.1 mg.l-1, except two values: 0.38 mg.l-1 in November 2000 and 0.22 mg.l-1 in December 2000. Low concentrations were measured in the right side river branch system and in the seepage canal. Heavy metals The heavy metals concentrations in hydrological year 2001 usually fluctuated in the range of limits corresponding to the I. class of surface water quality. Similarly to the previous years, zinc was present in the highest concentration, followed by copper, chromium, nickel, cadmium, mercury and arsenic.
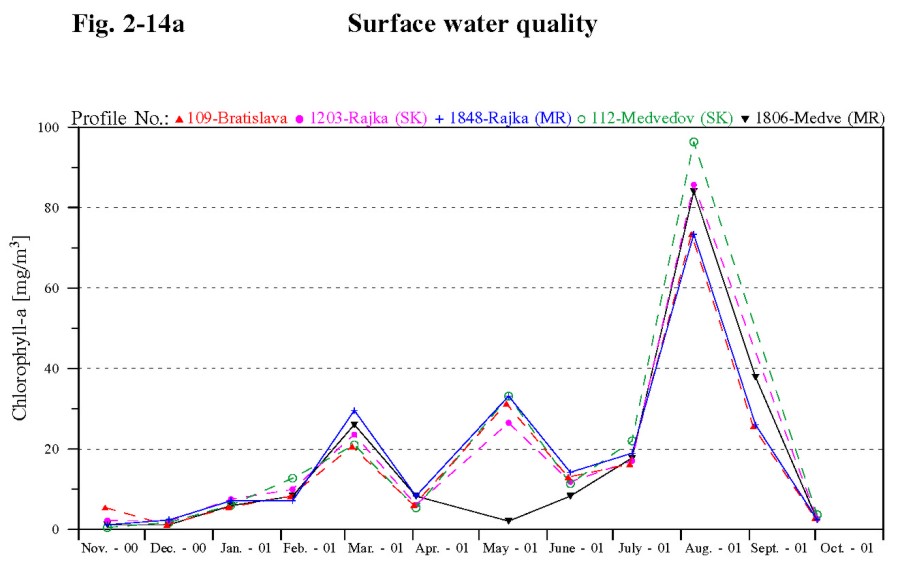
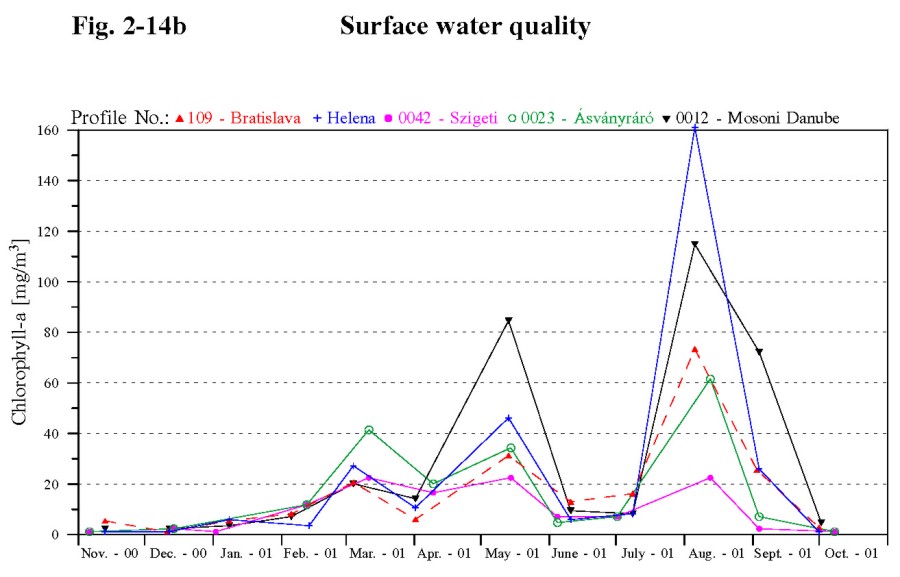
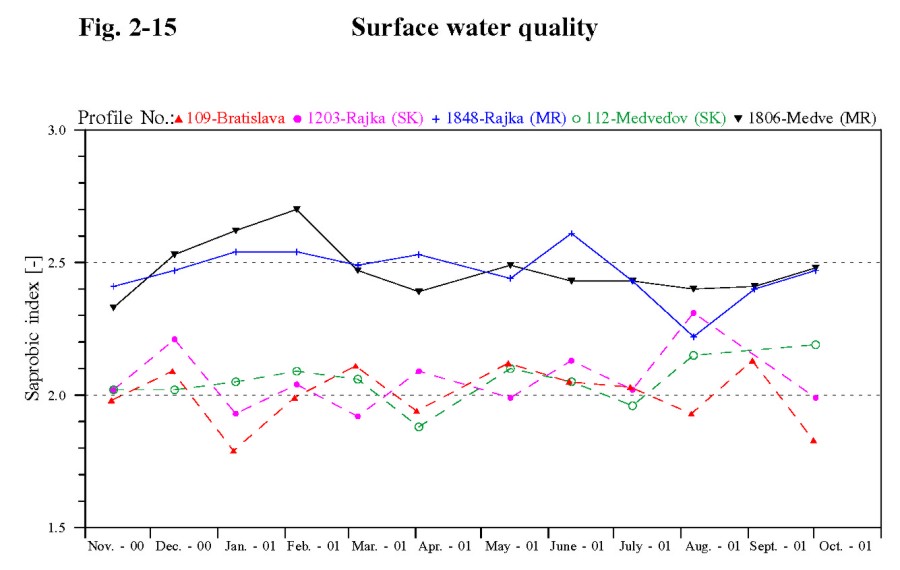
2.6. Biological and microbiological parametersColiform bacteria The surface water bacteriological pollution can be determined by the number of Coliform bacteria. In the year 2001 the number of Coliform bacteria at Bratislava profile (No. 109) fluctuated in the range from 21 to 300 NrC.ml-1, which corresponds to long-term measurements at this profile. The Coliform bacteria values at Rajka and Medveďov profile follow the fluctuation of values at Bratislava profile, while the number of Coliform bacteria were in long run is lower comparing to the Bratislava sampling site. The bacteriological pollution, documented by the number of Coliform bacteria, at Medveďov profile in the main riverbed is lower comparing to the Rajka profile. The bacteriological pollution downstream the Danube, and along the river arm system, downstream from the water supply inflow at Helena profile, in 2001 also decreasing. The bacteriological pollution at the Vének profile situated on the Mosoni Danube fluctuated in the range from 220 to 3500 NrC.ml-1 due to the partially treated wastewater effluents. The seepage canal can be considered as the cleanest from the bacteriological point of view. Chlorophyll-a The chlorophyll-a concentrations refer to the quantity of phytoplankton and provide information about the eutrophic state of water. The growth of algae on the respective section of the river is represented by the relative increase of chlorophyll-a concentration between two compared profiles. According to the observations in the Danube in 2001 the spring algae growth maximum, similarly to the previous two years, did not occur. However a slight increase occurred at the beginning of March and in May, but the values reached maximally 30 mg.m-3. The first real culmination occurred at the end of July and beginning of August, when the values fluctuated from 70 to 100 mg.m-3 (Fig. 2-14a and Fig.2-14b). The situation in the right side river branch system was similar to the situation in the Danube water, however the chlorophyll-a concentrations occasionally reach higher values. During the culmination at the end of July and beginning of August the maximal value at Helena profile reached 161 mg.m-3. In case of maximum algae growth in the river branch system the chlorophyll-a concentration in the Ásványi river branch was more than 50 % higher than in the Szigeti branch. At the Vének profile on the Mosoni Danube two culminations was detected, the first in May (80 mg.m-3) and the second at the end of July and beginning of August (114.85 mg.m-3). The chlorophyll-a concentration in the seepage water remained low and fluctuated mainly from 1.18 to 10 mg.m-3. The highest values were measured during the spring and the summer algae growth, when the chlorophyll-a concentrations reached 24 and 34 mg.m-3 respectively. Saprobic index The saprobic index represents the self-purification ability of the water, the ability to degrade the organic pollution. The saprobic index in relation to the respective stretch of the river represents also the water quality in the river. Based on the Slovak data most of the saprobic index values in the influenced area fluctuate in the range from 1.79 to 2.31 which correspond to beta-mezosaprobic state. These values of saprobic index are typical for this stretch of the river. The self-purification processes, at this level of the saprobic index, run mainly as oxidising processes. Time series data of saprobic index indicate the slightly decreasing tendency during the last ten years. According to the Hungarian data the saprobic index fluctuates between 2.22 and 2.7 that correspond to alpha-beta-mezosaprobic state (Fig. 2-15). The saprobic index in the right side river branch system and in the Mosoni Danube at Vének profile fluctuate from 2.13 to 2.78, which correspond to alpha-beta-mezosaprobity. Other biological parameters The observations of the number of algae, the number of zooplankton and the macrozoobenthos according to the Agreement are performed four times in the year. Phytoplankton In the hydrological year 2001 the number of algae was determined in samples taken in December 2000, March, June and October 2001. The population densities due to the unfavourable meteorological conditions for algae growth at the time of sampling were lower, similarly to the previous year. Maximal values at all sampling sites occurred in March, however the abundance of algae remained below 10000 cells.ml-1. Only in the Ásványi river branch reached the value of 21269 cells.ml-1. In the seepage canal the maximum value in March reached 10456 cells.ml-1. Similarly to the previous year the Diatoms dominated in the phytoplankton community, but during the spring the Chrysophyceae species were also abundant and in the summer the amount of green algae was significant as well, which were rich in species composition and very abundant was the Cryptomonas species. The water in the seepage canal, similarly to the chlorophyll-a concentration, remained relatively poor in algae. Based on the phytoplankton investigation certain re-structuring of the algae composition can be observed. The increase of the species diversity can be proven first of all by more frequent appearance of algae of Chrysophyta and Pyrrophyta species. Zooplankton Zooplankton observations in the hydrological year 2001 were carried out in April, May, August and September. The abundance of the respective species has developed in Danube similarly as in the previous year. No community occurred in high population density. Some of the rare species did not occurred in the year 2001. In the right side river branch system zooplankton population with high density occurred more rarely than in the previous year. The abundance is low at places where the flow velocity is high due to the temporary water supply. The species diversity and the number of individuals were higher in the Ásványi river branch than at the Helena profile and the Szigeti river branch, which are situated at the upper part of the water supply system. The seasonal dynamics of populations was similar the dynamics recorded in the previous years. Compared to the previous year the maximum values in the seepage water were significantly lower. No huge spreading of thermophilous Rotifera and Nauplius larvae, living in eutrophic waters, has occurred. In the Mosoni Danube at the Vének profile the abundance values peaked in April, however the abundance throughout the year was balanced again. Macrozoobenthos The aquatic macroscopic invertebrate communities in the hydrological year 2001 were sampled at the sampling points in May, July, August and October. The faunistic results of the macroscopic invertebrate population in the Danube were very similar to the results of the previous year. In the hydrological year 2001 species characteristic for beta-mesosaprobic state dominated: Molluscs, Trichoptera and Malacostrata. Among the typical molluscs’ species the Ancylus fluviatilis and Theodoxus danubialis were found, the Corophium curvispinums, Dikerogammarus bispinosus and the rare Pontogammarus obesus from among Malacostrata species, the Trichoptera species Caenis moesta at Rajka, the Dreissena polymorpha (Molluscs) and Jaera istrii (Malacostrata) at Bratislava, or the Erpobdella octoculata at Medveďov profile. The insect taxons occurred sporadically at Rajka, while at Medveďov the number of insect species increased. In the water supplied to the Mosoni Danube similar species observed in the Danube can be identified in a large scale. At the Vének profile the Molluscs species were the most characteristic. Besides molluscs the leech species have been found, together with several eutrophic aquatic organisms (Physella acuta, Assellus aquaticus, Corixidae sp., Ilyocoris cimicoides, Microneta sp.). The seepage water was favourable for the stagnant water organisms, which were dominant. The results of the monitoring in the river branch system along the water supply confirm the spreading of rheophilous invertebrate taxons from the beginning of the water supply system. Huge amount of organisms can be observed also in the Ásványi river branch system (Ancylus fluviatilis, Jaera istrii, Dikerogammarus villosus, some Trichoptera and Ephemeroptera species settled here). Taxonomic investigations prove that species preferring both low and high flowing velocities can be found. The calculated values of the saprobic index in the years 2000-2001 indicate slight increase. In the year 2000 the saprobic index varied in the range from 1.87 to 2.18, while in the year 2001 the saprobic index fluctuated from 2.06 to 2.18. The obtained values of the saprobic index correspond to the beta-mesosaprobic state, typical for this section of the river. Periphyton Based on the results obtained in 2001 it can be stated that the saprobic indexes of periphyton on every sampling point in the Danube correspond to the beta-mesosaprobic state. The saprobic index of periphyton ranged from 1.86 to 2, which means that the range of values was narrower than in the previous year. According to the species diversity of the periphyton the families of the Bacillariophyceae dominated on every sampling point. The families of Aulacoseira, Cyclotella, Cyclostephanos, Stephanodiscus and Thalassiosira, families of Fragilariaceae group (Diatoma, Fragilaria) as well as the families of Achnanthaceae group (Achanathes, Cocconeis) were frequent, but the most frequent were the families of the Naviculaceae group (Amphora, Cymbella, Cymatopleura, Surirella, Gomphonema, Naviculla, Rhoicosphaenia) and Bacillariaceae group (Nitzschia). The Cyanophyta were sparse, from among the Lyngbyia martesiana, Oscillatoria limosa and Phormidium retzii species were detected.
2.7. Quality of sedimentsSampling of riverbed sediments in the frame of joint Slovak-Hungarian monitoring had been performed in May 2001 by the Hungarian Party and in October by the Slovak Party. Inorganic and organic micro components were analysed and the content of total phosphorus and nitrogen was also determined. Similarly to previous years the “Canadian list” was used for evaluation. This standard distinguishes three levels of pollution: level without pollution, the lowest pollution level and the severe pollution level. From among the inorganic micro-pollutants seven heavy metal components (Zn, Hg, Cd, Cr, Ni, Pb, and Cu) were analysed. According to the results it can be concluded that in 2001, similarly to the previous years, the pollution by heavy metals did not reach the “severe pollution level” at any of the sampling sites. There were places where the concentrations of heavy metals, except the lead, were higher than the respective limit values for the “lowest pollution level”. The zinc concentration over the limit value (120 mg.kg-1) was detected in sediments from the Ásványi river arm, at two sampling sites in the Mosoni Danube and in the Danube old riverbed upstream the confluence with the tailrace canal. The cadmium concentration was higher than the respective value of “lowest pollution level” (0.6 mg.kg-1) at Medveďov in the Danube, at the Vének profile in the Mosoni Danube and in the Ásványi river branch. The copper concentration was higher than the limit value (16 mg.kg-1) in the Ásványi river branch and in the Danube upstream of the bottom weir and upstream of the confluence with the tailrace canal. In the Danube upstream the confluence with the tailrace canal and upstream the bottom weir also the values of chromium, nickel and arsenic were higher than the “lowest pollution value”. The lowest pollution value was also reached for the mercury (0.2 mg.kg-1) at the sampling place in the Danube upstream of the confluence with the tailrace canal. According to the above mentioned results it can be stated that the highest accumulation of heavy metals was observed in the Ásványi river branch and in the Danube old riverbed upstream of the bottom weir and upstream of the confluence with the tailrace canal, while the lowest one was observed in the seepage canal. From the organic micro pollutants the polychlorinated biphenyls (PCB) and polynuclear aromatic hydrocarbons (PAH) were analysed. The sum of PCB’s was determined by analyses of 8 isomeric compounds. The sum of PAH’s was determined by 13 polyaromatic hydrocarbon components. According to the obtained results it can be stated that the PCB and PAH contamination did not exceed the respective limits for the “lowest pollution level”, in case of PCB 70 mg.kg-1, in case of PAH 2000 mg.kg-1. Moreover the PCB concentration at all of the sampling points observed by the Hungarian Party was lower than the detection limit (0.2 mg.kg-1). The total phosphorus content in sediments exceeded the limit value of “lowest pollution level” (600 mg.kg-1) at all sampling sites apart from the Danube main riverbed and the seepage canal. The total nitrogen content in sediments exceeded the limit value of “lowest pollution level” (600 mg.kg-1) on all sampling points. However, neither the total phosphorus nor the total nitrogen contents reached the “serious pollution level” (2000 mg.kg-1 for the total phosphorus and 4800 mg.kg-1 for the total nitrogen) at any of the sampling sites.
2.8. Differences in the data measured by the Slovak and Hungarian Parties In the frame of the joint monitoring according to the Agreement there are sampling sites where both Parties should take samples from the same place and at the same time (Rajka, Medveďov and Komárno on the Danube, Lock No. I on the Mosoni Danube and Lock No. 2 on the right side seepage canal). These sampling sites belong to the surface water quality observation network sampled within the Slovak-Hungarian trans-boundary water quality monitoring. Based on observations of selected sampling sites (Rajka and Medveďov) it can be stated that various differences occur in the data measured by both Parties. The differences are remarkable in following parameters: pH, dissolved oxygen, suspended solids, sulphates, nitrites, total nitrogen, ammonium ion, total phosphorus, BOD5, saprobic index, Fe, Mn and heavy metals. One group of differences can be characterised by systematic deviation between the data measured by the Slovak or Hungarian Party (e.g. sulphates or saprobic index), the second is represented by different tendencies in the Slovak and Hungarian data (e.g. dissolved oxygen, BOD5, etc.) and to the last group belongs differences characterised by high deviation in values, while the tendency is similar. The discrepancies can last during the whole year or during some periods or they can occur occasionally. Samples can be seen on Fig. 2-3, Fig. 2-4, Fig. 2-5, Fig. 2-6a, Fig. 2-7, Fig. 2-10a, Fig. 2-11, Fig. 2-12, Fig. 2-13 and Fig. 2-15. Experts of both Parties will study the discrepancies in the data and prepare recommendations for their elimination.
2.9. ConclusionsIncreased or decreased values of some parameters seen from the long-term evaluation in the Danube were already observed at Bratislava profile (109) where the water quality of the Danube generally improved. This changes influence the surface water quality inflowing to the territory influenced by temporary measures realised according to the Agreement. The hydrological year 2001 was similar to the previous hydrological year. Improving or deteriorating of some water quality parameters was recorded mainly in sampling sites in the river branch system and on the Mosoni Danube. Fluctuation of individual parameters characterising the surface water quality in the right-side river branch system, due to the continuous water supply since 1995, was in most cases artificially modified, and follows their fluctuation in the Danube water. The tributaries and local pollution of settlements besides the water supply influence form the water quality in the Mosoni Danube. Before the confluence with the Danube the water quality state is labile (variable in time), which is proved by unfavourable values of some parameters (coliform bacteria, BOD, nitrates, total phosphorus sulphates and saprobic index), while in parameters characterising the oxygen regime, dissolved solids, iron concentration and COD improvement can be observed. Table 2-3: Classification of parameters or group of parameters according to the agreed limits for surface water quality classification
* In case of these parameters there were differences between the data measured by the Slovak and Hungarian Party. Generally the different results obtained by Slovak and Hungarian Parties did not influence the classification of the surface water quality. However in parameters like pH, dissolved oxygen, saprobic index and BOD5 the obtained results in some cases influence the classification.
|
|||||||||||||||||||||||||||||||||||||||||||||||||||||||||||||||||||||||||||||||||||||||||||||||||||||||||||||||||||||||||||||||||||||||||||||||||||||||||||||||||||||||||||||||||||||||||||||||||||||||||||||||||||||||||||||||||||||||||||||||||||||||||||||||||||||||||||||||||||||||||||||||||||||||||||||||||||||||||||||||||||||||||||||||||||||||||||||||||||||||||||||||||||||||||||||||||||||||||||||||||||||||||||||||||||||||||||||||||||||||||||||||||||||||||||||||||||||||||||||||||||||||||||||||||||||||||||||||||||||||||||||||||||||||||||||||||||||||||||||||||||||||||||||||||||||||||||||||||||||||||||||||||||||||||||||||||||||||||||||