PART 1
Surface water levels and discharges
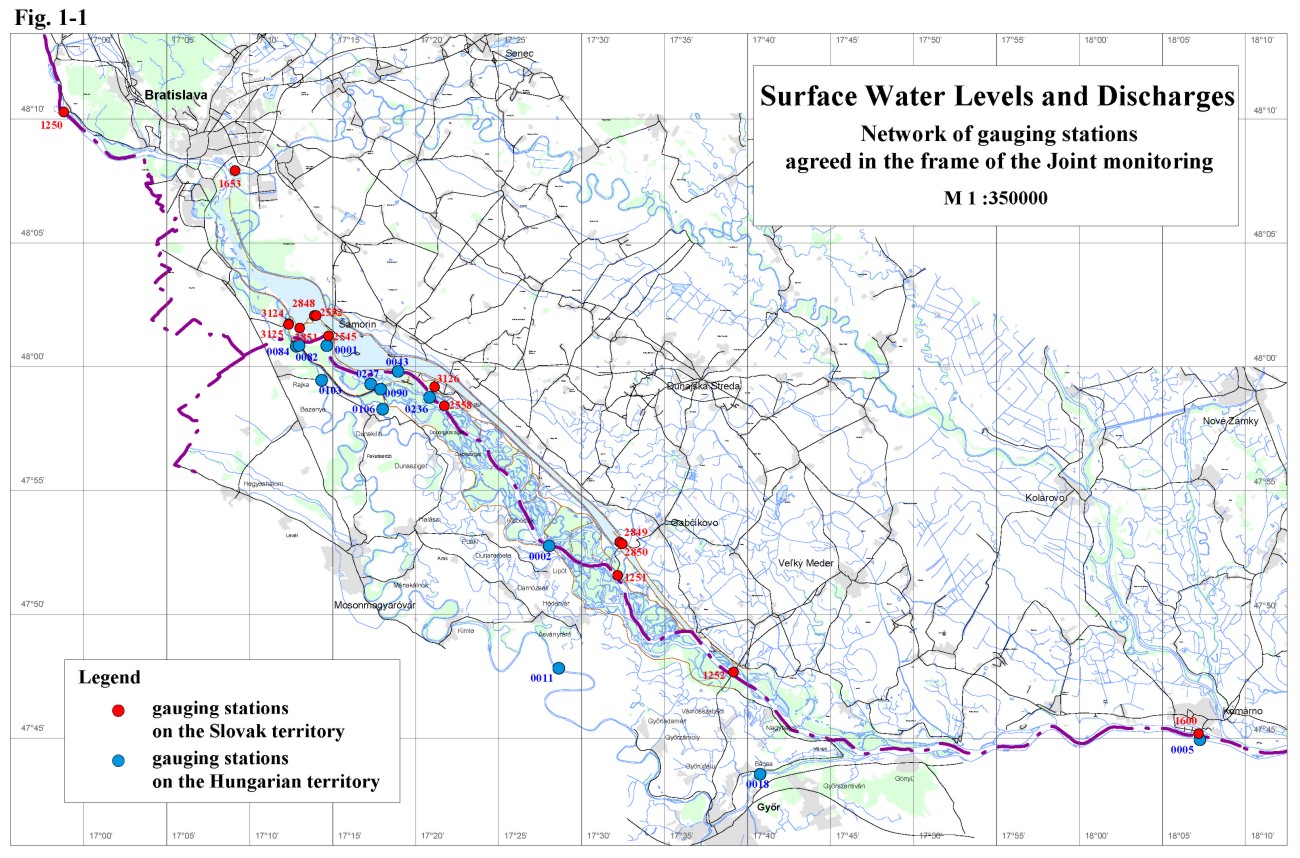
In the hydrological year 2001 there were no changes in the monitoring of surface water levels and discharges. Observations were carried out on 15 gauging stations on the Slovak side and 13 gauging stations on the Hungarian side (Tab. 1-1). The situation of observation network is shown on Fig. 1-1. In the intergovernmental Agreement Parties have undertaken a mutual exchange of data from agreed gauging stations. Joint measurements helped the joint evaluation of discharges flowing into the Danube downstream of the Čunovo dam and into the Mosoni branch of the Danube. Based on mutual evaluation of joint measurements agreed time series data were accepted. These data create the basis for joint evaluation of measures realised according to Articles 1-3 of the Agreement. Table 1-1: List of gauging stations
A temporary water management regime was set by the intergovernmental Agreement, signed on April 19, 1995. It was agreed that in case of average annual discharge 2025 m3.s-1 at Bratislava the annual average of 400 m3.s-1 would be discharged into the Danube downstream of Čunovo. The daily amount of water is governed by the discharge reaching the Bratislava-Devín profile, taking into consideration rules of operation described in the Annex 2 of the Agreement. The discharge in vegetation period, depending on hydrological conditions, should fluctuate from 400 to 600 m3.s-1; in the non-vegetation period the discharge should not be less than 250 m3.s-1. In case of floods the amount of water above 600 m3.s-1 discharged through the inundation weir is not taken into consideration when the annual average is calculated. Additional 43 m3.s-1 of water was agreed in the Agreement to be discharged into the Mosoni branch of the Danube. Based on average annual discharges at station No. 1250 for different years it can be stated that the average annual discharge in hydrological year 2001 was higher than the average considered in the Agreement (Tab. 1-2). Table 1-2: Average annual discharges
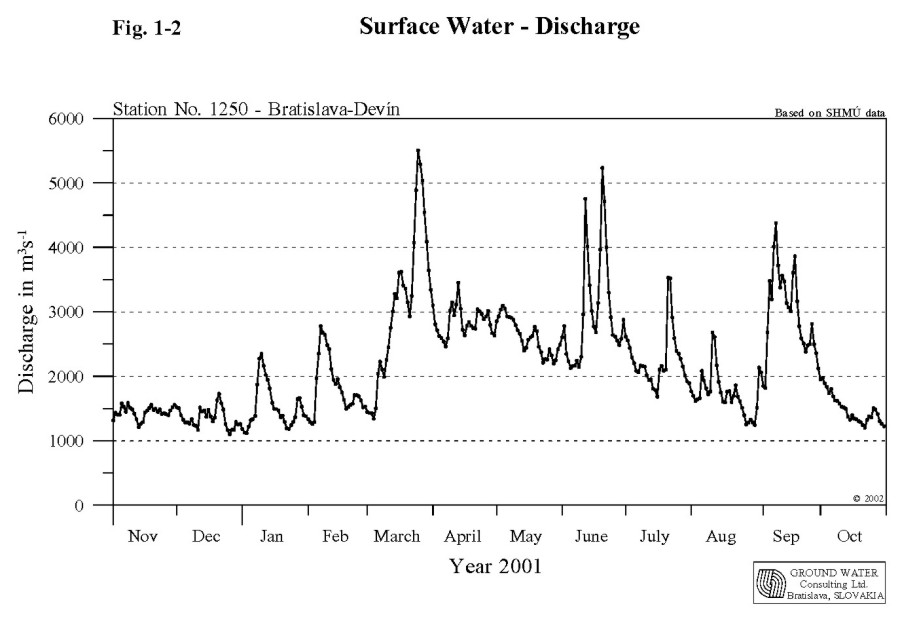
Low discharges in the Danube occurred from beginning of November 2000 to March 2001 as well as at the end of August and at the end of October 2001. The lowest average daily discharge occurred at December 26, 2000, when it reached the value of 1101 m3.s-1. Discharges over 3000 m3.s-1 in the Danube occurred at the end of March 2001, in June and September 2001, occasionally in June and July. The maximal average daily discharge occurred during the high discharge period in March 2001, when it reached 5504 m3.s-1. Based on these values it can be stated that the high or low discharges does not reached extraordinary values. In spite of this, the average yearly discharge in 2001 was slightly over the average yearly discharge considered in the Agreement (app. 7 %). The course of discharges during the hydrological year 2001 at gauging station No. 1250 - Bratislava-Devín is shown in Fig. 1-2.
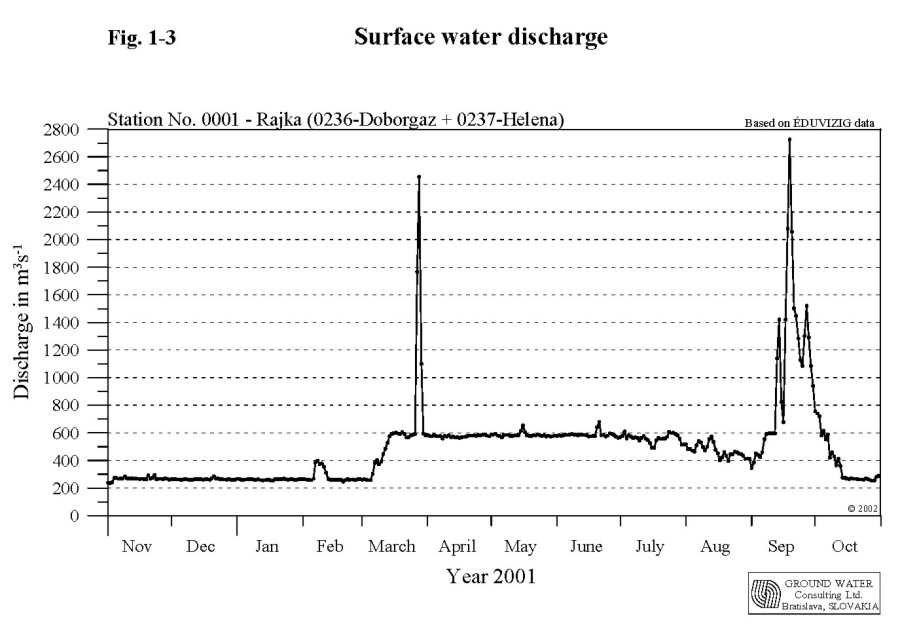
1.1. Discharge into the Danube downstream of ČunovoThe determination of the average daily amount of water discharged to the Danube downstream of Čunovo was based on average daily discharges measured at stations Doborgaz and Helena (Fig. 1-3). The monthly characteristics of the discharges into the Danube in the hydrological year 2001 were as follows: Year 2000 2001
The average annual discharge in the Danube at Bratislava-Devín profile in the hydrological year 2001 was 2169.76 m3.s-1. Taking into consideration obligations envisaged in the Agreement the Slovak Party was obliged to release an average annual discharge of 428.60 m3.s-1 into the Danube riverbed downstream of Čunovo. The total average annual discharge released to the Danube downstream of Čunovo was 487.33 m3.s-1. During the hydrological year 2001 riverbed discharge capacity measurements were planned to carry out in the Danube river section between Čunovo and Sap (rkm 1851-1811). For this reason higher amount of water was discharged to this Danube section two times – in March and in September. Unfortunately the high discharge period in March was not long enough to perform measurements completely and they were repeated in September. Moreover in September riverbed wash out was performed. During the hydrological year 2001 there were no needs to release higher amount of water into the riverbed downstream of Čunovo due to flood discharges. However, when subtracting the amount over 600 m3.s-1 released during the measurements (24 values) the average annual discharge of 436.61 m3.s-1 is obtained. When evaluating the amount of water discharged to the Danube old riverbed, it can be stated that Slovak Party fulfilled the average annual discharge jointly agreed in the Agreement. Taking into consideration the minimal values prescribed in the Agreement (in the winter period not less than 250 m3s-1, in the vegetation period at least 400 m3s-1) it can be stated that except of few occasions (three times at the beginning of the winter period) the minimal daily average discharges had been satisfied as well.
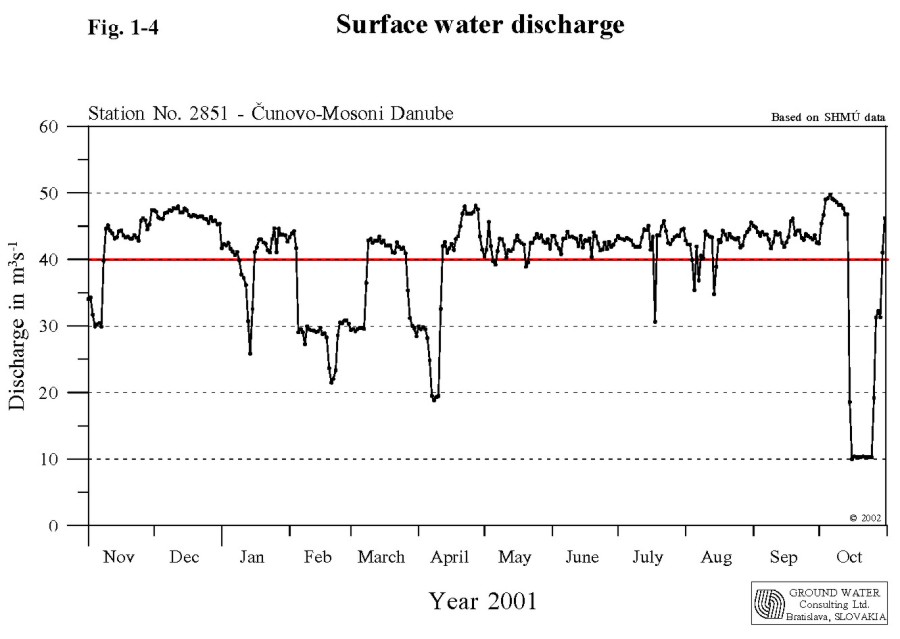
1.2. Discharge into the Mosoni branch of the DanubeThe discharge into the Mosoni branch of the Danube according to the Agreement should be 43 m3.s-1, which is composed by the discharge released to the Mosoni branch of the Danube through the intake structure at Čunovo and the discharge through the seepage canal. Discharge measurements are carried out at profiles situated on the Slovak territory at 0.160 rkm and upstream of lock No. I on the Hungarian territory. The average daily discharges were agreed after the joint evaluation of discharge measurements performed at both profiles. In the evaluation the data measured just downstream of the intake structure were considered (Fig. 1-4). The monthly characteristics of the amount of water released into the Mosoni Danube through the intake at Čunovo in the hydrological year 2001 were as follows: Year 2000 2001
The average annual discharge was 39.98 m3.s-1. The discharge in the right side seepage canal was measured at two profiles. The first is on the Slovak territory at Čunovo; the second is placed on the Hungarian territory at lock No. II. In the evaluation the data observed at lock No. II were considered. The monthly characteristics of the discharges recorded at lock No. II were as follows: Year 2000 2001
The average annual discharge was 1.65 m3.s-1. There is a continuous slow decrease of discharge observed in the seepage canal, so the hydrological conditions does not allow continuous releasing of 3 m3.s-1, which is envisaged in the Agreement. The monthly characteristics of the total discharge released into the Mosoni Danube, consisting of the amount of water released by the intake structure at Čunovo and amount of water in the right side seepage canal were as follows: Year 2000 2001
The total average annual discharge was 41.63 m3.s-1. Taking into consideration the technical and hydrological circumstances for discharging water to the Mosoni Danube in the period of 69 days (maintenance or repairing of one or both turbines used for releasing water through the intake object at Čunovo: 3.-7.9.2000, 3.-15.1.2001, 5.2.-7.3.2001, 28.3.-11.4.2001, 18.7.2001, 15.-29.10.2001) the total average annual discharge was 43.38 m3.s-1. Also in this case it can be stated that the average annual discharge envisaged in the Agreement was fulfilled.
1.3. Water distribution on the Hungarian territoryThe goal of the water distribution on the Hungarian side is to provide continuous water supply into the inundation area, into the river branches on the flood-protected area and into the Mosoni Danube. 1.3.1. Water supply into the inundation areaThe inundation area on the Hungarian side can be supplied by water from two sources:
Joint discharge measurements by both Parties were performed at the Helena profile too. The measurements were jointly evaluated and average daily discharges data were prepared. The monthly discharge characteristics at Helena profile in hydrological year 2001 were as follows: Year 2000 2001
The average annual discharge was 73.45 m3.s-1. The monthly discharge characteristics at the lock No. V: Year 2000 2001
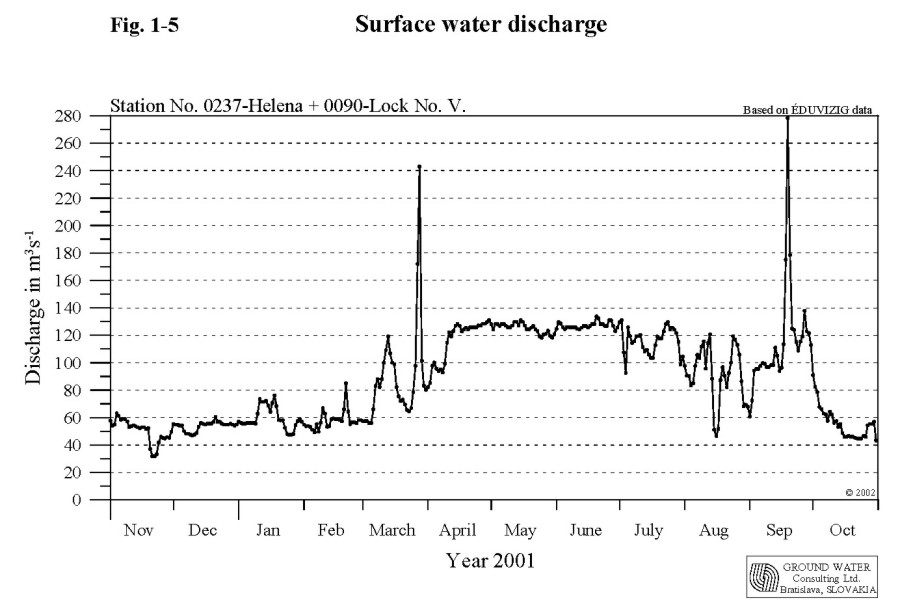
The average annual discharge was 14.83 m3.s-1. The monthly discharge characteristics of the total amount of water discharged into the inundation area in hydrological year 2001 (Fig. 1-5): Year 2000 2001
The total average annual discharge supplied to the inundation area was 88.27 m3.s-1.
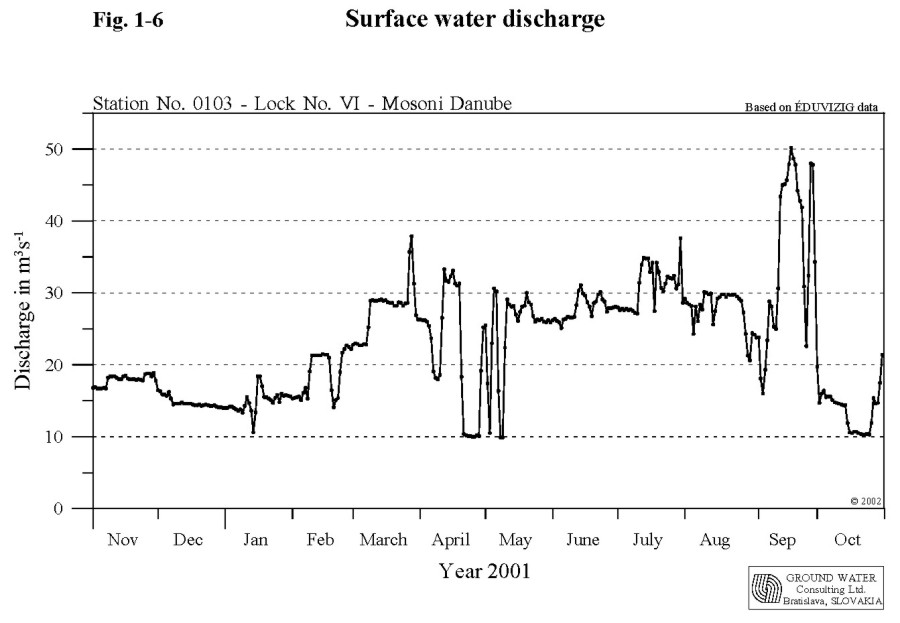
1.3.2. Water supply into the Mosoni DanubeThe water supply into the Mosoni Danube is provided from the seepage canal through the lock No. VI (Fig. 1-6). The discharge is measured at the profile downstream of the lock. The monthly characteristics of the discharges through the lock No. VI in hydrological year 2001 were as follows: Year 2000 2001
The average annual discharge in the Mosoni Danube at lock No. VI. was 22.98 m3.s-1. During the non-vegetation period low water period was simulated in Mosoni Danube water supply as well. This was reached by redirecting a large part of the water from the seepage canal into the inundation area through the lock No. V., while the water amount taken from the Danube upstream Dunakiliti was reduced. Besides the water supply function the lock No. I has also a flood protection function. It prevents floods to enter the flood-protected area.
1.4. The Danube water level characteristics on the Čunovo-Vámosszabadi stretchAccording to the prevailing influence the Danube stretch between Čunovo and Vámosszabadi can be divided into four different sections. These sections can be characterised by data obtained from the following gauging stations: Rajka and Hamuliakovo, Dunakiliti, Doborgaz and Dobrohošť, Dunaremete and Gabčíkovo. Vámosszabadi and Medveďov. The four sections on the Čunovo-Vámosszabadi stretch are the following: a)
Čunovo - Dunakiliti section. Since constructing the bottom weir the water level is impounded and
at Dunakiliti corresponds to the average water level. This impounded section
allows the water supply to the right side river branch system. The amount of
water discharged to the river branch system is determined by water level
regulation at the Dunakiliti dam. The water level is kept in the mid water
riverbed. The average flow velocities fluctuated in the range between 0.3-2.26
m.s-1. During the hydrological year 2001 there were no needs to
release floods to the Danube old riverbed, however higher discharges were twice
released during the performed measurements. For the first time at the end of
March (27-29.3.2001), culminating at 2493 m3s-1. For the
second time during September and beginning of October (13.9-3.10.2001),
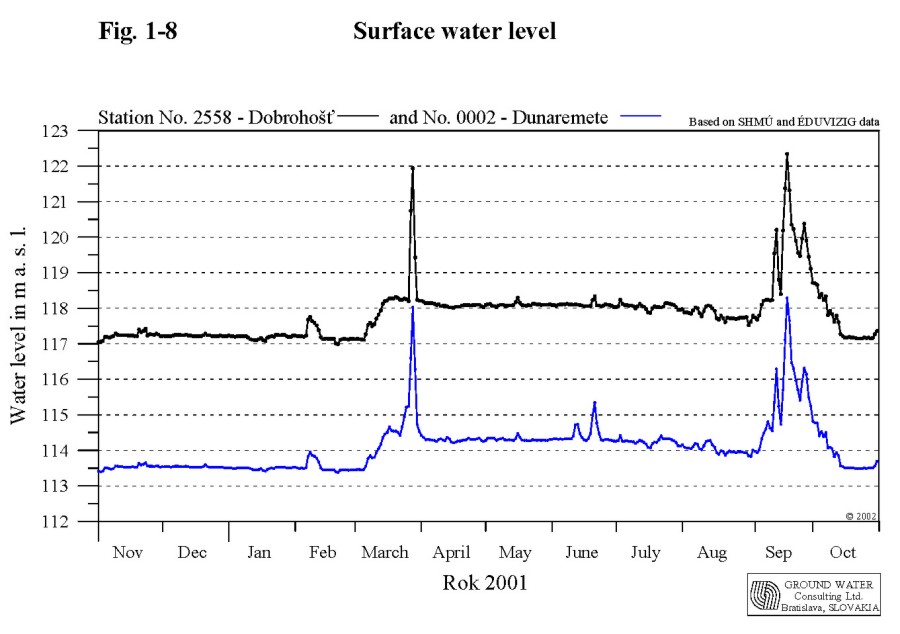
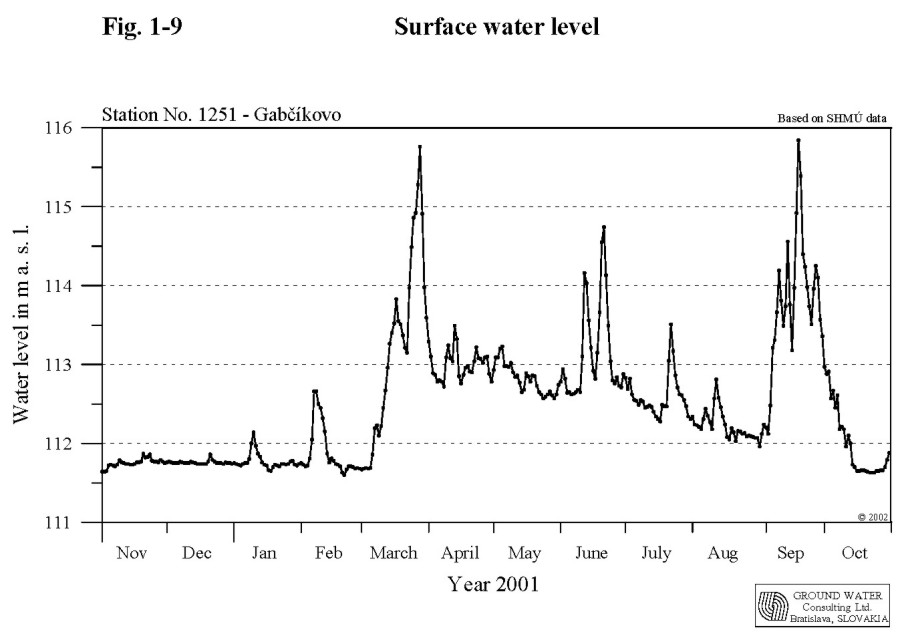
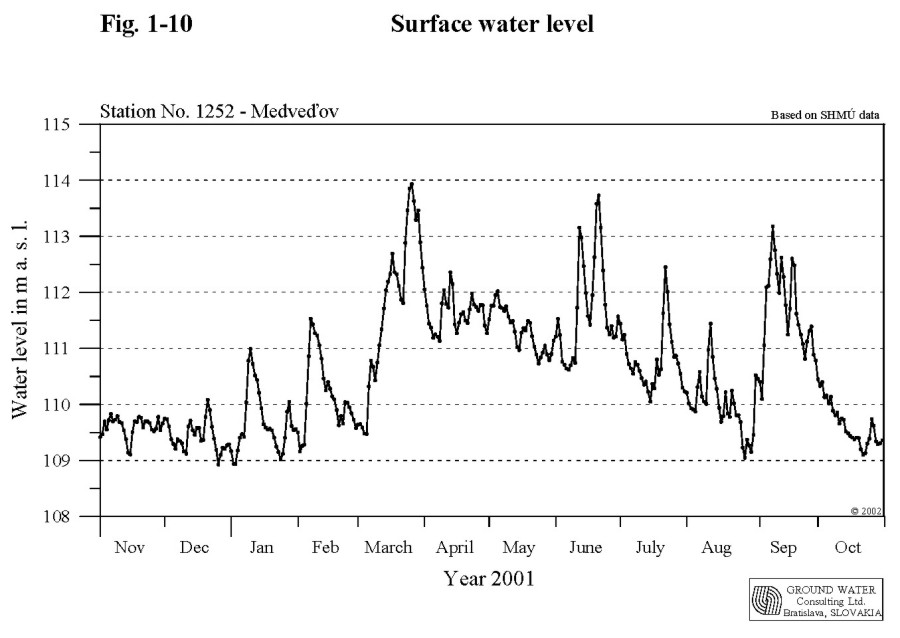
culminating at 2778 m3s-1. b) Section between Dunakiliti and Dunaremete. The water level on this section is not influenced by any measures and is determined only by the discharge released to this riverbed section. In upper part of this section is the water level in the river branches about 3 m higher than the water level in the main riverbed. The water level at the Dobrohošť gauging station (rkm 1838.6) fluctuated in the range from 116.99 to 122.34 m a. s. l. and the average water level was 117.83 m a. s. l. The water level in the Dunaremete profile (1825.5) fluctuated from 113.37 to 118.29 m a. s. l. and the average water level was 114.09 m a. s. l (Fig. 1-8). The average flow velocities fluctuated in the range between 0.87-2.07 m.s-1. c) Section between Dunaremete and Sap. This section is influenced by the backwater effect from the confluence of the tailrace canal and the Danube old riverbed. The water level changes are influenced by the discharges in the tailrace canal. The length of the upstream section influenced by the backwater effect depends on the actual discharge distribution between the hydropower station and the Danube old riverbed. At regular operation it can be stated that the backwater effect reaches the Dunaremete profile (rkm1825.5) at discharges over 2500 m3.s-1 at Medveďov. The water level in the Gabčíkovo profile (rkm 1819) fluctuated in the range from 111.60 to 115.84 m a. s. l. and the average water level was 112.49 m a. s. l (Fig. 1-9). The daily water level fluctuation at Gabčíkovo gauging station in the Danube old riverbed, as a consequence of operation of hydropower station, can reach app. 20 cm. d) Sap – Vámosszabadi section. The discharge in this section equals approximately to the discharge at Bratislava and is additionally influenced by the operation of Gabčíkovo hydropower station. The daily water level fluctuation at this stretch (up to 30 cm) depends on the hydropower station operation. Higher changes occur at low discharges in the Danube due to the ratio of the total discharge and the capacity of one turbine, which is put into operation or stopped. The average annual discharge at the Vámosszabadi – Medveďov profile in 2001 was 2104.98 m3.s-1. The water level at Medveďov profile (rkm 1806.3) fluctuated in the range from 108.93 to 113.93 m a. s. l. and the average water level was 110.61 m a. s. l (Fig. 1-10).
|
|||||||||||||||||||||||||||||||||||||||||||||||||||||||||||||||||||||||||||||||||||||||||||||||||||||||||||||||||||||||||||||||||||||||||||||||||||||||||||||||||||||||||||||||||||||||||||||||||||||||||||||||||||||||||||||||||||||||||||||||||||||||||||||||||||||||||||||||||||||||||||||||||||||||||||||||||||||||||||||||||||||||||||||||||||||||||||||||||||||||||||||||||||||||||||||||||||||||||||||||||||||||||||||||||||||||||||||||||||||||||||||||||||||||||||||||||||||||||||||||||||||||||||||||||||||||||||||||||||||||||||||||||||||||||||||||||||||||||||||||||||||||||||||||||||||||||||||||||||||||||||||||||||||||||||||||||||||||||||||||||||||||||||||||||||||||||||||||