PART 2
Surface Water QualitySurface water quality measurements in 2000, according to the Agreement, were performed at 8 monitoring sites on the Hungarian territory and at 15 monitoring sites on the Slovak territory - Table 2-1, Fig. 2-1 . Two new monitoring sites (No. 3739 and 4016), situated between the rkm 1843-1811 of the Danube old riverbed, were included in the data exchange, based on proposals in the Joint Annual Report from the year 1998. The site No. 4016 is situated upstream of the bottom weir at Dunakiliti, in rkm 1843.1. The other one is the monitoring site No. 3739 situated in the Danube old riverbed, upstream of the confluence with the tailrace canal, in rkm 1811.5. At all of monitoring sites the influence of the measures, described in the Agreement, on the surface water quality was observed. Main factors which could influence the water quality are: the backwater effect upstream of the bottom weir, the increased discharges into the Danube downstream of the Čunovo dam and into the Mosoni branch of the Danube and the water supply into the right side river arm system. Sampling and analysing was mainly performed according to methods agreed by the Sub-commission for Water Quality Protection of the Slovak-Hungarian Trans-boundary Water Commission. Surface water quality and sediment quality data for agreed monitoring sites are given in the Annexes to the Slovak and Hungarian National Reports on the Environment Monitoring in 2000. The evaluation was done for the hydrological year 2000 compared to the previous long-term surface water quality development. The time series diagrams for the respective parameters of the surface water quality are given in the Annexes to the National Reports. In the evaluation the agreed limit values for surface water quality, agreed on LV. session of the Slovak-Hungarian Trans-boundary Water Commission, were used (Table. 2-2). Table 2-1: List of monitoring sites
Table 2-2: Agreed limits for surface water quality classification
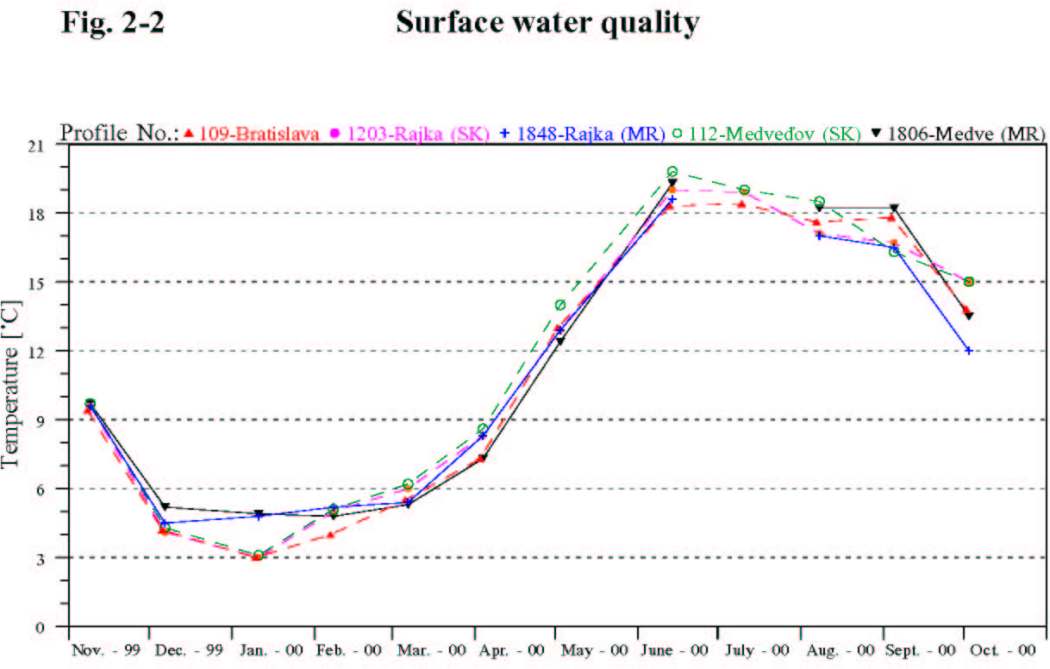
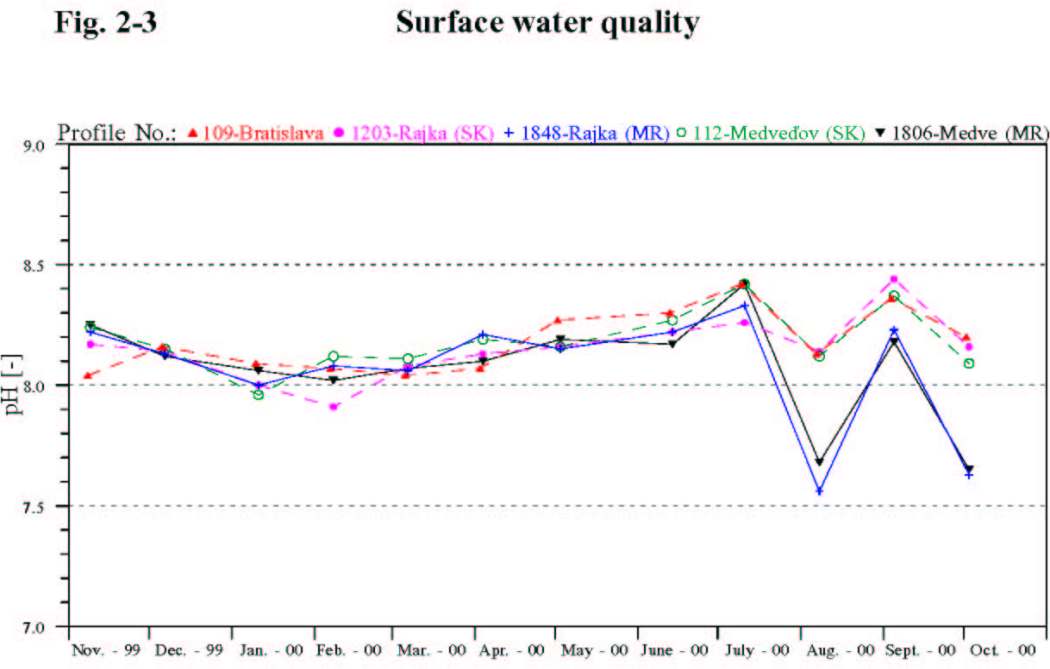
2.1. Basic physical and chemical parametersWater temperature In the examined year the water temperature in the Danube fluctuated in the range from 3 to 20 °C. The temperature reached the minimum values in January, while maximum values occurred in July. The temperature rose above 10 °C in May. The water temperature fluctuation over the whole Danube stretch downstream of Čunovo follows the water temperature course in the Danube at Bratislava (site No. 109). The water temperature in the seepage canal was different, just as in the previous years. In the winter period it is warmer (by 2-4 °C) and in the summer period cooler (by 1-2 °C), because the seepage canal is supplied by the ground water. The water temperature in the right side river branch system and in the Mosoni Danube was due to slower flow velocity warmer by 2-3 °C in the summer period. Water temperature in the Danube for hydrological year 2000 is documented in Fig. 2-2. pH The pH value indicates the alkalinity of water. Higher values occur in periods corresponding with periods of increased assimilation activity of phytoplankton. As a result of decreased assimilation activity the pH values in winter period are lower than in summer period. The Danube water pH values in the hydrological year 2000 fluctuated in the range from 7.6-8.5. The fluctuation of the pH values in the river branch system is close to that in the Danube water, except the Ásványráró monitoring site (No. 0023) where values of 9.1 occurred. Higher values were sometimes observed also in the Mosoni Danube at Vének profile. Comparing to the years 1998 and 1999 the differences in the data measured by the Slovak and Hungarian Party were not so frequent. However, significant differences occurred at Rajka profile in august 2000 (7.56 vs. 8.14) and in October 2000. Similar situation can be observed at the Medveďov profile. The pH values measured during the hydrological year 2000 are documented in Fig. 2-3. Electric conductivity The electric conductivity of the surface water refers to the dissolved solids content. The conductivity values in the Danube and in the right-side river branch system in 2000 in principle follows the conductivity values at the Bratislava profile (No. 109) and fluctuated between 29 to 47 mS.m-1. Higher salinity was characteristic for the winter period, while the lowest occurred during floods because of dilution. The dissolved solids content in the Mosoni Danube at Vének profile is higher comparing to the other water bodies; maximum of 77.4 mS.m-1 was measured in January. This is due to higher dissolved solids content of the affluents and also due to the pollution by the city Győr. The electric conductivity values in the seepage canal, similarly to the previous years, fluctuated in the range from 36 to 42.6 mS.m-1. Suspended solids Suspended solids content is closely related to the discharge. The suspended solids content fluctuations during the hydrological year 2000 over the whole Danube stretch downstream of Čunovo follows the suspended solids content in the Danube at Bratislava (No. 109). The suspended solids content values mainly fluctuated in the range from 3 to 100 mg.l-1. Only the samples taken during the flood periods (February, April, May and August) exceeded the 50 mg.l-1, which represents the IV. water quality class. A significant decrease of suspended solids concentration can be observed between the Bratislava and Medveďov sections of the Danube during floods. The suspended solids content along the longitudinal profile of the right side river branch system showed slight decrease. In the seepage canal the content of suspended solids fluctuated between 4-25 mg.l-1. In the Mosoni Danube at Vének profile the suspended solids content two times exceeded the value of 50 mg.l-1. There were some differences in the data measured by the Slovak and Hungarian Party. Differences are represented by 1.5-2 times higher values in the Rajka and Medveďov profiles, which correspond to 20-30 mg.l-1. The highest difference occurred in February at the Rajka profile, when the measured values differed by 45 mg.l-1. The course and fluctuation of the suspended solids content is documented in the Fig. 2-4. Basic physical and chemical parameters - summary The basic physical and chemical parameters in the Danube and river branch system connected to the Danube main riverbed show seasonal variation and predominantly depend on the discharges. There is a significant decrease of suspended solids content observed during floods between the Bratislava and Medveďov section of the Danube. In the hydrological year 2000 there were not recorded significant changes in the water quality in comparison to the previous year.
2.2. Cations and AnionsThe quantitative ratio of the ionic composition of the Danube water during the hydrological year 2000, just as in previous years showed high stability. Comparing to the long-term measurements the values of basic cations and anions have not changed significantly. The seasonal fluctuation of cation and anion concentrations is related to the discharge fluctuations in the Danube. Similarly to the previous years there are differences in the sulphates concentrations measured by the Slovak and Hungarian Party - Fig. 2-5. Discrepancies are represented by systematic difference between the Slovak and Hungarian data in the range of 20-70 %. The most stabile ionic content was characteristic to the seepage water. In relation to the higher dissolved solids contents in the Mosoni Danube, all macro-ion concentration values, except the hydrocarbonate, were higher compared to the values observed at the other sampling sites.
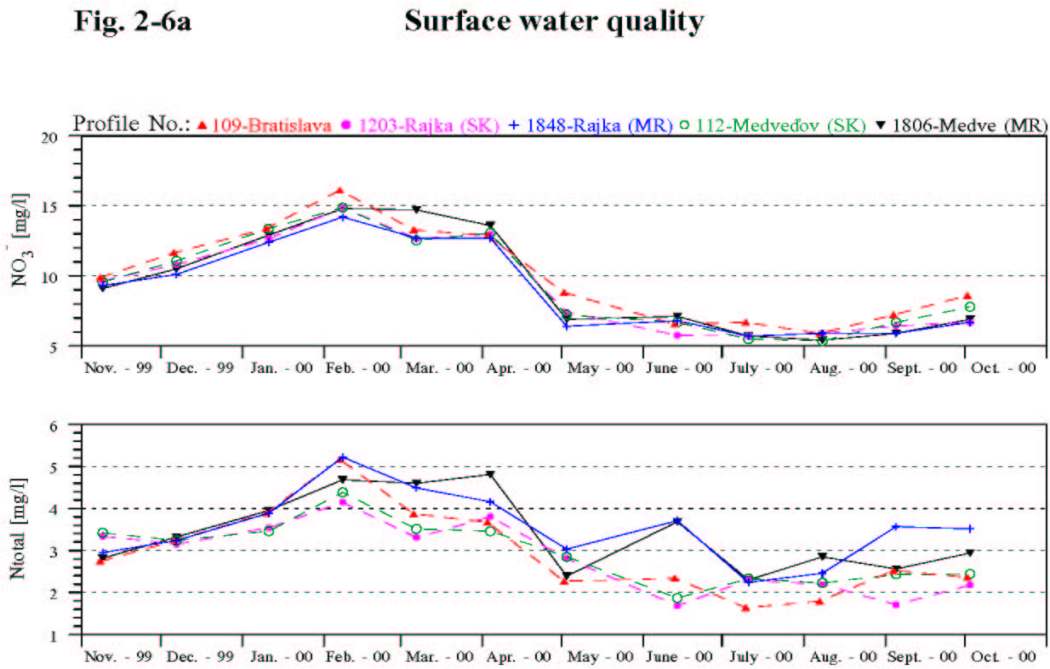
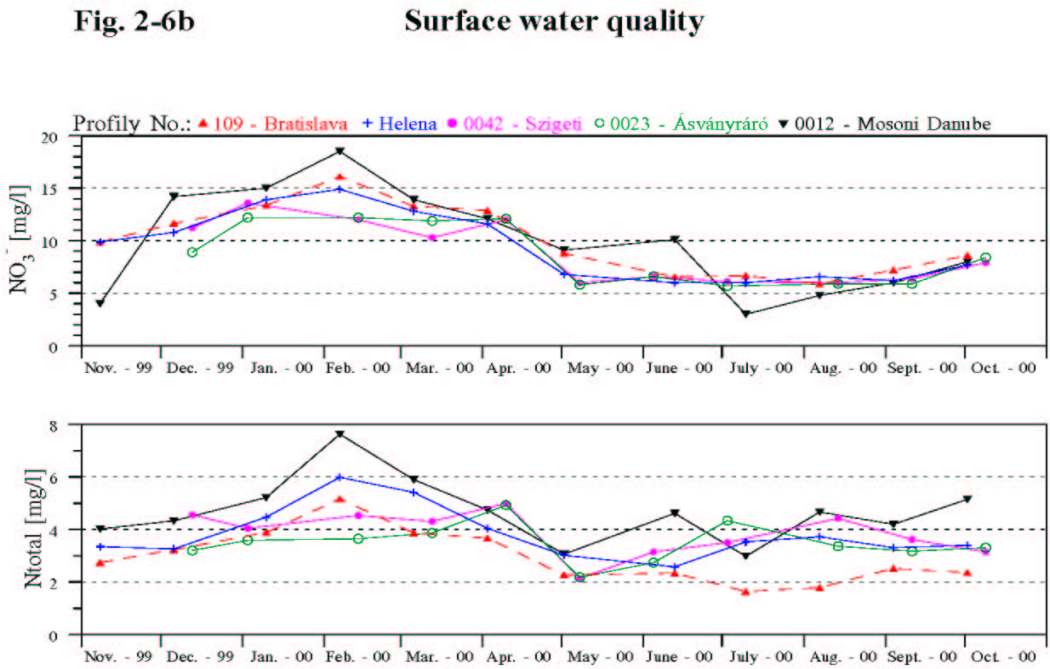
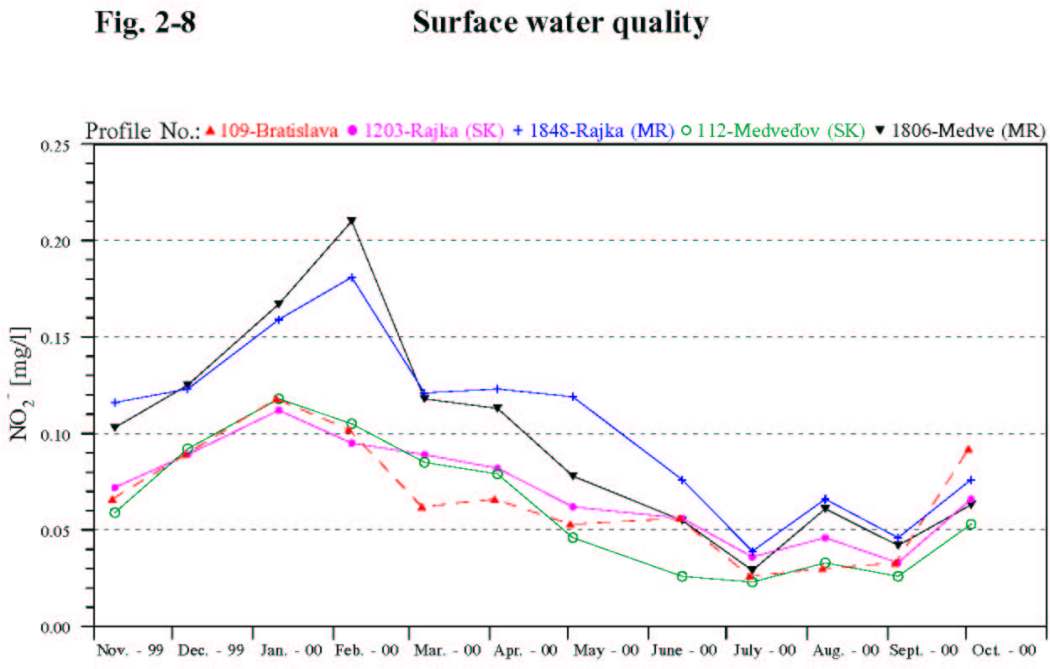
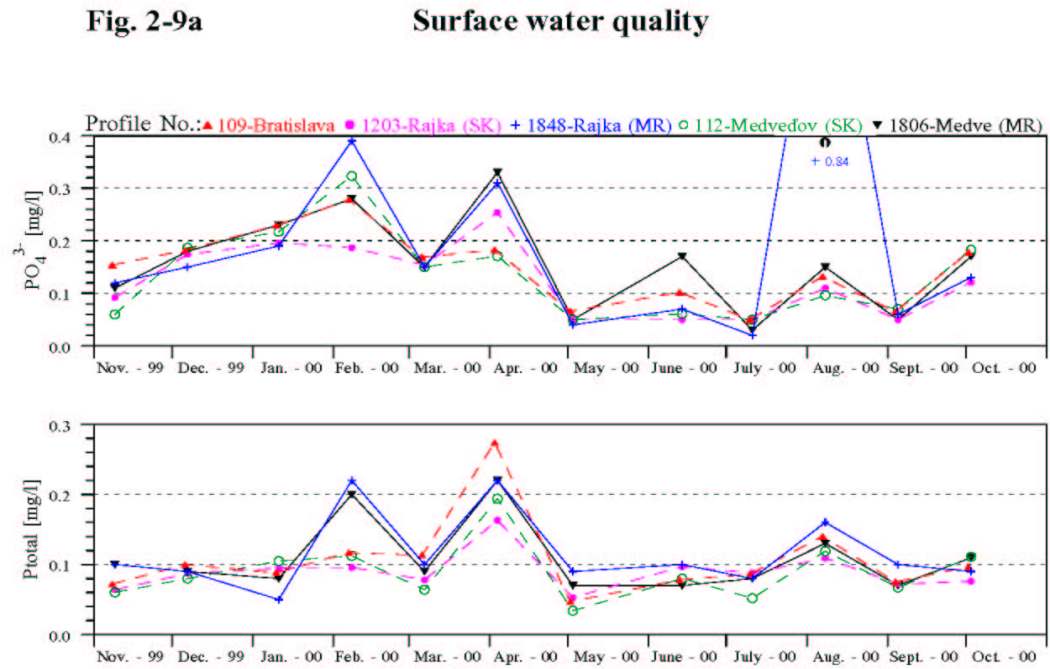
2.3. NutrientsNitrates Nitrates concentrations in 2000 at all monitoring sites in the Danube as well as in the right-side river branch system show seasonal fluctuation. Values mainly fluctuated in the range from 5 to 15 mg.l-1, Fig. 2-6a, Fig. 2-6b . The nitrates concentrations in the Mosoni Danube fluctuate similarly to the other monitoring sites; the maximum (18,5 mg.l-1) was observed in February, minimum in July (3 mg.l-1). The values in the seepage canal in 2000 equally fluctuated in the range from 3 to 10 mg.l-1. Ammonium ion In the hydrological year 2000 the ammonium concentrations at all measured sites in the Danube and in the right-side river branch system, except the Vének profile situated on the Mosoni Danube, are similar, and vary mainly from 0.01 to 0.54 mg.l-1 (Fig. 2-7). Higher concentrations occur during the periods with lower water temperature due to the slower nitrification processes. During the observed period higher values of ammonium ion concentration occurred at the Bratislava profile (No. 109) comparing to the other water bodies. There are some differences in the data measured by the Slovak and Hungarian Party - Fig. 2-7. Discrepancies are represented by systematic difference between the Slovak and Hungarian data in the range of 0.1-0.3 mg.l-1. The ammonium ion concentration in the Mosoni Danube at Vének profile was in several occasion double comparing to the concentrations at the other profiles (maximum value 0.52 mg.l-1 was measured in February). Nitrites The concentrations of nitrites, which are considered to a temporary product of nitrification and denitrification processes, show a seasonal variation and fluctuate in the range from 0.02 to 0.21 mg.l-1. In the right side river branch system the minimal and maximal value occurred in the Helena arm (minimum occurred in September – 0.025 mg.l-1 and maximum in February – 0.212 mg.l-1). There are differences in the data measured by the Slovak and Hungarian Party - Fig. 2-8. Systematic discrepancies occurred in the period from November 1999 to May 2000, when the differences were represented by 0.04-0.1 mg.l-1. Total nitrogen Changes in the total nitrogen content are predominantly affected by the fluctuation of the nitrate-nitrogen and organic nitrogen concentrations. The total nitrogen concentration in the Danube and in the right side river arm system fluctuated from 2 to 8 mg.l-1 (Fig. 2-6a), (Fig. 2-6b). The total nitrogen values were highly similar to each other in the Danube water, Mosoni Danube and at Helena side arm. The sampling points at Szigeti and Ásványi arms did not follow the changes in nitrate concentration exactly. Higher concentrations were measured in the Mosoni Danube at Vének profile comparing to the other sampling sites. The lowest amount of total nitrogen was found in the seepage canal. Phosphates In the hydrological year 2000 the phosphate concentrations fluctuated from 0.01 to 0.4 mg.l-1 at all monitoring sites (Fig. 2-9a), (Fig. 2-9b), except the Vének profile on Mosoni Danube. Higher values of orthophosphates concentrations were characteristic during floods and winter period. During the flood in August an extremely high value (0.84 mg.l-1) was observed at Rajka monitoring site (No. 1848). Higher values were recorded in the more contaminated Mosoni Danube, where the concentrations fluctuate from 0.2 to 0.5 mg.l-1. The lowest phosphate concentrations occurred in the seepage water. Total phosphorus Concentration changes of the total phosphorus follow the pattern of the phosphates. The total phosphorus concentration on all profiles, except profile Vének, situated on Mosoni Danube, fluctuated in the range from 0.02 to 0.2 mg.l-1 (Fig. 2-9a), (Fig. 2-9b). Total phosphorus concentrations on profile Vének fluctuated in the range 0.12-0.35 mg.l-1. There are slight differences in the data measured by the Slovak and Hungarian Party. Nutrients - summary The concentration of anions containing nitrogen and phosphorus slightly increased in the period of 1993-1996 on each of the monitoring sites on the Danube. The period 1997-2000 is characteristic by lowering and stabilisation of nutrients content (monitoring sites No. 109 and 112). Decrease of nutrients content in the Bratislava section of the Danube is probably connected with decrease of pollution coming to this area. However, in 2000 some of the nutrients content increased - phosphates and ammonium at monitoring site No. 109 at Bratislava, nitrates and total nitrogen at monitoring site No. 112 at Medveďov. Since introducing the water supply the content of nutrients in the right-side river branch system follows the fluctuation in the Danube. From the point of view of nutrients content, the Danube water enables creation of eutrophication processes under other suitable conditions.
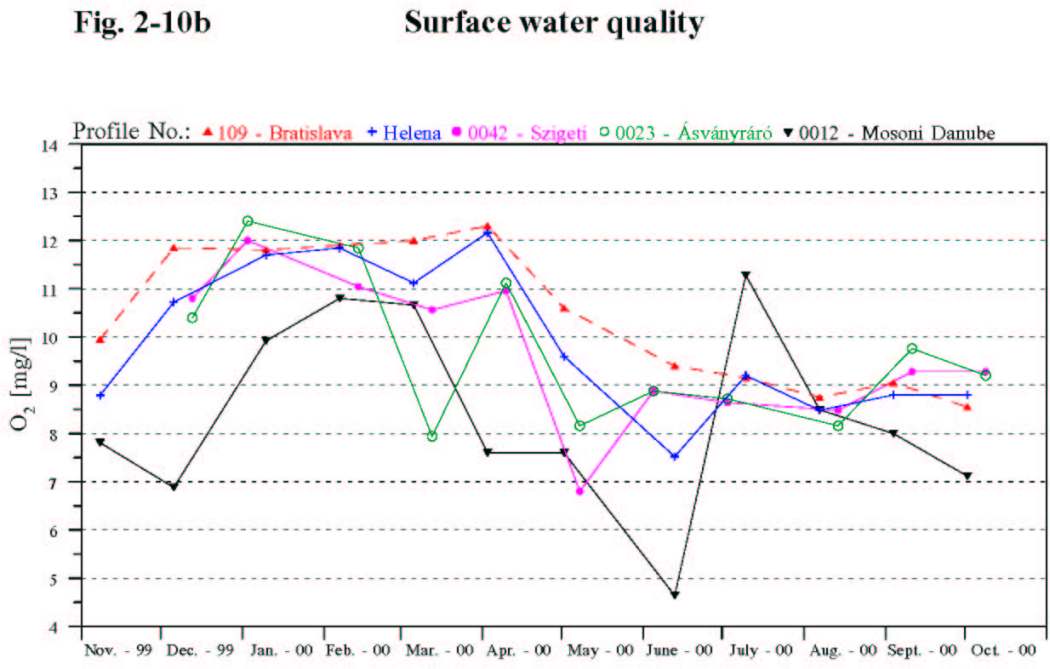
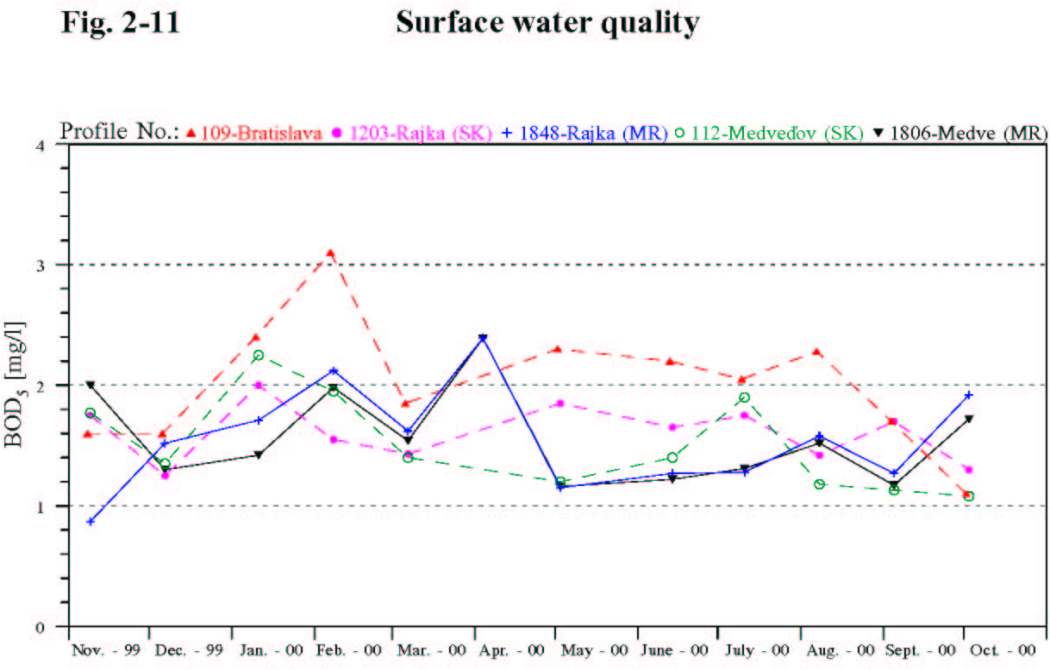
2.4. Oxygen and organic carbon regime parametersDissolved oxygen In the hydrological year 2000 the dissolved oxygen concentration at monitoring sites on the Danube measured by the Slovak party fluctuated from 7.5 to 12.3 mg.l-1. The dissolved oxygen concentration measured by the Hungarian Party on the same sites fluctuated from 5.76 to 11.76 mg.l-1 - Fig. 2-10a . The discrepancies are represented by systematic difference between the Slovak and Hungarian data by 1-2.5 mg.l-1. Generally higher values occur in winter period, while the lower values occur in the summer. The dissolved oxygen content proportionally decreased with increasing water temperature in the Danube. Besides this the dissolved oxygen content depends on the assimilation activity of phytoplankton. In the right-side river branch system due to the continuous water supply the dissolved oxygen content follow the course of dissolved oxygen values in the Danube river (Fig. 2-10b) . During the measurements the dissolved oxygen content in the right side river branch system in the first half of the year were more favourable then in the Danube main riverbed. Along the flow path the dissolved oxygen concentration in the river branch system slightly increase. The concentrations in the river branch system fluctuated in the range 6.8-12.4 mg.l-1. The oxygen concentrations in the Mosoni Danube at Vének profile were slightly lower and fluctuated mostly from 6.88 to 11.28 mg.l-1. Critical oxygen deficient conditions in the Mosoni Danube did not occurred during the evaluated period, but in June 2000 one extremely low value (4.64 mg.l-1) was recorded. CODMn and BOD5 COD and BOD parameters are used for expressing the organic contamination of the water, they indicate the chemically and biologically degradable organic matter content. In the hydrological year 2000 the COD values at all measured profiles fluctuated from 1.5 to 7 mg.l-1. The COD values in the right side river branch system were slightly lower comparing to the Danube water and fluctuated from 1.7 to 5.6 mg.l-1. The maximum value was measured at Helena profile at the end of March. The BOD values of the Danube water fluctuated in the range from 1 to 3 mg.l-1. There are some differences in the BOD values measured by the Slovak and Hungarian Party in the Danube, Fig. 2-11 . Differences in the measured data fluctuated from 0.4 to 1 mg.l-1, and the discrepancy is expressed mostly in contrary tendency. The BOD values in the river branch system are lower comparing to the Danube water. Higher COD and BOD values usually occur in periods with increased discharges in the Danube, when the water contain higher amount of natural organic matter. The seepage water was found to be scare in organic material (1.0-2.3 mg.l-1). In the Mosoni Danube at Vének, similarly to the previous years the COD and BOD values were higher because of the partially treated wastewater from the Győr (COD 3.1-5.4 mg.l-1, BOD 1-2.67 mg.l-1). Oxygen and organic carbon regime parameters - summary During the hydrological year 2000 the dissolved oxygen contents were usually favourable and generally the organic carbon content was small. The oxygen and organic carbon related parameters in the Danube reflect the seasonal assimilation activity of the phytoplankton and organic carbon oxidation processes. The measured data (1992-2000) indicate decreasing trend of organic load at the Bratislava section of the Danube. This phenomenon is the consequence of substantial wastewater treatment improvement in the upstream danubian countries. Higher oxygen regime parameters (CODMn, BOD5) occurred in period of higher discharges in the Danube. The oxygen regime parameters at Vének are influenced by local pollution (pollution originating from city Győr) together with hydrological conditions at confluence with the Danube.
2.5. MetalsIron The amount of suspended solids influences the iron content in the surface water. The mutual coherence of iron concentrations and suspended solids content in surface water is documented by the highest concentrations of iron measured at the time of highest suspended solids content. In 2000 the iron concentrations on all measured sites on the Danube fluctuated up to 1.4 mg.l-1. There are some differences between the data measured by the Slovak and Hungarian Party – Fig. 2-12. Discrepancies are expressed by occasional difference in measured data up to 0.4 mg.l-1. The iron concentrations in the right side river branch system mostly fluctuated up to 1 mg.l-1. Only in June there were measured higher value at Szigeti arm (1.82 mg.l-1) and in August at Helena profile (1.43 mg.l-1). The iron concentration in the seepage water fluctuated in narrower range from 0.09 to 0.18 mg.l-1. In the Mosoni Danube at Vének profile is the iron content always higher due to the character of catchment area (the water in the Rába river is rich in iron). In hydrological year 2000 it fluctuated from 0.3 to 1.1 mg.l-1. Manganese Manganese, similarly to iron occurs in surface water mainly in solid phase. The manganese concentrations in the Danube water mostly fluctuated in the range up to 0.2 mg.l-1. The highest concentrations of manganese were measured at the time of highest suspended solids content. There were some differences in the manganese concentrations measured by the Slovak and Hungarian Party, especially at the Medveďov monitoring site, Fig. 2-13. The manganese concentrations at Vének profile on the Mosoni Danube fluctuated up to 0.2 mg.l-1, except two values 0.65 mg.l-1 in March and 0.4 mg.l-1 in September. Heavy metals The heavy metals concentrations in hydrological year 2000 usually fluctuated in the range of limits corresponding to the I. class of surface water quality. Similarly to the previous years, zinc was present in the highest concentration, followed by copper, nickel, chromium, cadmium, mercury and arsenic. There were differences in the heavy metal concentrations measured by the Slovak and Hungarian Party. The discrepancies are expressed by systematic difference in the measured data.
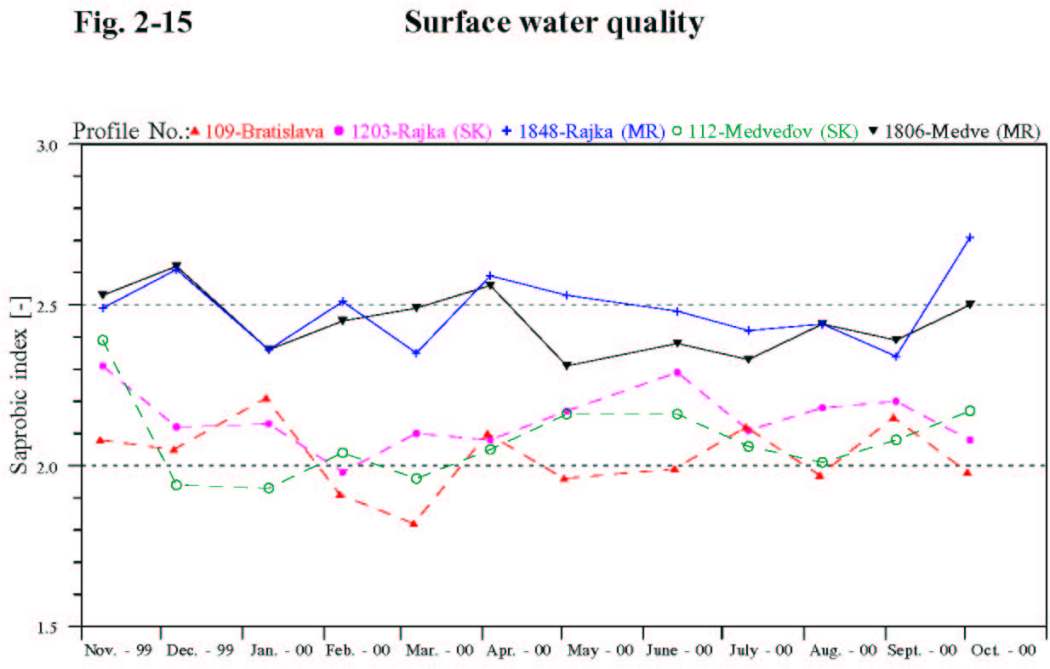
2.6. Biological and microbiological parametersColiform bacteria The surface water bacteriological pollution can be well determined by the number of Coliform bacteria. In 2000 the number of Coliform bacteria at Bratislava profile (109) fluctuated in the range from 12 to 240 NrC.ml-1, which corresponds to long-term measurements at this profile. The Coliform bacteria values at Rajka and Medveďov profile follow the fluctuation of values at Bratislava profile, while the number of Coliform bacteria were in long run is lower comparing to the Bratislava sampling site. The bacteriological pollution in 2000 downstream the Danube, and along the river arm system, downstream from the water supply inflow at Helena profile, also decreasing. The bacteriological pollution at the Vének profile situated on the Mosoni Danube fluctuated in the range from 28 to 3500 NrC.ml-1 due to the partially treated wastewater influents. Chlorophyll-a The chlorophyll-a concentrations refer to the quantity of phytoplankton and provide information about the eutrophic state of water. The growth of algae on the respective section of the river is represented by the relative increase of chlorophyll-a concentration between two compared profiles. According to the observations in the Danube in 2000 the spring algae growth maximum, similarly to the previous year, did not occur. The chlorophyll-a concentrations in the first culmination in July fluctuated from 30 to 46 mg.l-1, while in the second one in September it fluctuated from 18 to 26 mg.m-3 (Fig. 2-14a). Similarly to the Danube there were two culminations in the right side river arm system during the hydrological year 2000 –at the Szigeti arm and at Helena profile in July (24-50 mg.m-3) and in September (20-48 mg.m-3). In the Ásványi arm there was spring culmination with 26 mg.m-3, and autumn culmination wit 53 mg.m-3.The summer and autumn maximums could be detected at the Vének profile on the Mosoni Danube, but similarly to the previous year the values were significantly lower in comparison to the previous period and fluctuated from 1.18 to 49.73 mg.m-3 (Fig. 2-14b).. The chlorophyll-a concentration in the seepage water remained low and fluctuated from 1.18 to 13.02 mg.m-3. Saprobic index The saprobic index represents the self-purification ability of the water, the ability of degradation of organic pollution. The saprobic index in relation to the respective stretch of the river represents also the water quality in the river. Based on the Slovak data most of the saprobic index values in the influenced area fluctuate in the range from 1.8 to 2.4 which correspond to beta-mezosaprobic state. Based on the Hungarian data the saprobic index fluctuates between 2.11 and 2.75 that correspond to alpha-beta-mezosaprobic state (Fig. 2-15). Discrepancies are represented by systematic difference between the data, while the data measured by Hungarian side are higher comparing to the Slovak data. These values are characteristic for this stretch of the river. The self-purification processes, at this level of the saprobic index, run mainly as oxidising processes. Time series data of saprobic index indicate the slightly decreasing tendency during the last ten years. The saprobic index in the right side river branch system and in the Mosoni Danube at Vének profile fluctuate from 2.2 to 2.8, which correspond to alpha-beta-mezosaprobity. Other biological parameters The observations of the number of algae, the number of zooplankton and the macrozoobenthos according to the Agreement are performed four times in the year. Phytoplankton In the hydrological year 2000 the number of algae was determined in samples taken in December 1999, March and July 2000. The population densities were lower, similarly to that in the previous year, due to the unfavourable meteorological conditions for algae growth at the time of sampling. Maximal values in the Danube main riverbed, at Helena profile and in the Mosoni Danube at Lock No. I occurred in July (4570-7300 cells.ml-1). At the same time at the Vének profile on the Mosoni Danube 11100 cells.ml-1 was recorded. In the right side river branch system maximum of 21900 cells.ml-1 was recorded in the Ásványi branch. Similarly to the previous year the Diatoms dominate in the phytoplankton community, but during the spring the Chrysophyceae species were also abundant and in the summer the amount of green algae was significant, which were rich in species composition and in abundance of the Cryptomonas species. Similarly to the chlorophyll-a concentration relatively poor in algae, according to the number of algae - the seepage water remained. Zooplankton The zooplankton observations in hydrological year 2000 were carried out in April, May, August and September. Examining the zooplankton it was evident, that the number and density of species occurring in the Danube main riverbed was similar to that in the previous year. In species composition the Rotatoria species dominate (Brachionus, Keratella and Polyartha families). Significant difference in number of individuals between two sampling points was not observed. Some increase between two sampling sites was detected in May only (Danube-Rajka – 86 ind./ 20 l, Danube-Medveďov – 214 ind./ 20 l). Similarly to the Danube main riverbed, the density of Rotatoria and planktonic Crustacea in the Mosoni Danube was balanced. In the river branch system the zooplankton population slightly increase downwards the water supply flow path. In the Mosoni Danube at the Vének profile the abundance values peaked in April and May. Regarding the number of species and number of individuals the richest zooplankton population was observed in April and May, with the dominance of Rotatoria (Bdelloidea sp., Brachionus angularis and nauplius larvae (Copepoda)). The most rich in species and in number of individuals state in the seepage water occurred in September, with the dominance of Rotatoria (Keratella, Polyartha and Trichocerca families). Macrozoobenthos The aquatic macroscopic invertebrate communities in the hydrological year 2000 were sampled at the sampling points in July, August, October and November. The most diverse invertebrate communities were detected in August and October. It is probably due to lower discharges in the Danube because in samples taken during the higher discharges number of animals was lower. In the macroscopic invertebrate communities in the Danube the diversity of molluscs was dominant. In the Rajka profile the occurrence of insect taxa is sparse, while the distribution of higher Crustaceans is balanced and occur in relatively high number. In the water supplied to the Mosoni Danube more species have been recorded then in the Danube main riverbed. At the Vének profile the molluscs were the most characteristic. The results of the monitoring in the river branch system obtained along the longitudinal axis confirm the spreading of rheophile invertebrate taxons with the water supply and from the downstream direction. This is proved by higher number of organisms in the Ásványi river branch system (Ancylus fluviatilis, Jaera istri, Dikerogammarus villosus, some Trichoptera and Ephemeroptera species settled here). Periphyton Sampling in hydrological year 2000 was performed three times at selected profiles. The saprobic index of periphyton ranged from 1.64 to 2.3. Comparing to the previous year the range of values was wider. In hydrological year 2000 increase of organic pollution along the Danube from Bratislava to Komárno was observed. According to the species diversity of the periphyton the families of the Bacillariophyceae dominate. The families of Aulacoseira, Cyclotella, of Fragilariaceae group (Diatoma, Fragilaria) as well as Achnanthaceae group (Achanathes, Cocconeis) were frequent, but the most frequent were the families of the Naviculaceae group (Amphora, Cymbella, Gomphonema, Naviculla, Rhoicosphaenia) and Bacillariaceae group (Nitzschia). The Cyanophyta were sparse and in some of the samples the species of Scenedesmus family and Volvocales - Chlamydomonas and Carteria species occurred. In the Rajka profile Euglenophyta were also detected.
2.7. Quality of sedimentsThe sampling of riverbed sediments in area monitored in the frame of joint Slovak-Hungarian monitoring had been performed at the surface water quality sampling sites in June 5 and 15. Inorganic and organic micro components were analysed and the content of total phosphorus and nitrogen was also determined. Similarly to previous years the “Canadian list” was used for evaluation. This standard distinguishes three levels of pollution: level without pollution, the lowest pollution level and the serious pollution level. From among the inorganic micro-pollutants seven heavy metal components (Cu, Cr, Zn, Ni, Cd, Pb, and Hg) were analysed. According to the results it can be concluded that in 2000, similarly to the previous years, the pollution by heavy metals did not reach the “serious pollution level” at any of the sampling sites. There were places where the concentrations of heavy metals except chromium and nickel were higher than the respective limit values for the “lowest pollution level”. The mercury concentration was higher than the lowest limit value (0.2 mg.kg-1) in the Ásványi branch only. The zinc concentration over the limit value (120 mg.kg-1) was detected in sediments from the Ásványi and Helena arms and from sampling sites in the Mosoni Danube. The cadmium concentration was higher than the respective value of “lowest pollution level” (0.6 mg.kg-1) at two sampling points in the Danube, at the Vének profile in the Mosoni Danube and in the Cikola and Ásványi branches. The lead concentration was higher than the limit value (16 mg.kg-1) only in the Ásványi river branch, while the copper concentration was higher at Lock No. I and in the Helena and Ásványi branches. According to the above mentioned results it can be stated that the highest accumulation of heavy metals in the Ásványi river branch, while the lowest one was observed in the Danube main riverbed and in the seepage canal. From the organic micro pollutants the polychlorinated biphenyls (PCB) and polynuclear aromatic hydrocarbons (PAH) were analysed. The sum of PCB’s was determined by analyses of 8 isomeric compounds. The sum of PAH’s was determined by 13 polyaromatic hydrocarbon components. According to the obtained results it can be stated that the PCB and PAH contamination did not exceed the respective limits for the “lowest pollution level”, in case of PCB 70 mg.kg-1, in case of PAH 2000 mg.kg-1. Moreover the PCB concentration at all of the sampling points was lower than the detection limit (0.5 mg.kg-1). The lowest contamination by PAH was detected in sediments at Lock. No I and in the seepage canal, higher accumulation was observed in the Helena and Ásványi river branches and in the Mosoni Danube at the Vének profile. The total phosphorus content in sediments exceeded the limit value of “lowest pollution level” (600 mg.kg-1) at all sampling sites apart from the Danube main riverbed, the Cikola river branch and the seepage canal. The total nitrogen content in sediments exceeded the limit value of “lowest pollution level” (600 mg.kg-1) on all sampling points except the seepage canal, but neither the total phosphorus nor the total nitrogen contents reached the “serious pollution level” (2000 mg.kg-1 for the total phosphorus and 4800 mg.kg-1 for the total nitrogen) at any of the sampling sites.
2.8. ConclusionsIncreased and decreased values of some parameters seen from the long term evaluation in the Danube were already observed at Bratislava profile (109) which is situated upstream of Gabčíkovo-Čunovo structures and effect the surface water quality inflowing to the territory influenced by temporary measures according to the Agreement. The hydrological year 2000 was similar to the previous hydrological year. There were not observed extreme values of any parameters and the maximal values were lower comparing to the year 1996. Fluctuation of individual parameters characterising the surface water quality in the right-side river branch system, due to the continuous water supply since 1995, was in most cases modified, and follows the fluctuation in the Danube water. The tributaries and local pollution of settlements besides the water supply influence the water quality in the Mosoni Danube. Before the confluence with the Danube the water quality state is labile (variable in time), which is proved by unfavourable oxygen regime parameters, high content of dissolved solids, iron concentration and high values of COD, Coliform bacteria and saprobity index, but this is not connected to the water supply. Table 2-3: Classification of parameters or group of parameters according to the agreed limits for surface water quality classification
* In case of these parameters there were differences between the data measured by the Slovak and Hungarian Party, while measurements should be carried out at the same place and at the same time. Generally the different results obtained by Slovak and Hungarian Parties did not influence the classification of the surface water quality. However in parameters like pH, dissolved oxygen, saprobic index and BOD5 the obtained results are influencing the classification.
|
|||||||||||||||||||||||||||||||||||||||||||||||||||||||||||||||||||||||||||||||||||||||||||||||||||||||||||||||||||||||||||||||||||||||||||||||||||||||||||||||||||||||||||||||||||||||||||||||||||||||||||||||||||||||||||||||||||||||||||||||||||||||||||||||||||||||||||||||||||||||||||||||||||||||||||||||||||||||||||||||||||||||||||||||||||||||||||||||||||||||||||||||||||||||||||||||||||||||||||||||||||||||||||||||||||||||||||||||||||||||||||||||||||||||||||||||||||||||||||||||||||||||||||||||||||||||||||||||||||||||||||||||||||||||||||||||||||||||||||||||||||||||||||||||||||||||||||||||||||||||||||||||||||||||||||||||||||||||||||||