PART 1
Surface Water Quantity
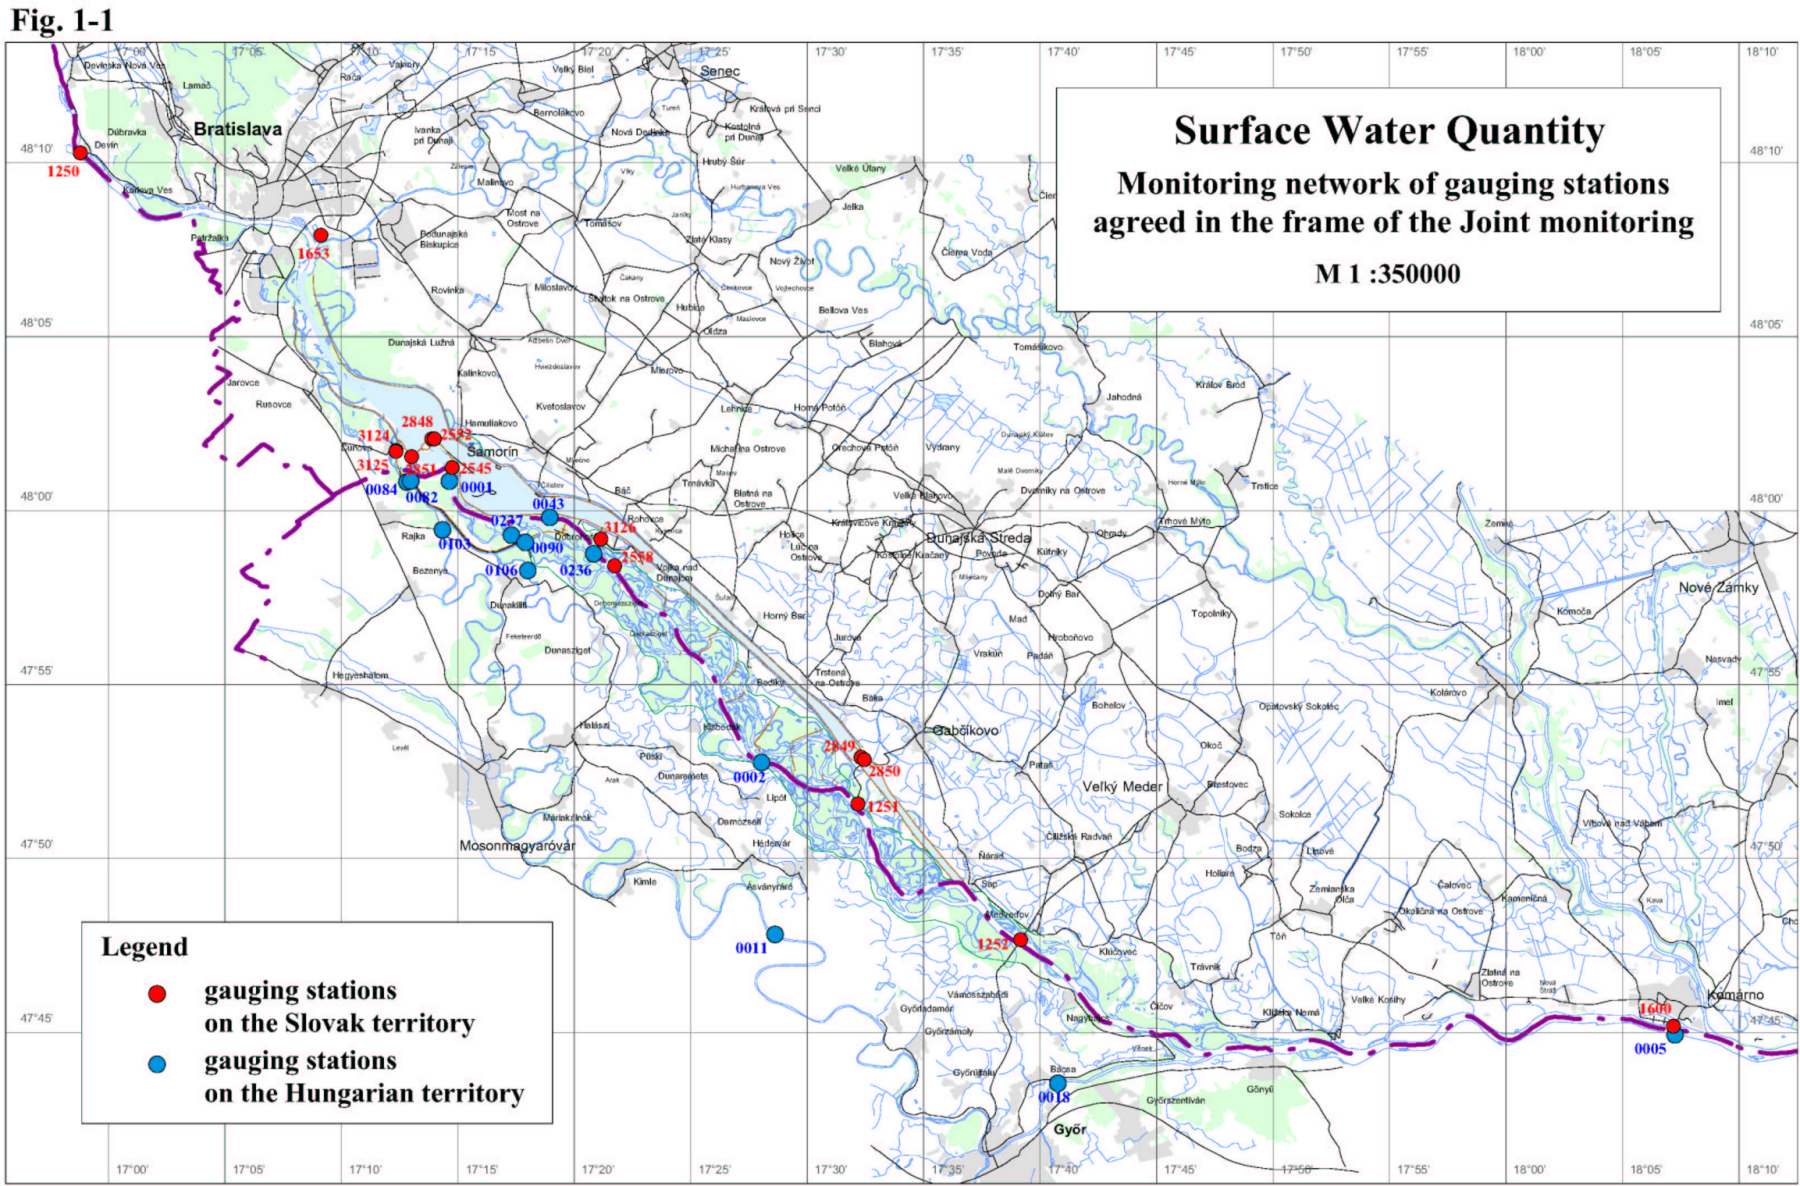
There were no changes in the monitoring of surface water discharges and levels. Similarly to previous years the observations was carried out on 15 gauging stations on the Slovak side and 13 gauging stations on the Hungarian side (Tab. 1-1). The situation of the observation network is shown on Fig. 1-1. According to the intergovernmental Agreement the Parties have undertaken to mutually exchange the data of agreed gauging stations in order to prepare joint evaluation. Joint measurements had also been performed in order to help the evaluation of discharges flowing into the Danube downstream of the Čunovo dam and into the Mosoni branch of the Danube. Based on mutual evaluation of joint measurements agreed time series data were accepted. These data creates the basis for evaluation of the measures realised according to the Articles 1-3 of the Agreement. Table 1-1: List of gauging stations
Temporary water management regime was set by intergovernmental Agreement, signed on April 19, 1995. It was agreed that in case of average annual discharge 2025 m3.s-1 at Bratislava the annual average of 400 m3.s-1 would be discharged to the Danube downstream of Čunovo. The daily amount of water discharged to the Danube riverbed is governed by the discharges reaching the Bratislava-Devín profile, taking into consideration the rules of operation described in the Annex 2 of the Agreement. The discharge in the vegetation period, depending on hydrological conditions, should fluctuate between from 400 to 600 m3.s-1, in the non-vegetation period the discharge should not be less than 250 m3.s-1. In case of floods the amount of water above 600 m3.s-1 discharged through the inundation weir is not taken into consideration when the annual average is calculated. Additional 43 m3.s-1 of water was agreed in the Agreement to discharge to the Mosoni branch of the Danube. On the basis of average annual discharges for different years at station No. 1250 it can be stated that the average annual discharge in hydrological year 2000 was much more higher than the average considered in the Agreement (Tab. 1-2) and the second highest since signing the Agreement. Table 1-2: Average annual discharges
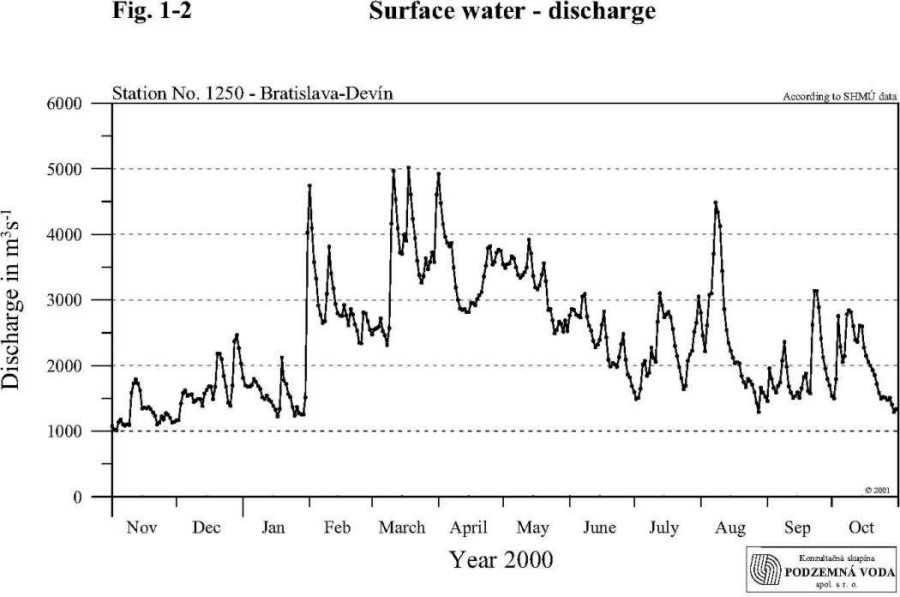
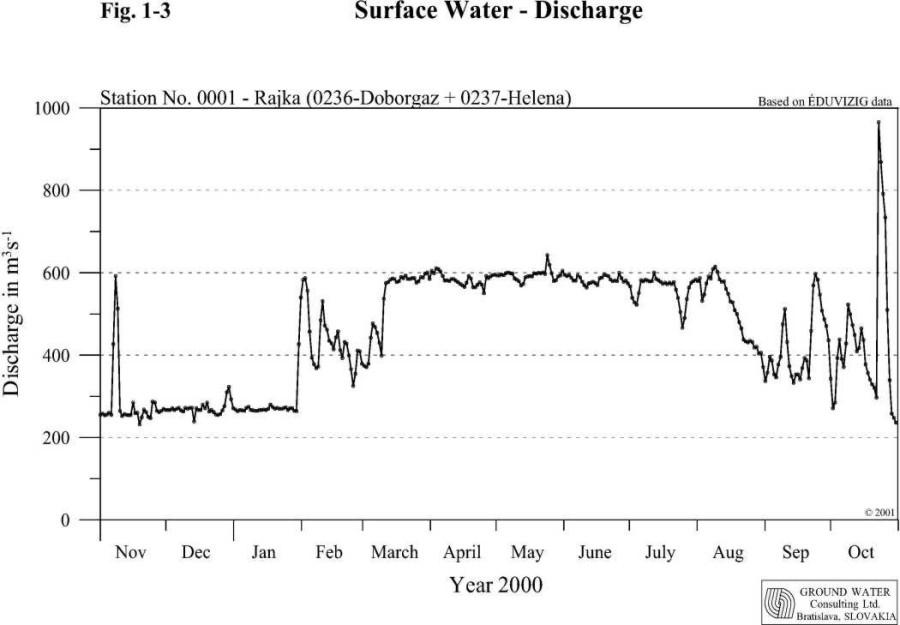
Low discharges in the Danube occurred in November 1999, January 2000 and at the end of hydrological year 2000, in October. The lowest average daily discharge occurred at November 3, 1999 when reached the value 1014 m3.s-1. Discharges over 3000 m3.s-1 in the Danube came at the beginning of February, during March, April and August, and occasionally in June, July and September. The maximal average daily discharges occurred during high discharge period in March 2000, when reached 5015 m3.s-1. Based on these values it can be stated that the high or low discharges does not reached extraordinary values. In spite of this, the average yearly discharge in 2000 was the second highest in the last ten years – app. 18 % over the long term average. The course of discharges during the hydrological year is shown in Fig. 1-2. 1.1. Discharge into the Danube downstream of ČunovoThe determination of the average daily amount of water discharged to the Danube downstream of Čunovo was based on average daily discharges measured at stations Doborgaz and Helena (Fig. 1-3). The monthly characteristics of the discharges into the Danube in the hydrological year 2000 were as follows: Year 1999 2000
The average annual discharge in the Danube at Bratislava-Devín profile in 2000 was 2392.87 m3.s-1. The average annual discharge flowing to the Danube downstream of Čunovo dam was 458.04 m3.s-1. When evaluating the amount of water discharged to the Danube old riverbed, it can be stated that Slovak Party fulfilled the average annual discharge jointly agreed in the Agreement, even some more water was discharged to the Danube. Taking into consideration the minimal values prescribed in the Agreement (in the winter period not less than 250 m3s-1, in the vegetation period at least 400 m3s-1) it can be stated that except few occasions (three times in the winter period and once at the end of the vegetation period) the minimal daily average discharges had been satisfied as well. On the other side in the vegetation period the maximal values of discharges were sometimes higher than the prescribed maximal value. In the hydrological year 2000 a riverbed discharge capacity measurement was carried out. Unfortunately it had not been realised in the vegetation period, and the planned average discharge had not been reached as well, due to the low discharges in the Danube during the measurements.
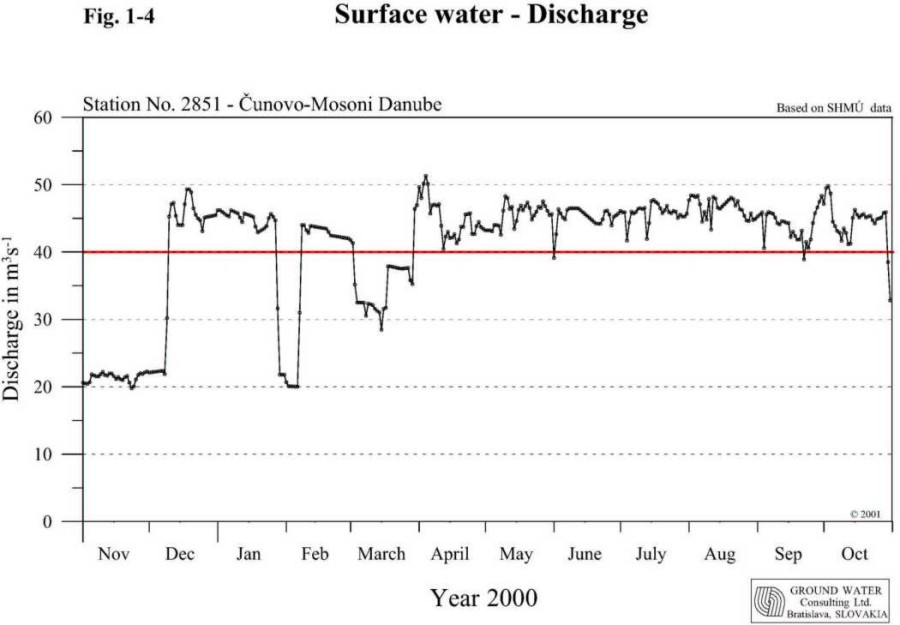
1.2. Discharge into the Mosoni branch of the DanubeThe discharge into the Mosoni branch of the Danube according to the Agreement should be 43 m3.s-1, which is composed by the discharge released to the Mosoni branch of the Danube through the intake structure at Čunovo and the discharge through the seepage canal. Discharge measurements are carried out at profiles situated on the Slovak territory at 0.160 rkm and upstream of lock No. I on the Hungarian territory. The average daily discharges were agreed after the joint evaluation of discharge measurements performed at both profiles. In the evaluation the data measured just downstream of the intake structure were considered (Fig. 1-4). The monthly characteristics of the discharges into the Mosoni Danube in the hydrological year 2000 were as follows: Year 1999 2000
The average annual discharge was 41.12 m3.s-1. It can be stated that in the evaluation it was not necessary to study the technical and hydrological circumstances for discharging water to the Mosoni Danube. The discharge in the right side seepage canal was measured at two profiles. The first is on the Slovak territory at Čunovo; the second is placed on the Hungarian territory at lock No. II. In the evaluation the data observed at lock No. II were considered. The monthly characteristics of the discharges recorded at lock No. II were as follows: Year 1999 2000
The average annual discharge was 1.20 m3.s-1. There is a continuous slow decrease of discharge observed in the seepage canal, so the hydrological conditions does not allow releasing 3 m3.s-1, which is envisaged in the Agreement. The total average annual discharge released into the Mosoni branch of the Danube was 42.32 m3.s-1. Taking into consideration that the seepage into the canal cannot be regulated it can be stated that the average annual discharge was fulfilled.
1.3. Water distribution on the Hungarian territoryThe goal of the water distribution on the Hungarian side is to provide continuous water supply into the inundation area, in the river branches on the flood-protected area and into the Mosoni Danube.
1.3.1. Water supply into the inundation areaThe inundation area on the Hungarian side can be supplied by water from two sources:
Joint discharge measurements by both Parties were performed at the Helena profile too. The measurements were jointly evaluated and average daily discharges data were prepared. The monthly discharge characteristics at Helena profile in hydrological year 2000 were as follows: Year 1999 2000
The average annual discharge was 72.2 m3.s-1. The monthly discharge characteristics at the lock No. V: Year 1999 2000
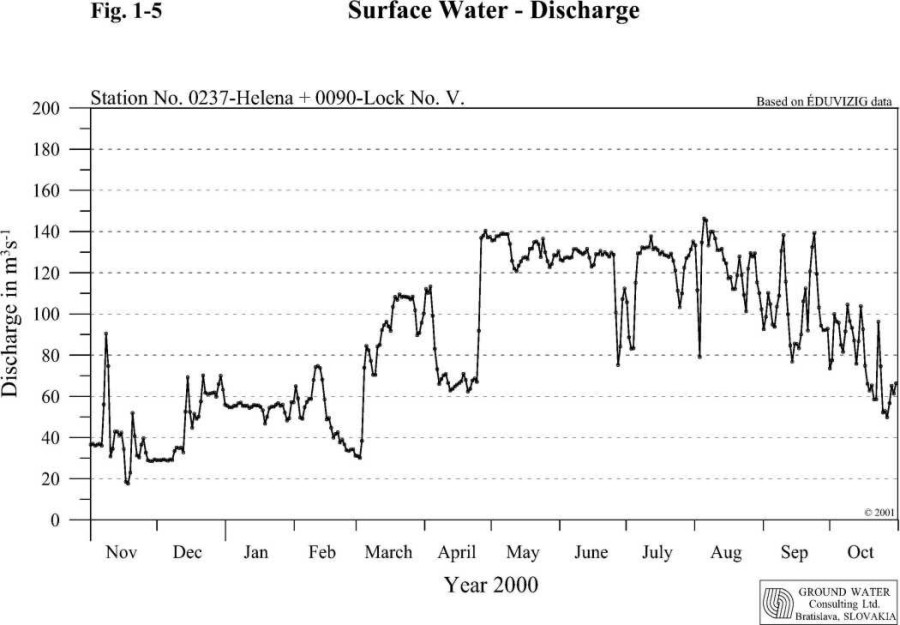
The average annual discharge was 12.99 m3.s-1. The monthly discharge characteristics of the total amount of water discharged into the inundation area in hydrological year 2000 (Fig. 1-5): Year 1999 2000
The total average annual discharge supplied to the inundation area was 87.30 m3.s-1.
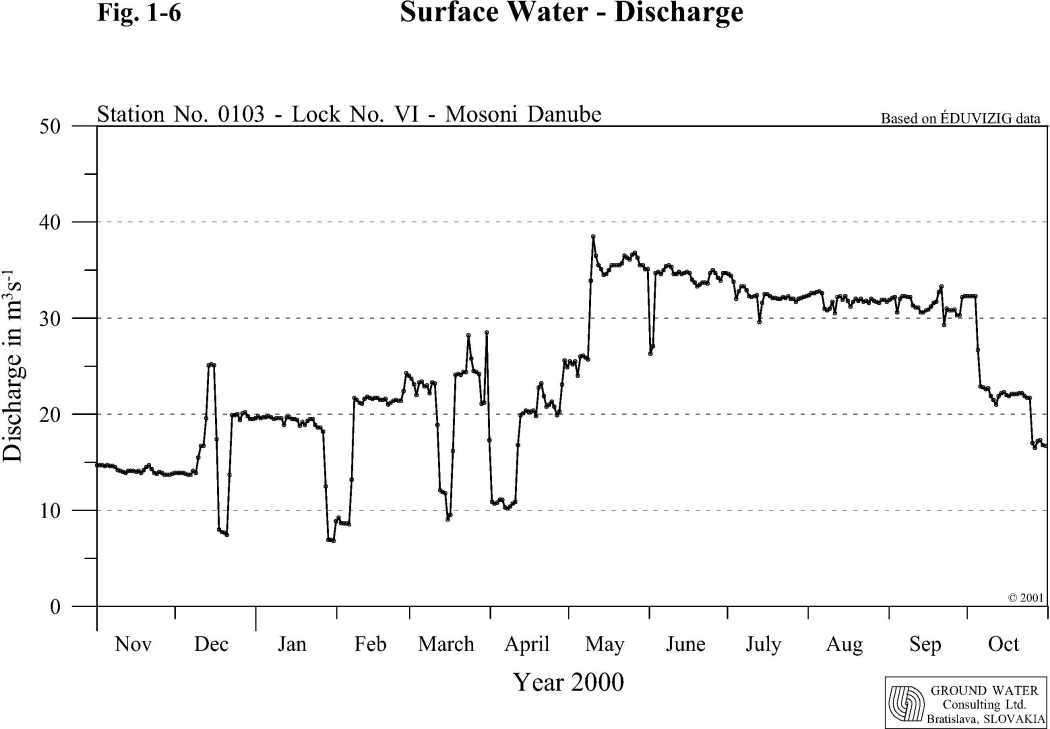
1.3.2. Water supply into the Mosoni DanubeThe water supply into the Mosoni Danube is provided from the seepage canal through the lock No. VI (Fig. 1-6). The discharge is measured at the profile downstream of the lock. The monthly characteristics of the discharges through the lock No. VI in hydrological year 2000 were as follows: Year 1999 2000
The average annual discharge in the Mosoni Danube at lock No. VI. was 24.3 m3.s-1. During the non-vegetation period low water period was simulated in Mosoni Danube water supply as well. This was reached by redirecting a large part of the water from the seepage canal into the inundation area through the lock No. V., while the water amount taken from the Danube was reduced. Besides the water supply function the lock No. I has also a flood protection function. It prevents floods to enter the flood-protected area. During the hydrological year 2000 there was no need to keep the lock closed.
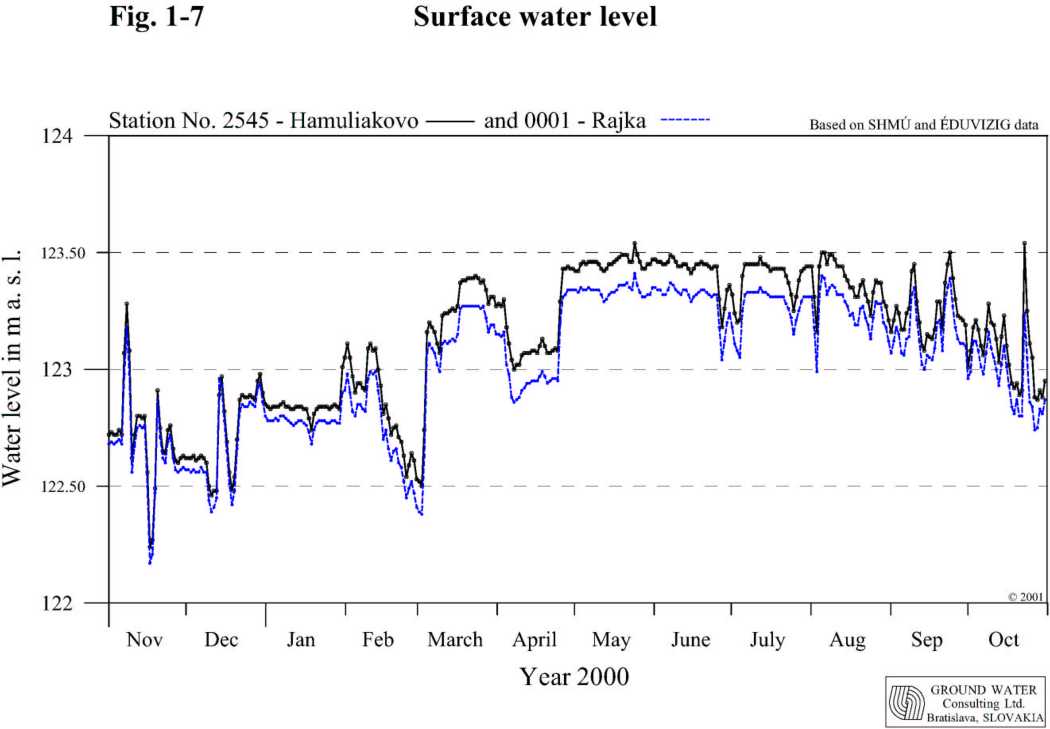
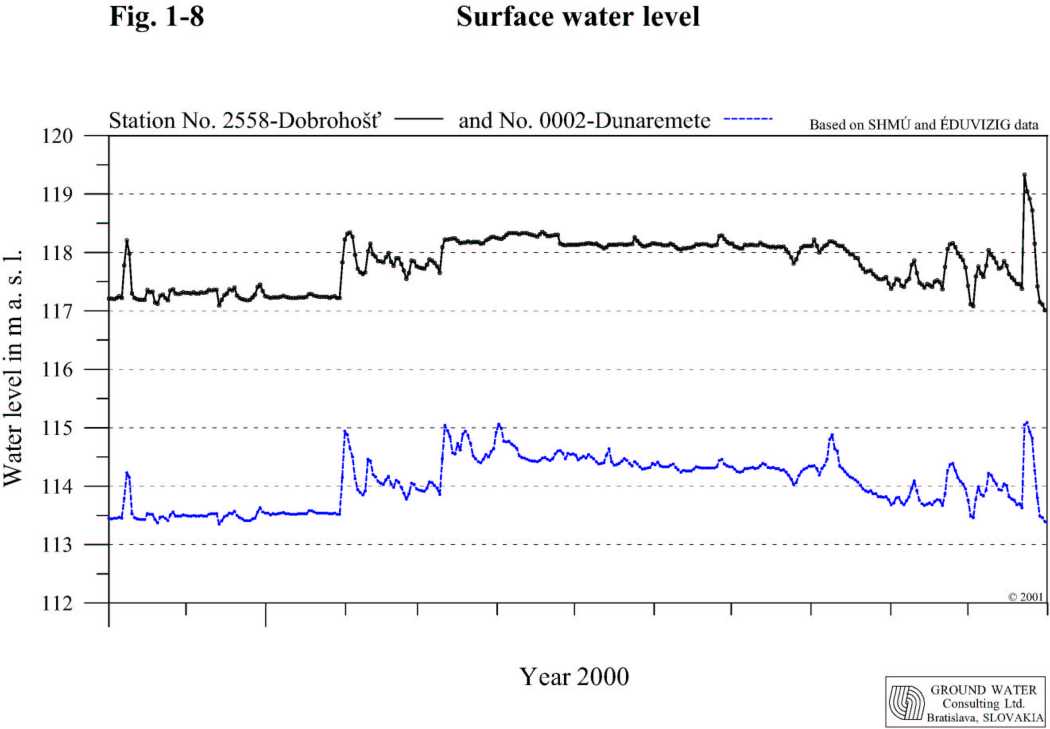
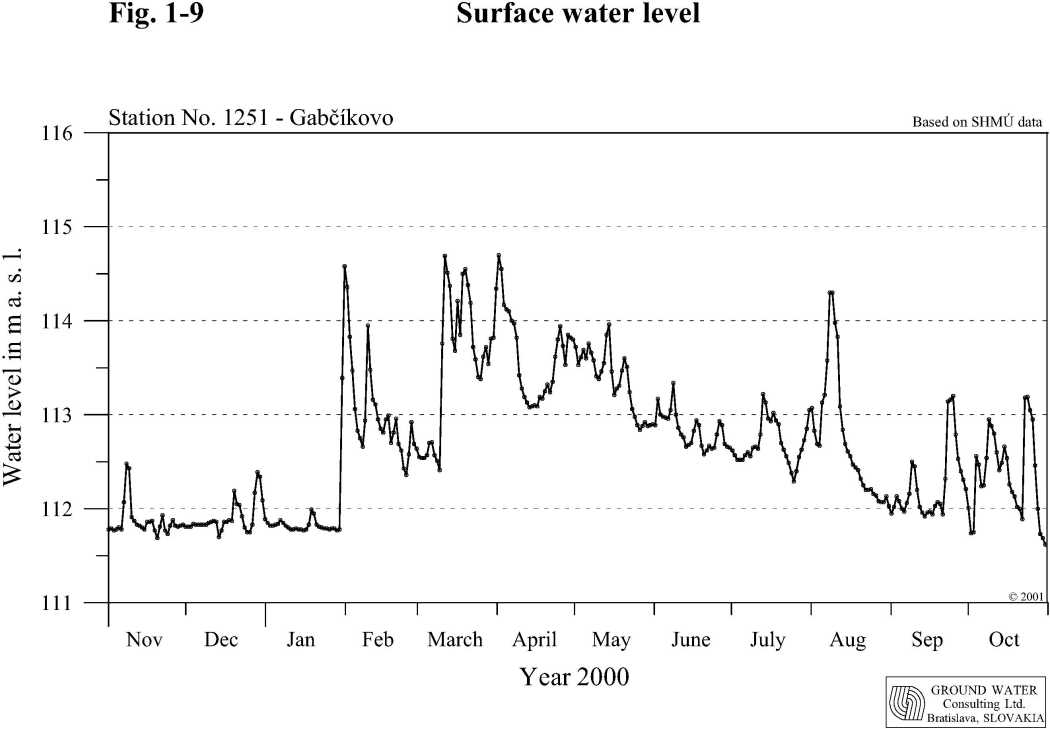
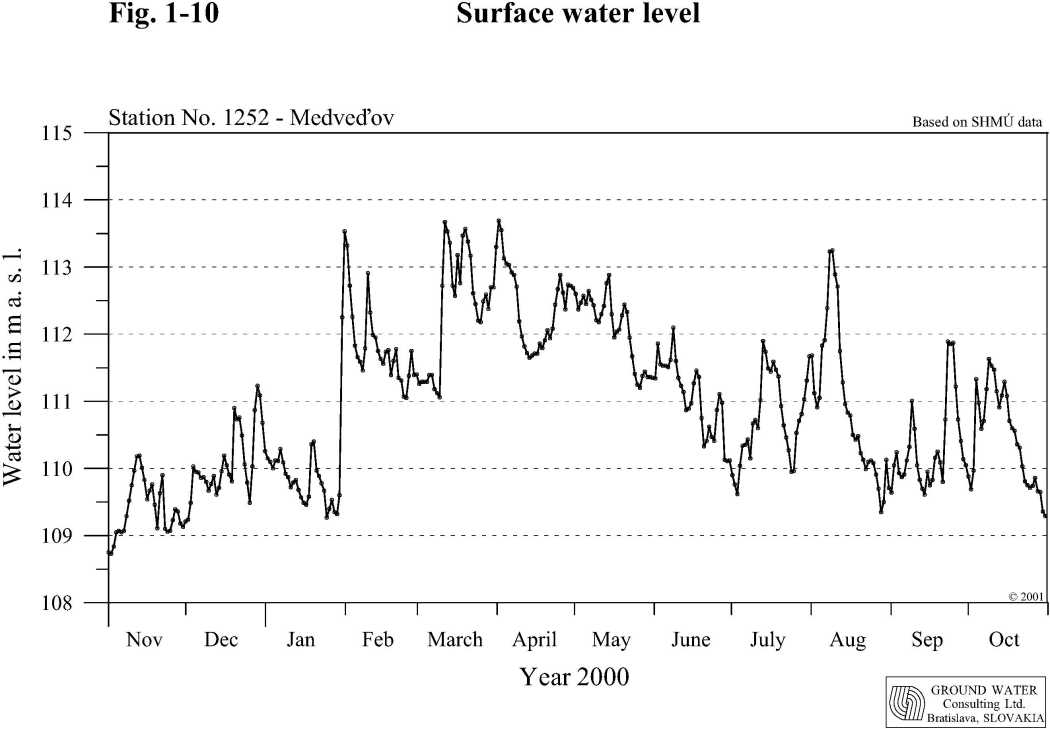
1.4. The Danube water level characteristics on the Čunovo-Vámosszabadi stretchAccording to the prevailing influence the Danube stretch between Čunovo and Vámosszabadi can be divided into four different sections. The characteristics of these sections are based on data obtained from the following gauging stations: Rajka and Hamuliakovo, Dunakiliti, Doborgaz and Dobrohošť, Dunaremete and Gabčíkovo. Vámosszabadi and Medveďov. The four sections on the Čunovo-Vámosszabadi stretch are the following:
|
||||||||||||||||||||||||||||||||||||||||||||||||||||||||||||||||||||||||||||||||||||||||||||||||||||||||||||||||||||||||||||||||||||||||||||||||||||||||||||||||||||||||||||||||||||||||||||||||||||||||||||||||||||||||||||||||||||||||||||||||||||||||||||||||||||||||||||||||||||||||||||||||||||||||||||||||||||||||||||||||||||||||||||||||||||||||||||||||||||||||||||||||||||||||||||||||||||||||||||||||||||||||||||||||||||||||||||||||||||||||||||||||||||||||||||||||||||||||||||||||||||||||||||||||||||||||||||||||||||||||||||||||||||||||||||||||||||||||||||||||||||||||||||||||||||||||||||||||||||||||||||||||