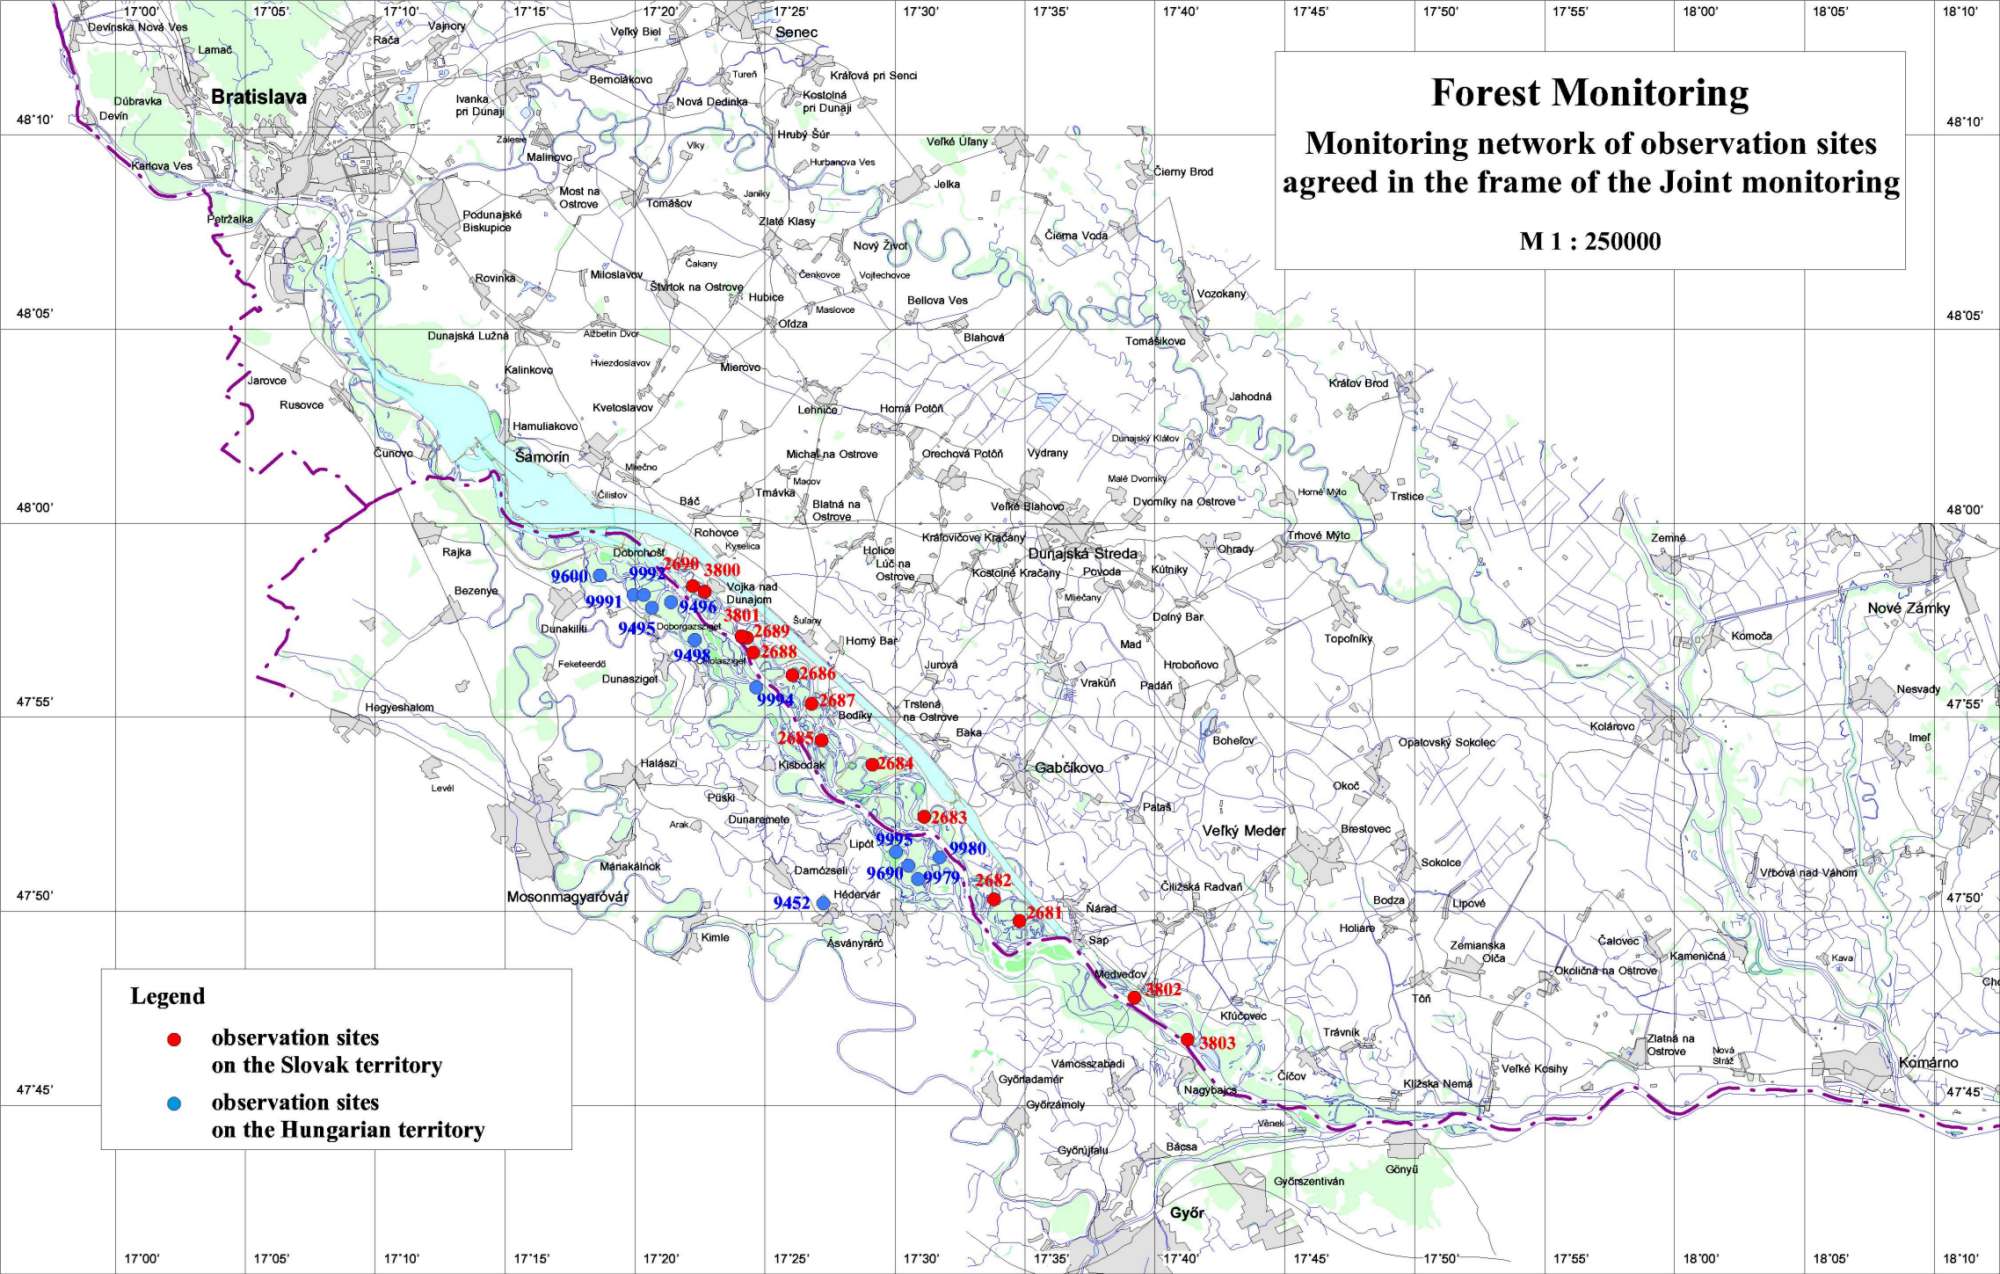
PART 6Forest MonitoringBoth countries examine the growth and the health state of trees on forest stands in similar way. Monitoring sites on the Slovak and Hungarian territories, included in the joint monitoring are shown on Fig. 6-1. In the present report the Slovak Party evaluates the yearly wood yield data as well as the weekly girth growth and the health state of trees on forest stands for the year 1999. The Hungarian Party evaluated the monitoring results in similar way, but in the yearly wood yield data evaluation only the data for year 1998 are included. In 1999 aerial survey of the health state of forest in the inundation area was performed. The evaluation of the aerial photographs from the Slovak side was completed. Evaluation of the aerial photographs from the Hungarian side starts in 2000. 6.1. The Slovak territoryThe forest monitoring on the Slovak side is carried out on twelve forest monitoring areas (Tab. 6-1). All of them are situated in the inundation area (Fig. 6-1). On these monitoring areas grow the most productive communities of soft floodplain forest with high demand on water. These forest stands were considered as the most endangered after construction the Gabčíkovo hydropower structure. The inundation area was divided into a part with a water level that can be regulated by weirs (monitoring sites No.2683-2690) and into a part, where the water level is not regulated and depends on the water level fluctuation in the Danube (monitoring sites No. 2681, 2682, 3802 and 3803). Table 6-1: List of the forest monitoring areas on the Slovak side
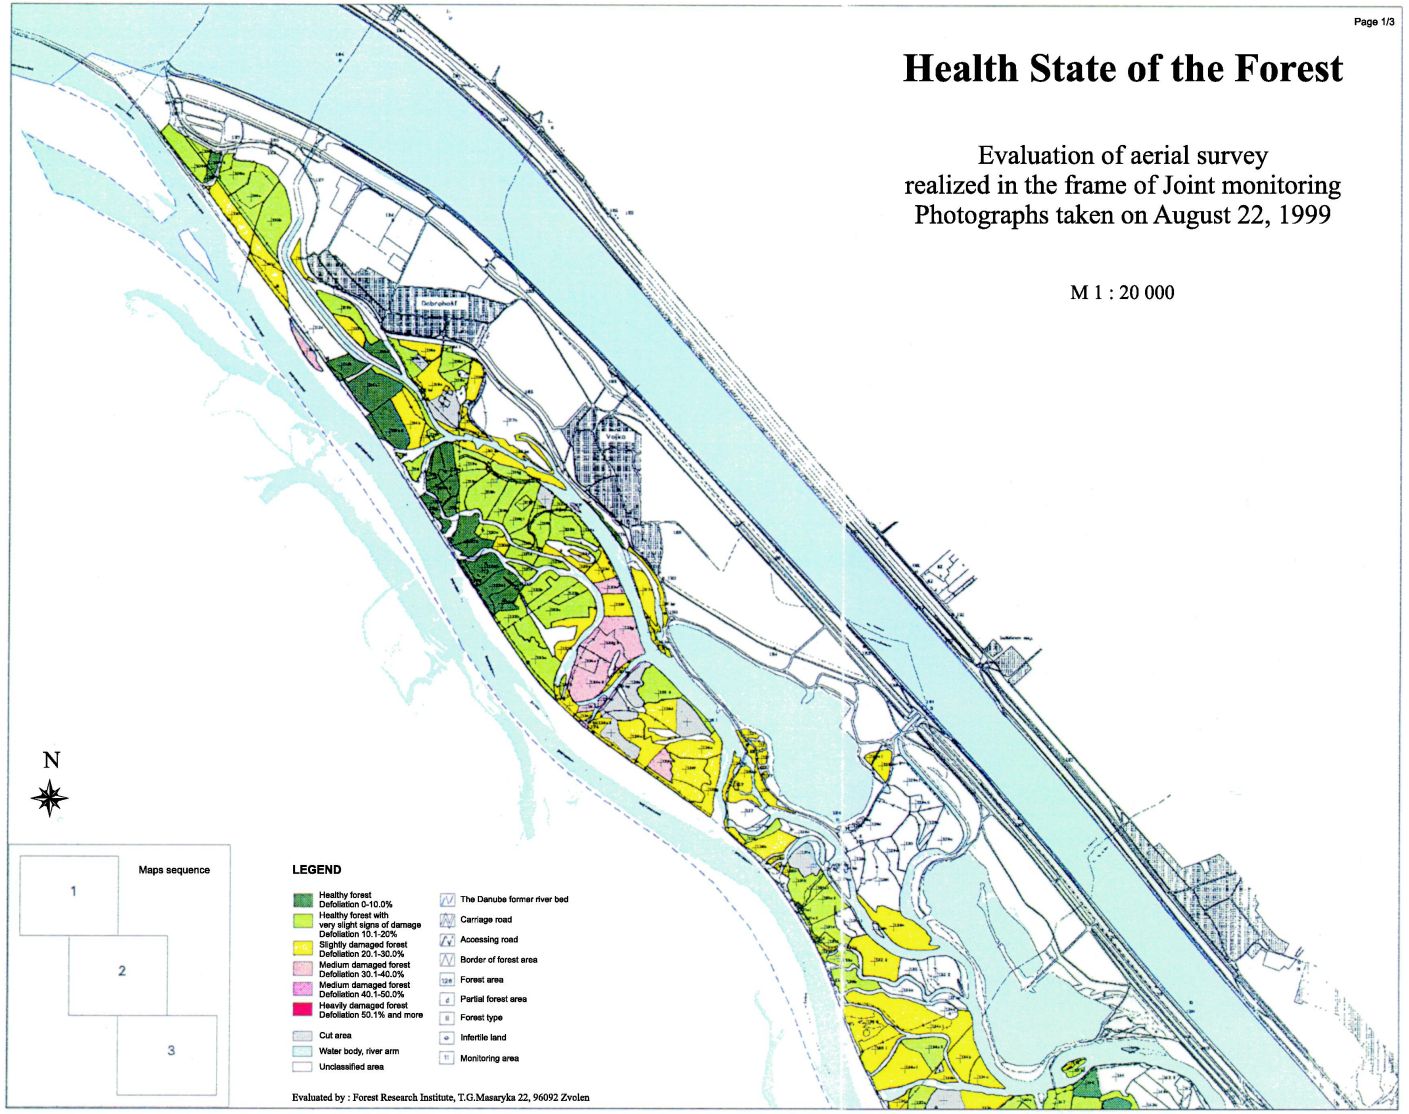
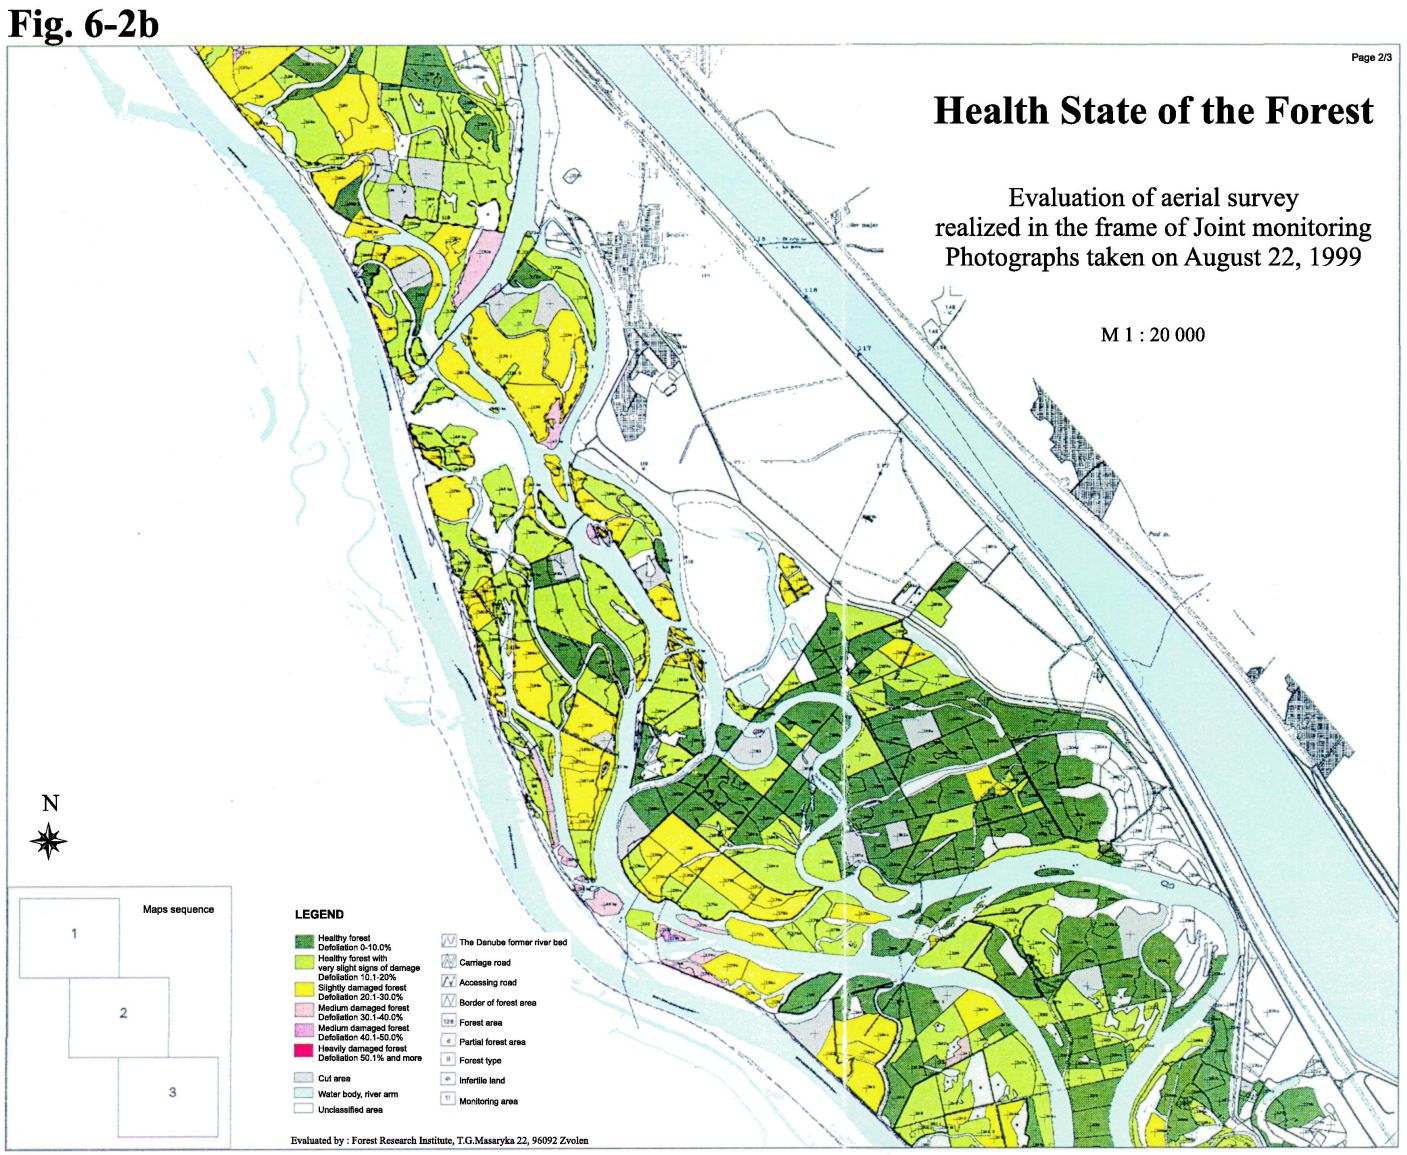
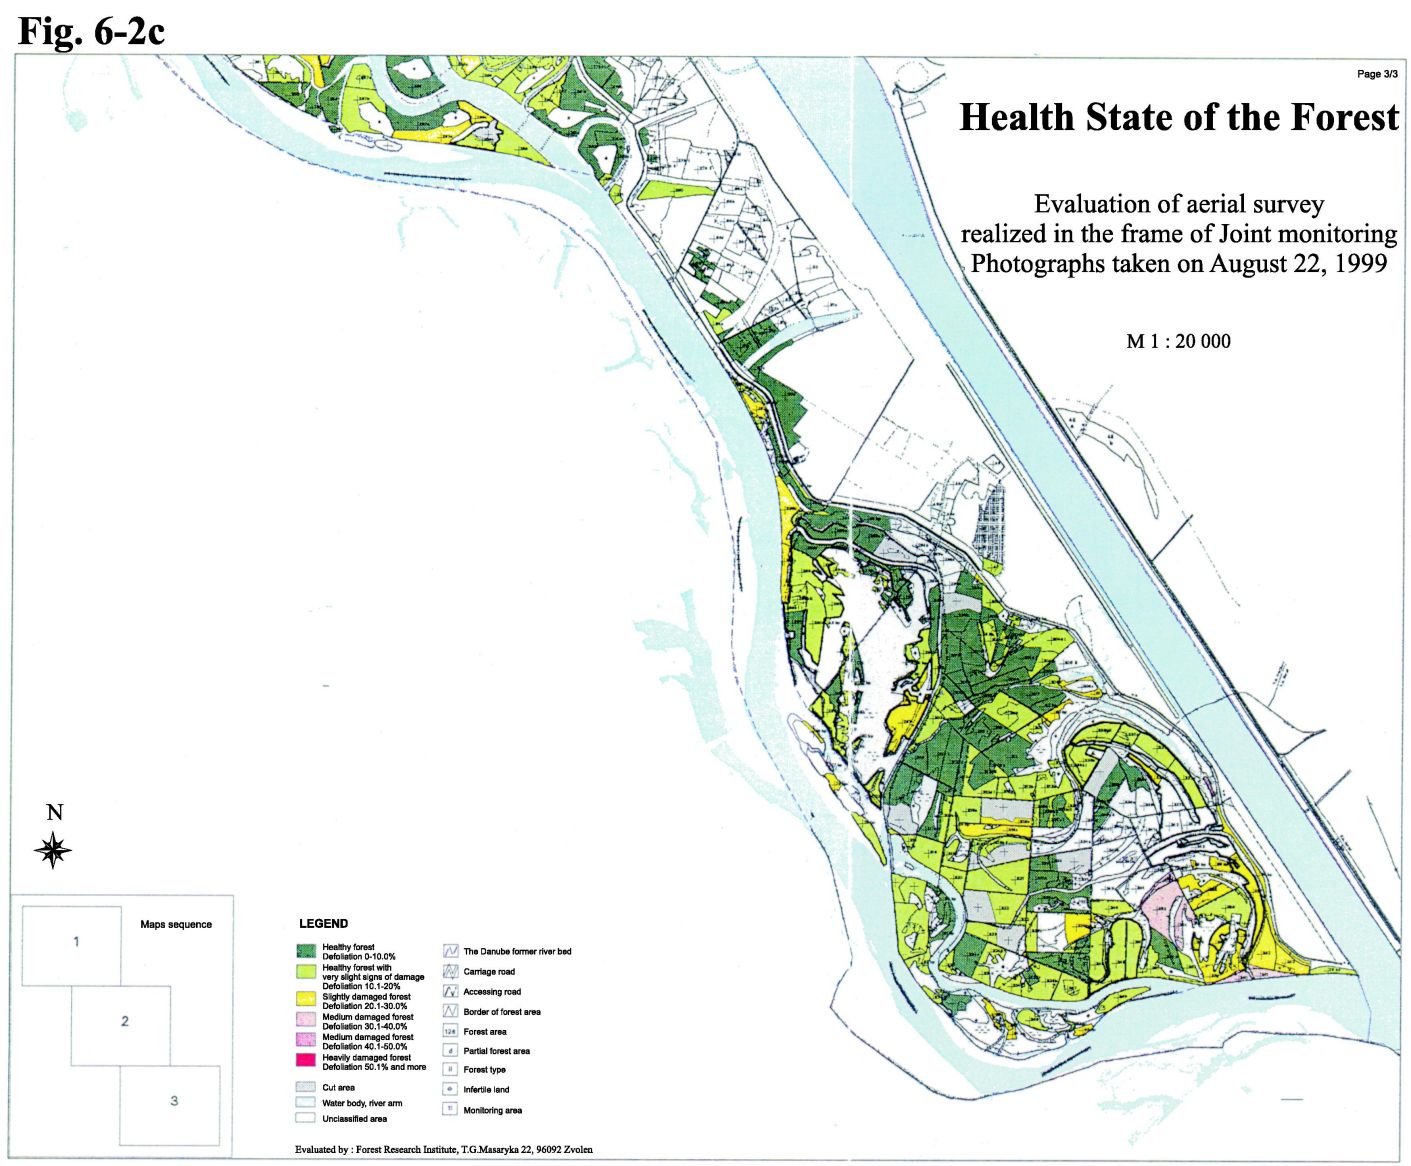
There were two monitoring sites cut out and replaced by new monitoring sites and two new monitoring sites were created downstream of the confluence of the Danube and the tailrace channel. Dendrometric measurements performed on the willow stand prove that the growth of trees meets the theoretical growth data. The cumulative girth growth data in 1999 were even higher comparing to the previous year (monitoring site No. 2681). While evaluating the measured height and diameter increments of poplars (populus x euroamericana var. “Robusta” and var. “Italica” – I-214) it can be said that they meets the usual growth standards. Some changes were observed on monitoring sites along the Danube river bank or on monitoring sites with older stands. All of the monitored forest areas according to the growth parameters belong to the I. quality class. The evaluation of aerial photographs taken on August 22, 1999 shows that the health state of the forest in the inundation area is very good. Based on the results it can be stated that the average defoliation of trees was 13.2 % (in 1996 it was 16.9 %). According to the classification used in the frame of ICP Forest Programme 73.5 % of forest belong to the healthy forest or forest with very slight signs of damage (in 1996 61.2 %). To slightly damaged forest belong 22.0 % of forest stands (in 1996 33.5 %) and to the medium damaged forest belong 4.1 % of forest stands (5.3 % in 1996) (Fig. 6-2a-c). 6.2. The Hungarian sideThe forest monitoring on the Hungarian side was carried out on twelve monitoring areas (Tab. 6-2). Eleven of them are situated in the inundation area - Fig. 6-1. Some of the monitored areas were replaced by newly established areas. The growing conditions for trees in 1999 were very favourable – higher amount of precipitation and significantly raised ground water level (compared to period 1993-1994), which fluctuated in the soil layer. Due to the higher discharges in the Danube and the backwater effect upstream the confluence of the Danube with the tailrace channel, areas below the Ásványráró were flooded for about two weeks. Table 6-2: List of the forest monitoring areas on the Hungarian side
Regarding the growth increment data and wood production analysis in the last ten years period it can be stated that the wood production in the period 1993-1995 dropped back significantly on almost all monitoring areas. According to the data from 1998 it can be said that the decrease of increments was very slight, even some increase was observed on some of the forest areas. These changes can be related to the water supply introduced in 1995 and favourable climatic conditions as well. However, the growth rate on areas lying close to the Danube riverbed is still low because of the Danube drainage effect. According to the weekly girth growth data measured on selected trees it can be stated that the real growing period was 22 weeks. In general it can be stated that on the monitoring areas higher increments were measured in comparison to the previous years. However, the growth increments still are not fully returned to the growth rate before damming the Danube. The health state of poplar stands was very good. Trees had rich and wide crowns. The leaf damage in the summer caused by leaf eating insects was small. On the other hand, the willow stands, especially on the upper and middle part of the Szigetköz, were characteristic by middle health condition only. However, there were a lot of young shoots observed on the drying trees due to the favourable conditions. But the moisture conditions on these stands due to the missing floods became unfavourable for willows. The height and the density of the herb vegetation in 1999 varied a lot. In the lower part of the Szigetköz, where the area was flooded the herb layer was damaged and did not reached the height of 50 cm. On the other places the herb layer was in comparing to the previous year much higher. The observation the plant vegetation also proves the necessity of artificial floods in the inundation area.
|
|||||||||||||||||||||||||||||||||||||||||||||||||||||||||||||||||||||||||||||||||||||||||||||||||||||||||||||||||||||||||||||||||||||||||||||||||||||||||||||||||||||||