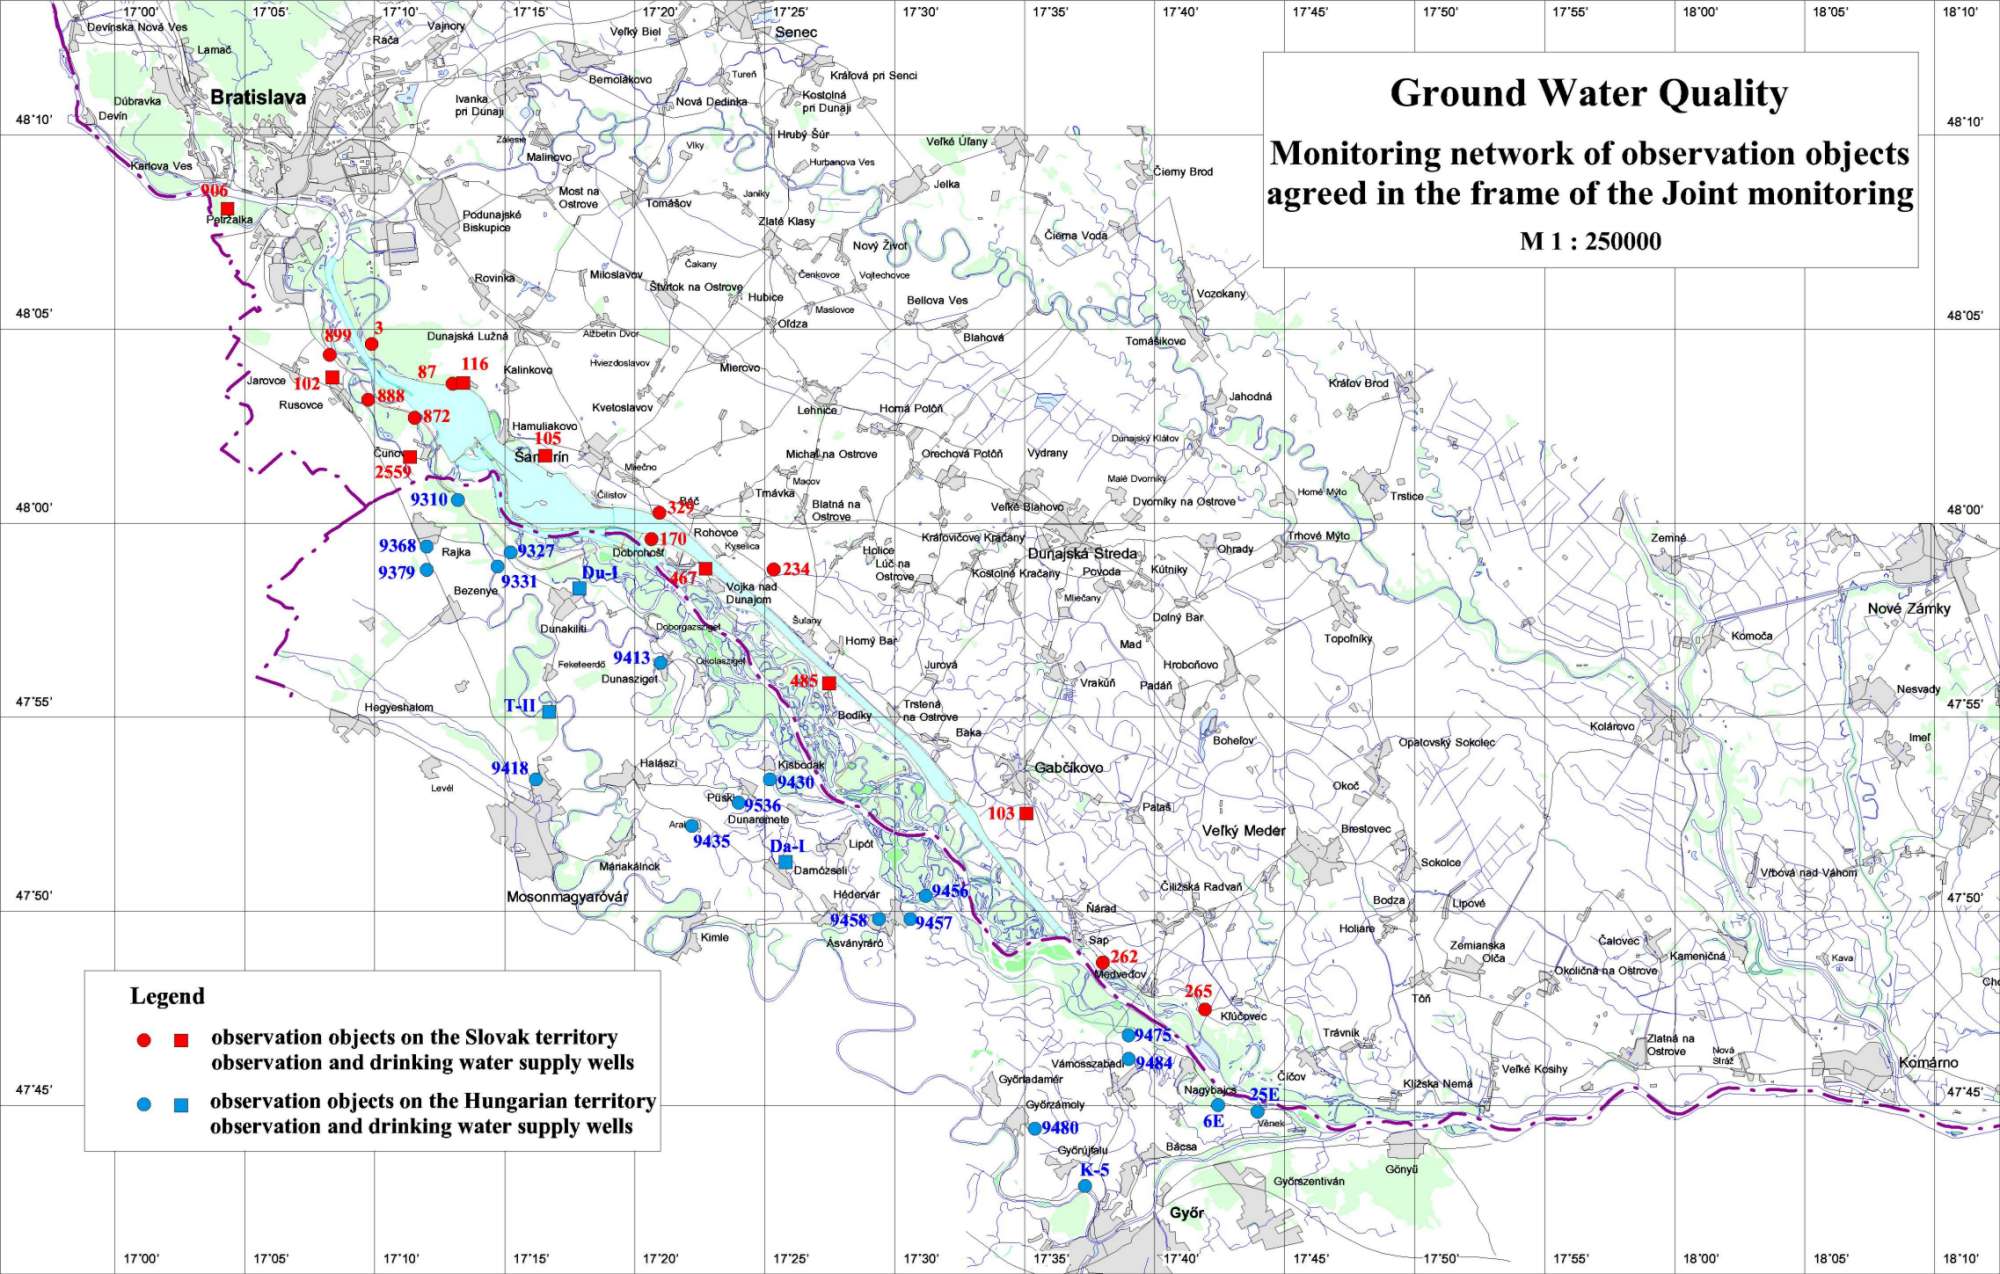
PART 4Ground Water Quality4.1. Hungarian territoryThe subject of the joint ground water quality monitoring on the Hungarian side consists of 22 wells, from among 16 objects are ground water quality observation wells, situated in the upper layer of the gravel sediments, and 6 wells are used for drinking water supply (Tab. 4-1). Samples were taken 4 times during the year. The sampling and analysis methods were the same as in the previous year. The water quality monitoring in the observation wells was carried out by the North-Transdanubian Authority for the Environment Protection, the water quality monitoring in the wells for drinking water were carried out by Regional Waterworks Companies. Wells included in the ground water quality monitoring are situated on the Fig. 4-1. Table 4-1: List of monitoring objects on the Hungarian territory
According to bilateral Slovak-Hungarian agreement long time evaluation of 18 water quality parameters were done for two wells in the period 1992-1999. These wells are the No. 9430 at Kisbodak and the No. 9327 at Dunakiliti. The data series for the selected wells and water quality parameters in a graphic form were shown in the Hungarian National Annual Report. The water quality data of the all others monitored wells were presented in tabular form. Well No. 9327 at Dunakiliti According to the ground water quality limit values for drinking water, the water from this well satisfies the agreed limits (Tab. 4-3). Comparing the long time series of the water quality data in this well it can be stated that the iron concentration varies in the range from 0.04 to 0.16 mg.l-1. Comparing to the year 1997 the dissolved oxygen content considerably increased and fluctuated in the range from 0.1 to 2.4. The measured values of CODMn, which usually show the level of the organic pollution in the ground water, fluctuated in the range from 1.2 to 1.5 mg.l-1. The other chemical parameter remained unchanged. Taking into consideration the long term time data series it can be concluded that the seasonal variation in ground water quality is more significant in the upper part than in the middle part of Szigetköz. The seasonal variation can be primarily shown in water temperature, electric conductivity, nitrate, sodium and chlorine. The fluctuation of iron concentration and very slight increase of COD is probably connected with the formation of redox conditions in the ground water and changes in ground water flow. Well No. 9430 at Kisbodak Comparing to the previous year the concentrations of manganese remained almost unchanged while the iron concentration slightly decreased. In 1999 the manganese and iron contents varied between 0.65-0.7 mg.l-1 and between 0.06-2.1 mg.l-1 respectively. Due to the relatively high manganese and iron content the water from this well does not satisfy the drinking water criteria (Tab. 4-3). Taking into consideration the long term time data series of sulphate ion it can be concluded that the decrease of concentrations is significant. In 1998 and 1999 the concentration of sulphate ion fluctuated from 48 to 58 mg.l-1. The COD values in 1998 and 1999 have stabilised and fluctuated in the range from 0.9 to 1.7 mg.l-1. Comparing to the year 1997 the dissolved oxygen content considerably increased and fluctuated in the range from 0.0 to 3.1. It is probably connected with the water supply of the inundation area in Szigetköz realised in the framework of the Agreement. Based on the water quality analyses results on the remaining 14 observation wells it can be concluded that 60 % of the wells does not satisfy the drinking water limits due to high iron and manganese content, half of them due to ammonium ion concentration, and one third due to high nitrate content. The most polluted wells are No. 9368 at Rajka, No. 9413 at Sérfenyősziget, No. 9418 at Mosonmagyaróvár and No. 9458 at Ásványráró. Besides the high dissolved solids content, the concentrations of ammonium, nitrate, sulphate and manganese ion are higher than the agreed limits. The water in the middle part of Szigetköz, in the Arak, Püski, Ásványráró and Győrzámoly regions, usually has medium dissolved solids content and higher amount of iron and manganese, which is characteristic for this region. The water in lower part of the Szigetköz besides with the higher iron and manganese content has lower dissolved solids content. According to the results from drinking water wells included in the joint monitoring it can be stated that in 1999 in the wells around the Győr a very low increase iron, manganese and ammonium concentration was observed. In the other wells, which take the water from higher depth, the water quality remained unchanged. In general it can be concluded that the water quality parameters in the drinking water wells are stabile. 4.2. Slovak territoryFor the purposes of the Slovak-Hungarian monitoring the data of the Western Slovakia’s Waterworks and Sewerage Enterprise (ZsVaK), the Waterworks and Sewerage Enterprise Bratislava (VaK) and Slovak Hydrometeorological Institute (SHMÚ) were used. The objects of Waterworks are used for drinking water supply; the SHMU’s objects are observation wells (Tab. 4-2). According to the chapter 8.2 paragraph 5 of the Joint Annual Report on the Environment Monitoring in 1998, the evaluation of the ground water quality should include more observation objects. Period between October 1, 1992 and October 31, 1999 was agreed for the evaluation. Table 4-2: List of monitoring objects on the Slovak territory
Short evaluation of the ground water quality objects included in the data exchange In comparison to the previous year there were no significant changes in the observed parameters during the hydrological year 1999. The observed values of all parameters except iron (at objects No. 170, 262 and 234) and manganese (at objects No. 485, 899 and 116) satisfy the agreed limits for ground water quality evaluation. Some of the parameters (electric conductivity, Ca2+, Mg2+, Cl- and SO42- ) confirmed the stabilisation of ground water quality at objects on the right side of the reservoir (objects No. 102 and 899). The object No. 3, situated close to the Danube, show the natural rhythm of the Danube water quality fluctuation just after infiltration to the ground water. Nutrients are important components of all processes undergoing in the water. Nitrate concentrations in observation objects No. 116, 87, 105, 467, 2559 show decreasing tendency in the observed period. The nitrate content in objects No. 102, 872 and 170 slightly decreased after putting the hydropower structure into operation and similarly to the other water quality parameters had stabilised in 1994. In objects No. 103 and 329 there is a slight increase of nitrate concentrations. In the rest of objects there is no change in this parameter. Nitrite concentrations in all of the observed objects (except objects No. 170, 234, 262 and 872) in long run fluctuate below the detection limit, rarely reaching the value of 0.05 mg.l-1. The nitrite concentration in objects No. 234, 262 and 872 mainly fluctuated up to 0.05 mg.l-1. In the object No. 170 the values fluctuated in the range between 0 to 0.15 mg.l-1. The ammonium ion concentrations in all object fluctuated below 0.05 mg.l-1 except the object No. 899. In this one the concentration of ammonium ion show slightly increasing tendency during the observed period and fluctuate in the range up to 0.6 mg.l-1. The concentration of phosphate in wells for drinking water supply fluctuates up to 0.1 mg.l-1 in the observed period. The situation in observation wells is similar, but rarely the concentration reaches values over 0.1 mg.l-1, maximally up to 0.25 mg.l-1. In objects No. 102, 2559 and 906 there is a slight increase of phosphate concentration observed from 1997, which is probably connected to the increase of phosphates in the Danube water in 1996. The oxygen concentrations usually fluctuate up to 1 mg.l-1. Higher concentrations were measured in object No. 3, which is situated near the Danube and the concentration values follow the values in the Danube water, and in the right side drinking water wells (objects No. 102, 2559 and 906), where the oxygen concentrations fluctuated in the range from 1 to 6 mg.l-1. Lower oxygen concentrations in the long run were measured in observation object No. 87 and fluctuated from 0 to 0.2 mg.l-1. CODMn values in objects situated on the right side of the Danube and reservoir (except observation objects No. 467 and 485) had decreasing tendency during the observed period. On the left side of the Danube there was a slight increase of CODMn values observed. The increase of values characterising organic pollution in the water probably depend on the Danube water quality, in which an increase of BOD, TOC and CODMn values was detected in the period 1992-1997, especially during higher discharges. However, in the long run 1989-1999 there is continuous slight decrease of values characterising the organic pollution in the Danube water. Iron and manganese are typical components of the ground water. In this region they are characteristic components of the hydrogeological environment; it is not a pollution. Chemical form of the iron and manganese in ground water depend on the pH, redox potential, and presence of inorganic or organic compounds or presence of microorganisms. The iron concentrations in all objects (except objects No. 170, 262 and 234) fluctuate below the value of 0.3 mg.l-1, which is the limit value for drinking water. Higher value in observation objects No. 170 and 234 can be caused by construction of these observation objects. On the object No. 262 the iron concentration fluctuate up to 1 mg.l-1. The manganese concentration in all objects (except observation objects No. 485, 899 and 116) fluctuates below the value of 0.1 mg.l-1, which is the limit value for drinking water. In observation objects No. 485 and 899, situated on the right side of the reservoir, the manganese concentration in observed period (1992-1999) fluctuate from 0.2 to 0.8 mg.l-1. In the well No. 116 and very rarely in other observation objects the manganese concentration reaches the value of 0.2, maximally 0.3 mg.l-1. The following table shows the limits for drinking water quality used for evaluation in the frame of joint monitoring: Table 4-3: Ground water quality limits for drinking water.
IV – indicating value RV – recommended value LV – limit value HLV – highest limit value The limit values according to the new Slovak Standard for drinking water quality (STN 75 7111, valid from July 1998) are presented in Italic.
|