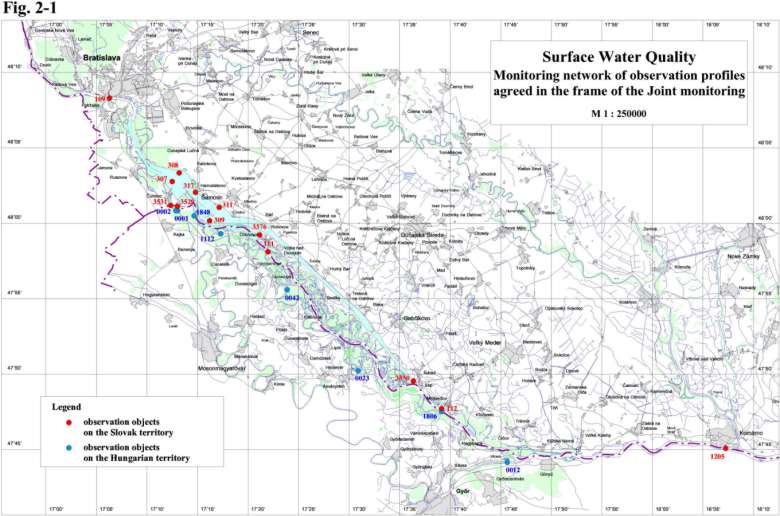
PART 2Surface Water QualityIn 1999, according to the Agreement, the surface water quality measurements were performed at 8 profiles on the Hungarian territory and at 13 profiles on the Slovak territory - Tab. 2-1, Fig. 2-1. At these profiles the influences of the measures described in the Agreement on the surface water quality were observed. The main factors which could influence the water quality are: the backwater effect upstream of the underwater weir, the increased discharges in the Danube downstream of the Čunovo weir and in the Mosoni branch of the Danube and the water supply to the right side river arm system. Sampling and analysing was mainly performed according to methods agreed by the Sub-commission for Water Quality Protection of the Slovak-Hungarian Trans-boundary Water Commission. The surface water quality data and the sediment quality data for agreed profiles are given in the Annexes to the Slovak and Hungarian National Reports on the Environment Monitoring in 1999. The evaluation was done for the hydrological year 1999 compared to the previous long-term surface water quality development. The time series diagrams for the respective parameters of the surface water quality are given in the Annexes to the National Reports. For the evaluation the agreed limit values for surface water quality, agreed on LV. session of the Slovak Hungarian Trans-boundary Water Commission, were used (Tab. 2-2). Table 2-1: List of monitored profiles
Table 2-2: Agreed limits for surface water quality classification
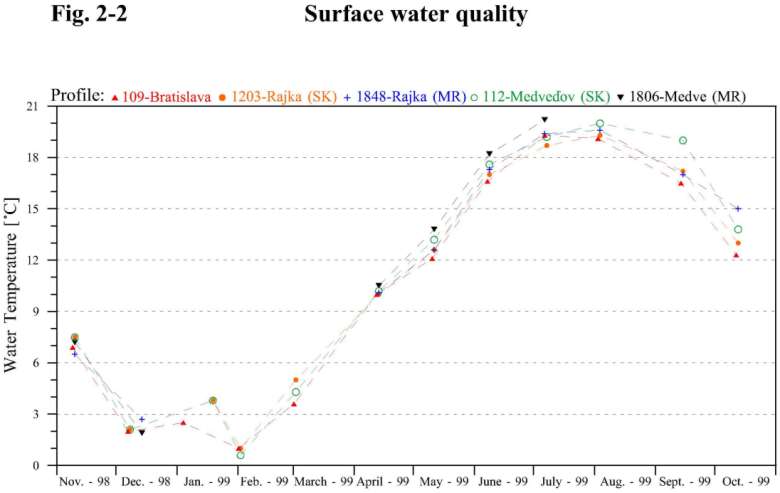
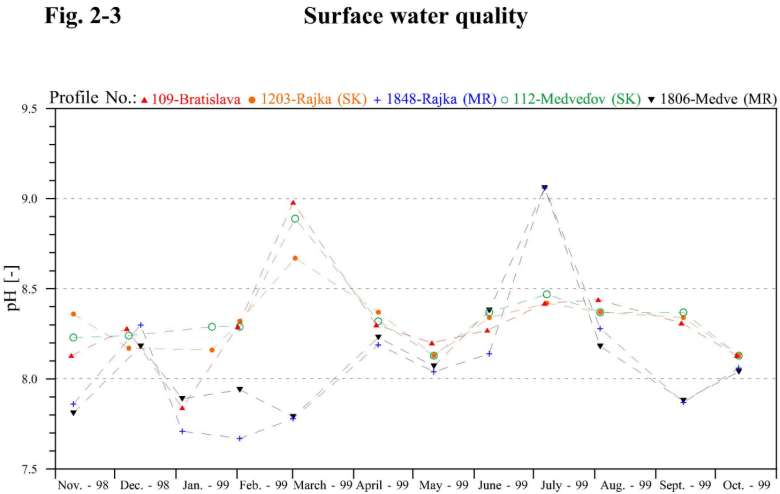
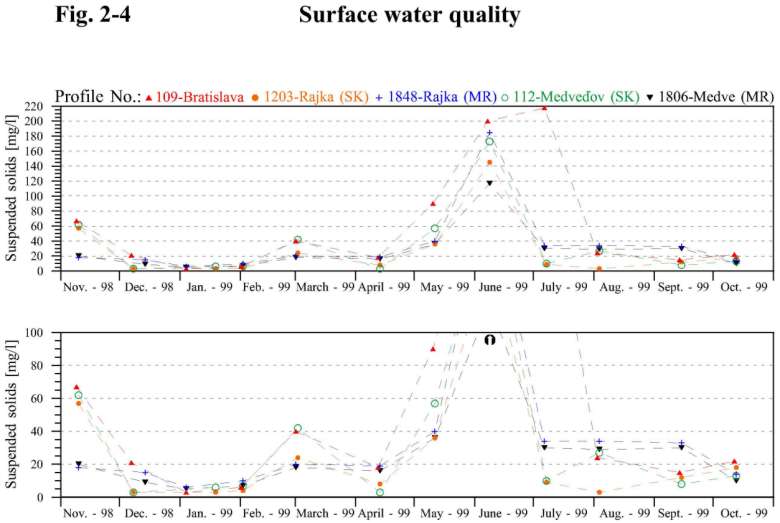
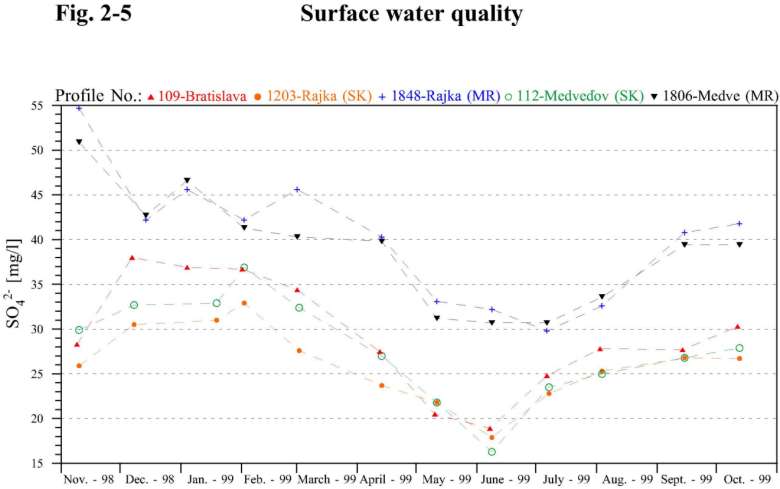
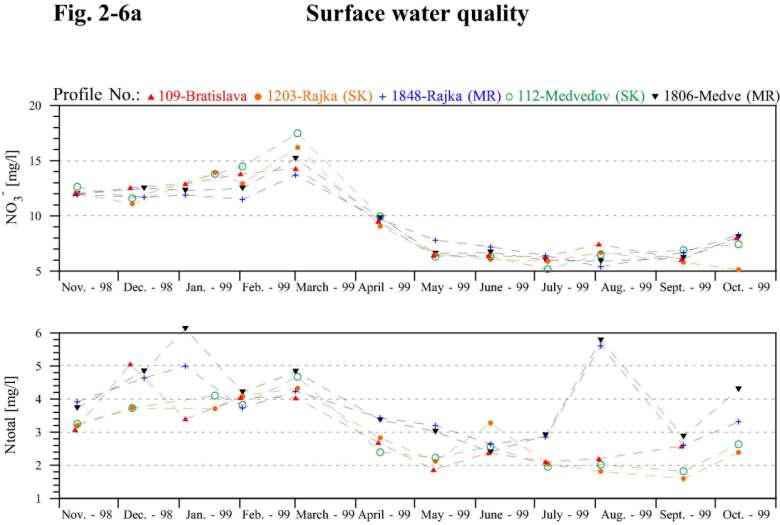
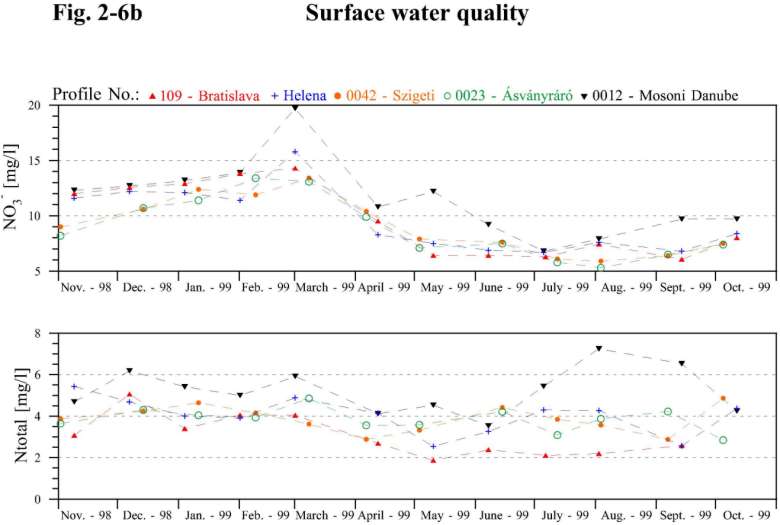
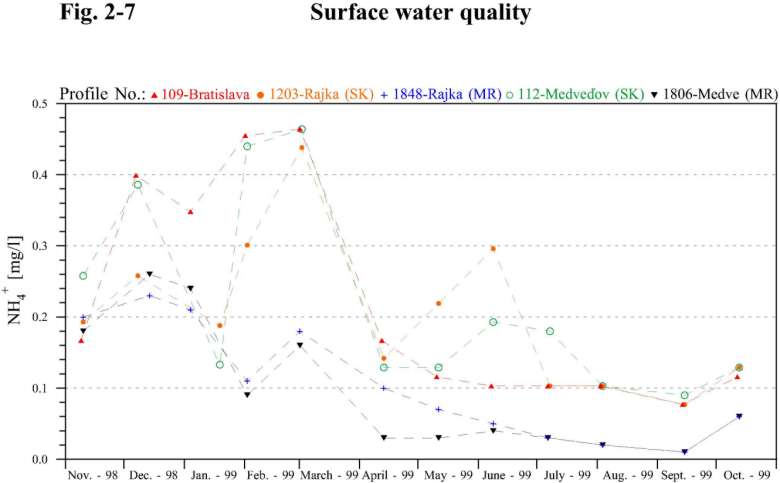
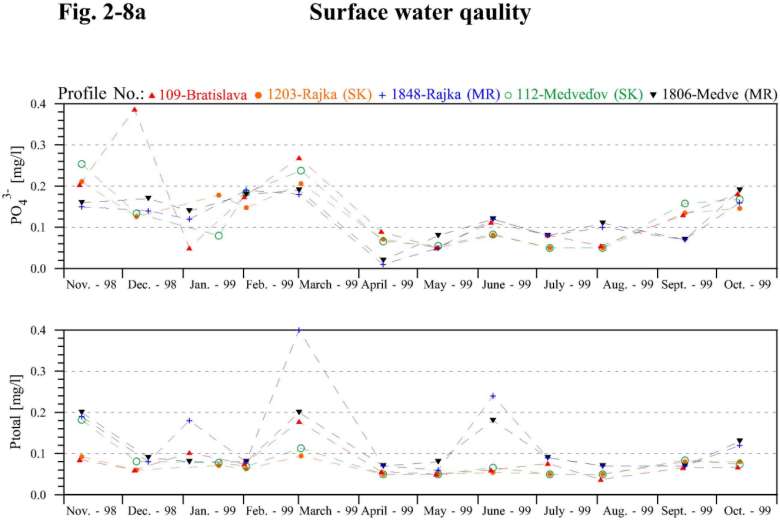
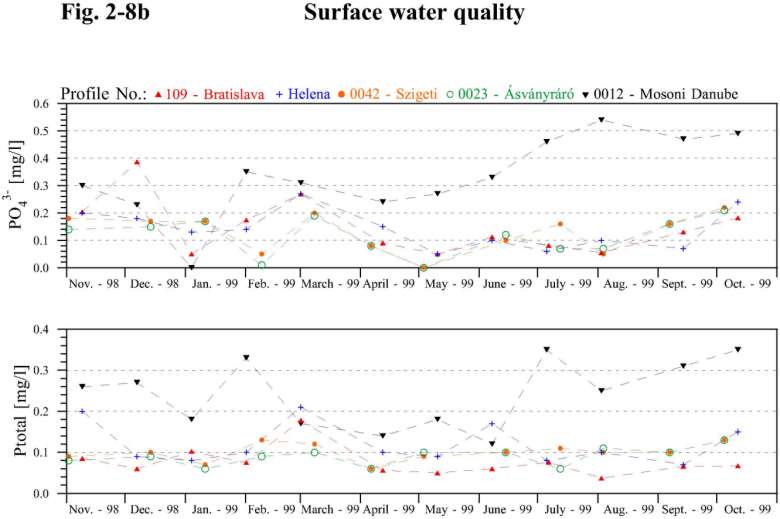
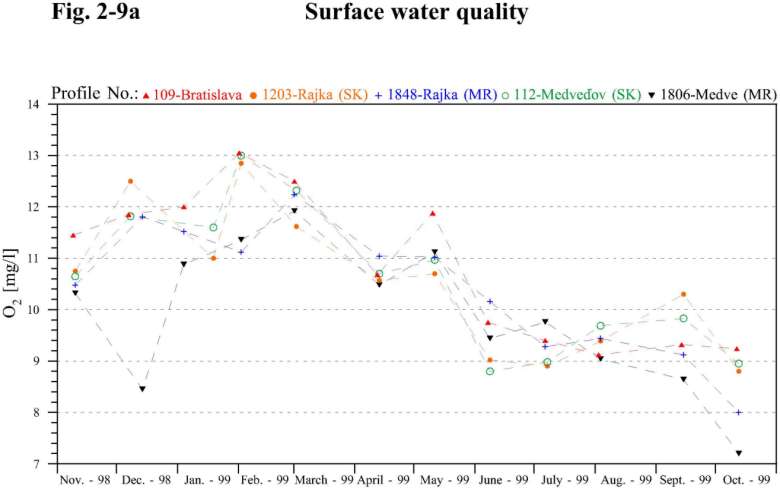
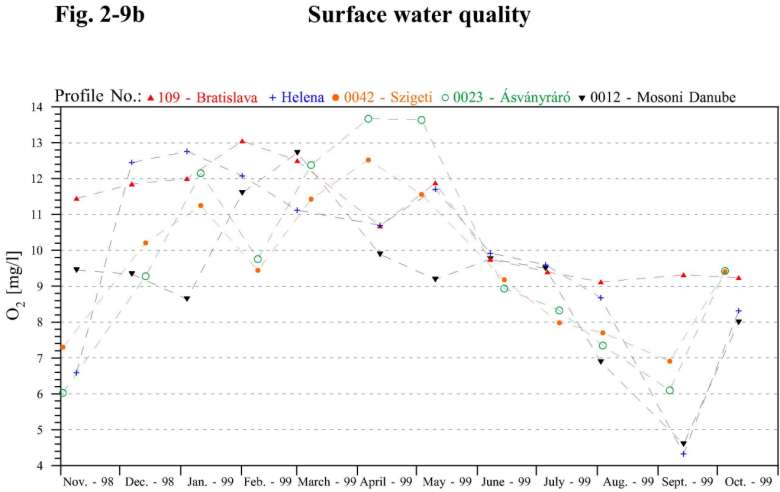
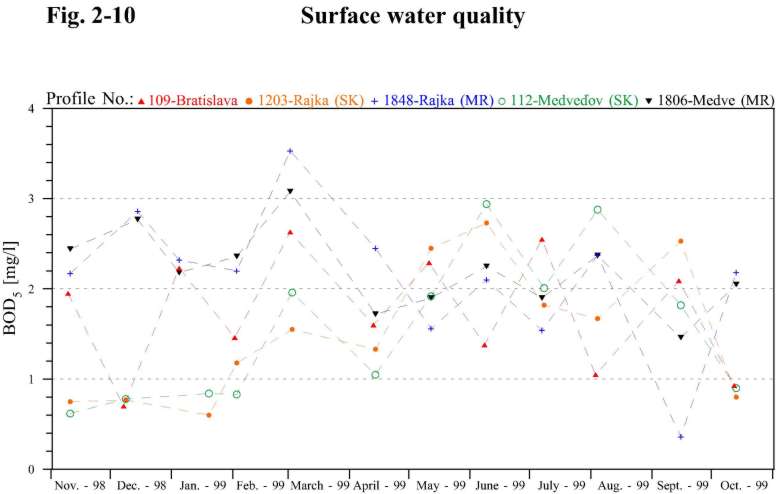
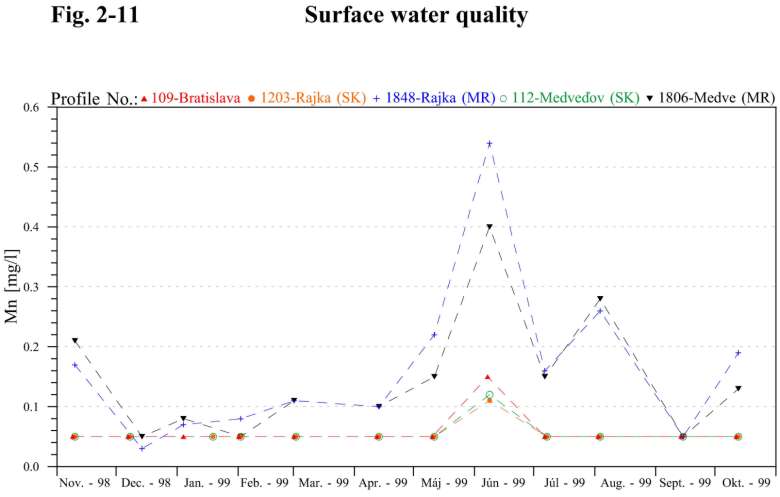
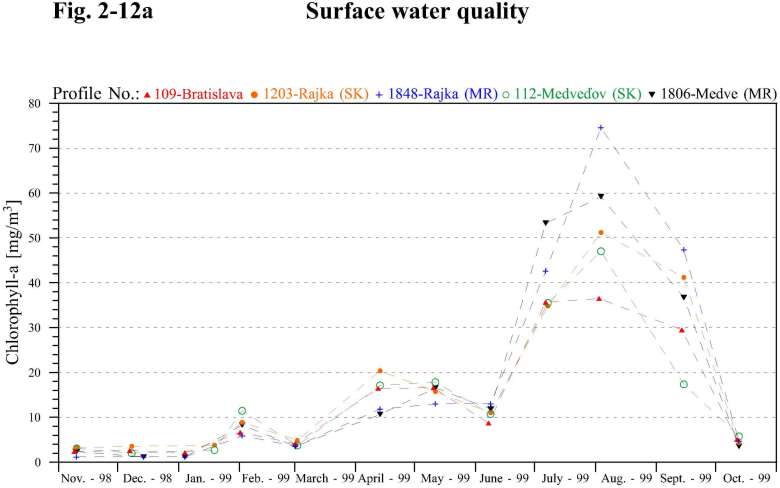
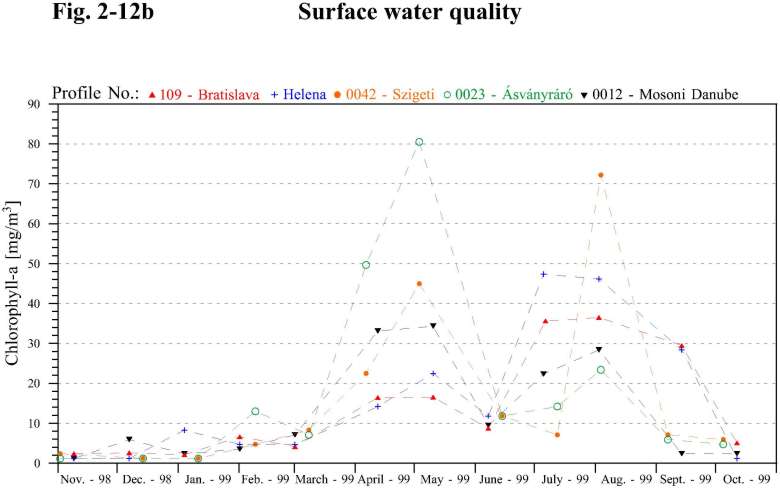
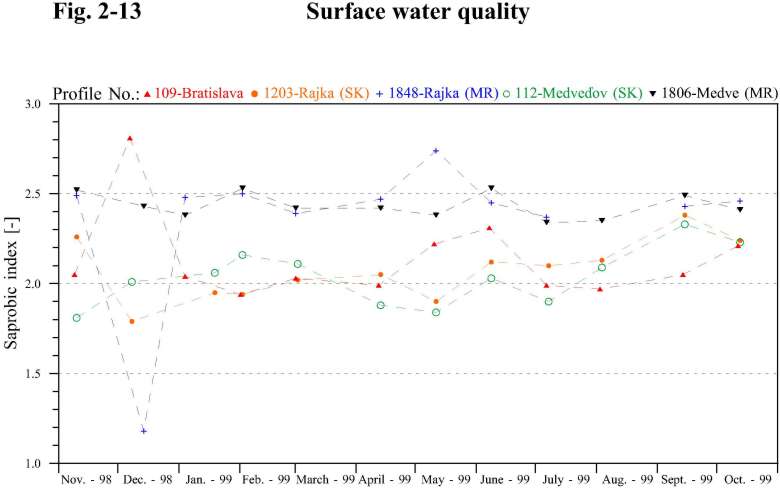
2.1. Basic physical and chemical parametersWater temperature The water temperature on all measured profiles in the Danube fluctuated in the range from 0 to 21 °C. The temperature reached the value of 10 °C only in April, and the maximum was measured during July 1999. The water temperature fluctuation over the whole Danube stretch downstream of Čunovo follows the water temperature course in the Danube at Bratislava (109). The water temperature in the seepage canal slightly differs, in the winter period is warmer (by 2-4 °C) and in the summer period cooler (by 1-2 °C), because the seepage canal is supplied by the ground water. The water temperature in the right side river branch system and in the Mosoni Danube was due to slower flow velocity warmer by 2-3 °C in the summer period. The water temperature in Danube for hydrological year 1999 is documented in Fig. 2-2. pH The pH value represents the alkalinity of water. Higher values occur in periods corresponding with periods of increased assimilation activity of phytoplankton. The pH values in winter period are lower than in summer period as a result of decreased assimilation activity. The pH values in the hydrological year 1999 fluctuated in the range from 7.5-9.15. Higher values were sometimes observed also in the river branch system. There were differences in the data measured by the Slovak and Hungarian Party again. The pH value during the hydrological year 1999 is documented in Fig. 2-3. Electric conductivity The electric conductivity of the surface water refers to the dissolved solids content. The conductivity values in the Danube and in the right-side river branch system in 1999 in principle follows the conductivity values at the Bratislava profile (109) and fluctuated in the range from 28 to 44 mS.m-1. The dissolved solids content at the Vének profile on the Mosoni Danube was in winter period almost twice comparing to the other profiles. This is connected to higher content of dissolved solids in the Mosoni Danube tributaries and also to the pollution by the city Győr. Similarly to the previous year the electric conductivity values in the seepage canal fluctuated in the range from 37 to 42.5 mS.m-1. Suspended solids Suspended solids content is closely related to the discharge. The suspended solids content fluctuations during the hydrological year 1999 over the whole Danube stretch downstream of Čunovo follows the suspended solids content in the Danube at Bratislava (109). The suspended solids values mainly fluctuated in the range from 3 to 60 mg.l-1. During the higher discharges period in May-July the suspended solids values fluctuated in the range of 60 to 220 mg.l-1. In the Vének profile on the Mosoni Danube at two occasions values over 100 mg.l-1 were measured. There were some differences in the data measured by the Slovak and Hungarian Party. The course and fluctuation of the suspended solids content is documented in the Fig. 2-4. Basic physical and chemical parameters - summary The basic physical and chemical parameters in the Danube and river branch system connected with the Danube have a seasonal character and basically depend on the discharges. In the hydrological year 1999 there were not recorded significant changes in the water quality in comparison to the previous year. 2.2. Cations and AnionsThe content of basic cations and anions in the hydrological year 1999 over the whole Danube stretch downstream of Čunovo and in the right side river branches has a fluctuating seasonal character related to the discharge in the Danube. Comparing to the long-term measurements the values of basic cations and anions have not changed significantly. The quantity ratio of ion components in the Danube water showed high stability, just like in previous years. Slight increase of sulphate and chlorine ion concentrations was recorded in 1996. Slightly higher sulphate concentrations have been observed in 1997-1998 in Bratislava again, when the maximum reached 46.4 mg.l-1. In 1999 the sulphate concentration slightly decreased (Fig. 2-5). These changes in cation and anion concentrations are not significant in relation to the Danube water quality. The most stabile ionic content was found in the seepage canal, which is characteristic for the seepage water. In the Mosoni Danube in connection with the higher content of dissolved solids the concentration of sodium, calcium, magnesium and sulphate ions comparing to the other profile increased. 2.3. NutrientsNitrates Nitrates concentrations in 1999 at all measured profiles in the Danube as well as in the right-side river arm system show seasonal fluctuation. Values mainly fluctuated in the range from 5 to 20 mg.l-1, Fig. 2-6a,Fig. 2-6b. The values in the seepage canal in 1999 mostly equally fluctuated in the range from 2.5 to 8.6 mg.l-1. Ammonium ion In hydrological year 1999 the ammonium concentration at all measured profiles in the Danube and in the right-side river branch system, except the profile Vének situated on the Mosoni Danube, are similar, and vary mainly from 0.01 to 0.46 mg.l-1 (Fig. 2-7). Higher concentrations occur during the periods with lower water temperature due to the slower nitrification processes. There are some differences in the data measured by the Slovak and Hungarian Party. The ammonium concentration of the Mosoni Danube in the Vének profile was in several occasion double comparing to the other profiles (maximum value 0.59 mg.l-1 was measured in February). Nitrites The concentration of nitrites, a temporary product of nitrification and denitrification processes, fluctuated in the range from 0.02 to 0.15 mg.l-1. The only exceptions are values app. 0.18 mg.l-1 measured at the Vének profile in January and May 1999. Total nitrogen Changes in the total nitrogen content are predominantly affected by the fluctuation of the nitrate-nitrogen and organic nitrogen concentrations. The total nitrogen concentration in the Danube and right side river arm systems fluctuated from 1.5 to 6 mg.l-1. The total nitrogen values were highly similar to each other in the Danube water, Mosoni Danube and at Helena side arm. Higher concentrations were measured in the Vének profile during the summer period. There were some differences in the data measured by the Slovak and Hungarian Party, Fig. 2-6a, Fig. 2-6b. Phosphates In hydrological year 1999 the phosphate concentrations fluctuated from 0.01 to 0.4 mg.l-1 on all profiles (Fig. 2-8a, Fig. 2-8b), except the Vének profile on Mosoni Danube. Phosphate concentrations on profile Vének fluctuated in the range from 0.23 to 0.54 mg.l-1. Higher values usually occur during floods and in the winter period. Total phosphorus Concentration changes of the total phosphorus follow the pattern of the phosphates. The total phosphorus concentration on all profiles, except profile Vének, situated on Mosoni Danube, fluctuated in the range from 0.02 to 0.2 mg.l-1 (Fig. 2-8a, Fig. 2-8b). Total phosphorus concentrations on profile Vének fluctuated in the range 0.12-0.35 mg.l-1. There are slight differences in the data measured by the Slovak and Hungarian Party. Nutrients - summary The content of nutrients in the period of 1995-1996 had over the whole Danube stretch downstream of Čunovo increasing character. During 1997-1998 the content of nutrients slightly decreased on all profiles situated on the Danube. In the hydrological year 1999 the slightly decreasing tendency remained unchanged. Slight decrease of nutrients content in the Danube is probably connected with wastewater treatment in upstream countries. Since introducing the water supply the contents of nutrients in the right side river branch system follows the fluctuation in the Danube. From the point of view of nutrient content, the Danube water enables creation of eutrophication processes under suitable other conditions. For the comparison, the nutrient content in the Danube is lower than in some other large European rivers. The content of nutrients in the Danube is not a limiting factor of eutrophication. 2.4. Oxygen and organic carbon regime parametersDissolved oxygen In the hydrological year 1999 the dissolved oxygen concentration in all profiles on the Danube fluctuated from 7.2 to 13 mg.l-1. Generally, higher values occur in winter period, while the lowest values occur in the summer. The dissolved oxygen content proportionally decreased besides with increasing water temperature in the Danube. Besides this the dissolved oxygen content depends on the assimilation activity of phytoplankton. There were some differences in the oxygen concentrations measured by the Slovak and Hungarian Party, Fig. 2-9a. In the right-side river branch system due to the continuous water supply the dissolved oxygen content follow the course of dissolved oxygen values in the Danube river (Fig. 2-9b.). Along the flow path the dissolved oxygen concentration in the river branch system slightly increase. The concentrations in the river branch system and the Mosoni branch of the Danube fluctuated in the range 6-14 mg.l-1, except one occasion at the Helena profile and one occasion at Vének profile when concentration under 5 mg.l-1 was measured. CODMn and BOD5 COD and BOD parameters represent the chemically and biologically degradable organic matter content. In the hydrological year 1999 the COD values at all measured profiles fluctuated from 2 to 7 mg.l-1. The BOD values fluctuated in the range from 0.2 to 4.6 mg.l-1 . There are some differences in the BOD values measured by the Slovak and Hungarian Party, Fig. 2-10. In the Mosoni Danube at Vének are the COD and BOD values higher because of the partially treated wastewater from the Győr. Oxygen and organic carbon regime parameters - summary The oxygen and organic carbon related parameters in the Danube reflect the seasonal assimilation activity of the phytoplankton and organic carbon oxidation processes. The measured data (1992-1999) indicate the decreasing trend of organic loads. This phenomenon is the consequence of substantial wastewater treatment improvement in the upstream danubian countries. Higher oxygen regime parameters (CODMn, BOD5) occurred in period of higher discharges in the Danube. The oxygen regime parameters at Vének are influenced by local pollution (pollution originating from city Győr) together with hydrological conditions at confluence with the Danube. 2.5. MetalsIron The amount of suspended solids influences the iron content in the surface water. The mutual coherence of iron concentrations and suspended solids content in surface water is documented by the highest concentrations of iron measured at the time of highest suspended solids content. In 1999 the iron concentrations on all measured profiles fluctuated up to 1.8 mg.l-1, except the Vének profile on Mosoni Danube (0.07-3.5 mg.l-1). The iron concentration in the Mosoni Danube is higher due to the character of catchment area (first of all because high iron content in the Rába river). Manganese Manganese, similarly to iron occurs in surface water mainly in solid phase. The manganese concentration fluctuated in the range up to 0.54 mg.l-1. The highest concentrations of manganese were measured at the time of highest suspended solids content. There were some differences in the manganese concentrations measured by the Slovak and Hungarian Party, Fig. 2-11. Higher manganese content was measured in the seepage canal at Lock No. 1 (0.56 mg.l-1 in May and 0.62 mg.l-1 in June) and Lock No. 2 (0.76 mg.l-1 in August). Heavy metals In the hydrological year 1999 the concentrations of heavy metals, except the copper in the Rajka profile, fluctuated in the range of limits corresponding to the I. class of surface water quality. The copper concentration in the Rajka profile only in one occasion exceeded the agreed limit value 20 mg.l-1. There were differences in the heavy metal concentrations measured by the Slovak and Hungarian Party. 2.6. Biological and microbiological parametersColiform bacteria The surface water bacteriological pollution can be well determined by the number of Coliform bacteria. In 1999 the number of Coliform bacteria at Bratislava profile (109) fluctuated in the range from 15 to 300 NrC.ml-1, which corresponds to long term measurements at this profile. The Coliform bacteria values at Rajka profile follow the fluctuation of values at Bratislava profile. The number of Coliform bacteria at Medveďov profile is in long run lower. The bacteriological pollution in 1999 downstream the Danube, and along the river arm system, downstream from the water supply inflow at Helena profile, also decreasing. The bacteriological pollution at the Vének profile situated on the Mosoni Danube fluctuated in the range from 28 to 3500 NrC.ml-1 due to the pollution from the city Győr. Chlorophyll-a The chlorophyll-a concentrations refer to the quantity of phytoplankton and provide information about the eutrophic state of water. The growth of algae on the respective section of the river is represented by the relative increase of chlorophyll-a concentration between two compared profiles. Chlorophyll-a concentrations along the Danube flow-path continuously increase from Bratislava to Medveďov. The chlorophyll-a concentrations in the Danube in 1999 did not show the early spring maximum, probably due to the higher discharges in the Danube. In the culmination period the measured concentration on all profiles fluctuated in the range from 30 to 75 mg.m-3 (Fig. 2-12a). There were two culminations in the right side river arm system during the hydrological year 1999 – in the spring (April-May) and in the summer (July-August). The highest values during the spring culmination were measured in the Ásványi river branch, during the summer culmination in the Szigeti branch and at Helena profile. The values during the culmination fluctuated in the range from 40 to 80 mg.m-3. Comparing to the previous year the maximum values of chlorophyll-a concentration at the Vének profile on Mosoni Danube, during the spring and summer period, were significantly lower. The chlorophyll-a concentration in the seepage canal remained low and fluctuated up to 20 mg.m-3, except the Lock No. 1 where the values during the summer culmination fluctuated in the range from 30 to 73 mg.m-3. Low concentrations between the culmination waves occurred in the period of high discharges and in the period of snow melting in Alps. Saprobic index The saprobic index represents the self-purification ability of the water, the ability of degradation of organic pollution. The saprobic index in relation to the respective stretch of the river represents also the water quality in the river. Based on the Slovak data most of the saprobic index values in the influenced area are fluctuating in the range from 1.8 to 2.3 which correspond to beta-mezosaprobic state. Based on the Hungarian data the saprobic index fluctuates between 2.3 and 2.7 that correspond to alpha-beta-mezosaprobic state (Fig. 2-13). These values are characteristic for this stretch of the river. The self-purification processes, at this level of the saprobic index, run mainly as oxidising processes. Time series data of saprobic index indicate the slightly decreasing tendency during the last ten years. The saprobic index in the Mosoni Danube at Vének profile due to the pollution by sewerage water fluctuates from in the range from 2.4 to 2.9, which correspond beta to alpha-mezosaprobity. Other biological parameters The observations of the number of algae, the number of zooplankton and the macrozoobenthos are according to the Agreement performed four times in the year. Phytoplankton Comparing to the previous year the density of algae, observed on all measured profiles on the Danube and in the right side branches, was lower in the hydrological year 1999. Corresponding to the meteorological conditions the algae growth culminated in the summer period. Dominant algae species were the Chromophyta (Bacillariophycae, Chrysophycae). During the summer period high number of species and individuals of Chlorophyta were present. The content of algae in the water of the seepage canal at Lock No. II. was low during the whole year, corresponding to the chlorophyll-a concentrations. Zooplankton The determined species of zooplankton in the Danube were similar to species identified in previous years. In the species composition of zooplankton population in all water bodies, except Vének sampling point on the Mosoni Danube, the dominance of thermophylic Rotatoria were characteristic (Brachionus, Keratella, Polyarthra species). In the water discharged to the Mosoni Danube and to the right side river branch system the zooplankton population was not so rich, but along the flow path slightly increased. The highest individual abundance values of different species were observed at Vének sampling profile on the Mosoni Danube during the summer period, the Copepoda nauplius larvae dominate. The most rich zooplankton population occurred in the right side seepage canal during June 1999, with the domination of Rotatoria (Keratella cochlearis cochlearis, Keratella cochlearis tecta, and Polyartha vulgaris, Bdelloidea sp. and Copepoda nauplius larva in August). Macrozoobenthos Faunistic composition of the aquatic macroscopic invertebrate communities in the Danube was very similar to the previous year. According to the cumulative presence data 20-22 taxons were present in the Danube. The most diverse community was observed during the sampling in September and October. Based on the monitoring in the river branch system it can be said that results obtained along the longitudinal axis of the water supply system were similar. Rheophile invertebrate taxons spread from the downstream direction (Helena branch - 30 species, Szigeti river arm - 17 and Ásványi river branch - 27 species). Along the Mosoni-Danube the aquatic communities are similarly to the previous observations characterised by the dominance of Molluscs communities (Anodonta anatina, Unio tumidus). Periphyton Sampling in the hydrological year 1999 was performed three times at selected profiles. The saprobic index of periphyton ranged from 1.63 to 1.94. Comparing to the previous year the values were lower. In hydrological year 1999 increase of organic pollution along the Danube from Bratislava to Komárno was observed. According to the species diversity of the periphyton the families of the Fragilariaceae group (Diatoma, Fragilaria) and Achnanthaceae group (Achanathes, Cocconeis) were frequent, but the most frequent were the families from the Naviculaceae group (Cymbella, Gomphonema, Naviculla, Rhoicosphaenia) and Bacillariaceae group (Nitzschia) and the Surirella family. The most rich in species were the families Naviculla and Nitzschia. 2.7. Quality of sedimentsThe sampling of riverbed sediments in area monitored in the frame of joint Slovak-Hungarian monitoring had been performed in the Helena arm, Szigeti arm and Ásványi arm in August 9, 1999 and on the other six sampling points during 6-14 July, 1999. Sediment samples were analysed for organic and inorganic pollutants and the content of total phosphorus and nitrogen. For evaluation the so-called “Canadian list” was used. This standard distinguishes three levels of pollution: level without pollution, the lowest pollution level and the serious pollution level. From among the inorganic micropollutants seven heavy metal components (Cu, Cr, Zn, Ni, Cd, Pb, and Hg) were analysed. According to the results it can be concluded that in 1999, similarly to the previous year, the pollution by heavy metals did not reach the “serious pollution level” at any of the sampling sites. There were places where the concentrations of heavy metals except chromium, copper and lead were higher than the respective limit values for the “lowest pollution level”. The cadmium concentration was several times higher than the respective value of “lowest pollution level” (0.6 mg.kg-1) at all of the sampling points. Concentration of zinc in the sediments was lower than the limit value (120 mg.kg-1) only in the Medveďov profile. The limit value of the “lowest pollution level” for nickel was over gone in the profiles of Ásványi river branch and at the Vének profile on the Mosoni Danube. At the Vének profile also the concentration of mercury was higher than the limit value for the “lowest pollution level”. From the organic micro pollutants the polychlorinated biphenyls (PCB) and polynuclear aromatic hydrocarbons (PAH) were analysed. The sum of PCB’s was determined by analyses of 6 isomeric compounds. The sum of PAH’s was determined by 12 polyaromatic hydrocarbon components. Based on the measured concentrations of PCB and PAH it can be stated that the analysed concentration values did not reach the “lowest pollution level”, in case of PCB 70 mg.kg-1, in case of PAH 2000 mg.kg-1. The PCB concentration at all of the sampling points was lower than the detection limit (0.5 mg.kg-1). The total phosphorus content in sediments was higher than the limit value of “lowest pollution level” (600 mg.kg-1) at all sampling profiles, except the profile in the seepage canal and in the Szigeti arm. The total nitrogen content in sediments was higher than the limit value of “lowest pollution level” (600 mg.kg-1) at all sampling profiles, except the profile at Medveďov and in the Szigeti arm. The “serious pollution level” was not reached at any of the profiles (2000 mg.kg-1 for the total phosphorus and 4800 mg.kg-1 for the total nitrogen). 2.8. ConclusionsIncreased values of some parameters like nitrogen and phosphorus anions, some of cations (sodium, potassium and magnesium) and metals (copper and mercury) were observed already in the Danube at Bratislava profile (109) which is situated upstream of Gabčíkovo-Čunovo structures and effect the surface water quality inflowing to the territory influenced by temporary measures according to the Agreement. The hydrological year 1999 was similar to the previous hydrological year. There were not observed extreme values of any parameters and the maximal values were lower comparing to the year 1996. Fluctuation of individual parameters characterising the surface water quality in the right-side river branch system, due to the continuous water supply since 1995, was in most cases modified, and follows the fluctuation in the Danube water. Its tributaries and local pollution of settlements besides the water supply influence the water quality in the Mosoni Danube. Before the confluence with the Danube the water quality state is labile (variable in time), which is proved by unfavourable oxygen regime parameters, high contents of dissolved solids, iron and high values of COD, Coliform bacteria and saprobity index, but this is not connected to the water supply nor to the waterworks on the Danube. Table 2-3: Classification of parameters or group of parameters according to the agreed limits for surface water quality classification
|