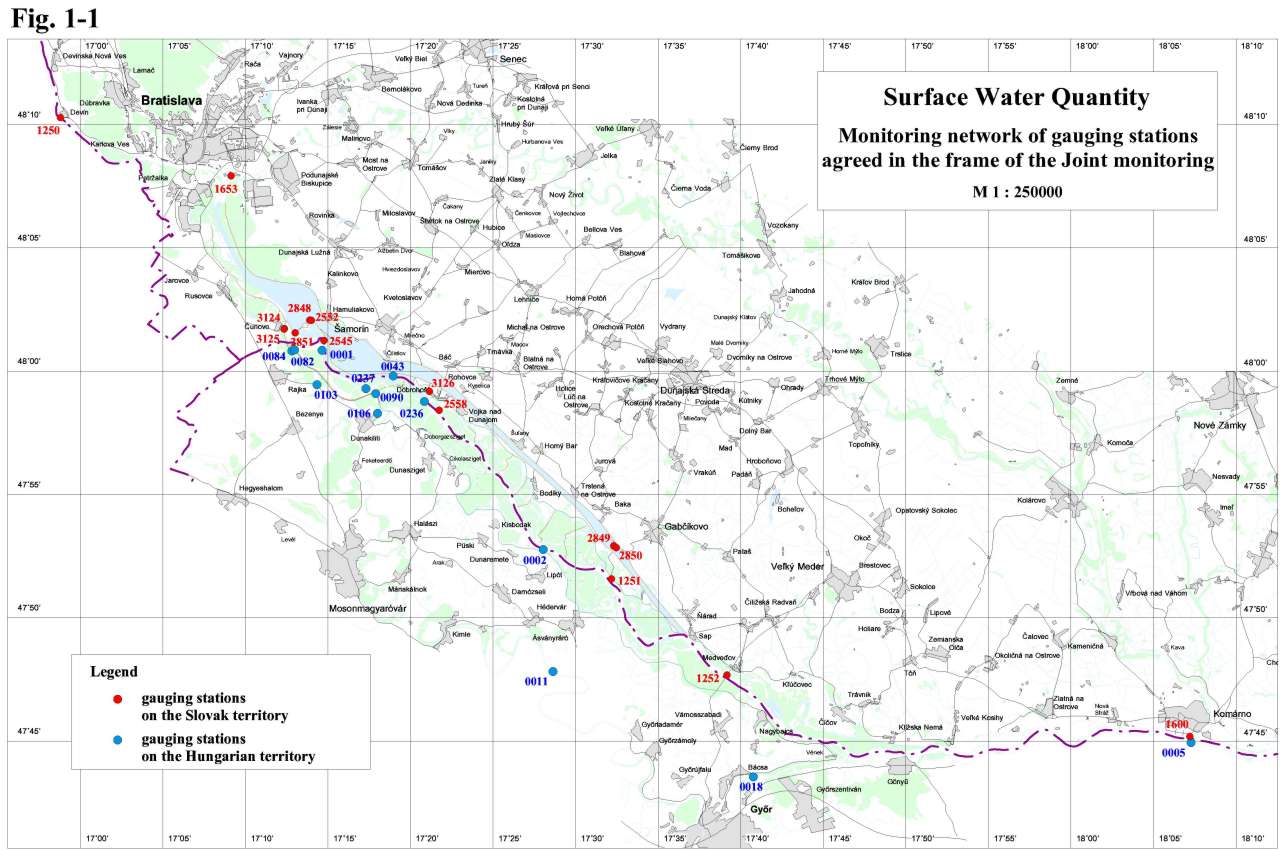
PART 1Surface Water QuantityThe monitoring of surface water discharges and levels was similarly to previous years performed on 15 gauging stations on the Slovak side and 13 gauging stations on the Hungarian side (Tab. 1-1). The location of the stations is shown on Fig. 1-1. The Parties in the intergovernmental Agreement have undertaken to mutually exchange the data of agreed gauging stations in order to prepare the joint evaluation. Joint measurements had also been performed in order to help the evaluation of discharges flowing into the Danube downstream of the Čunovo weir and into the Mosoni branch of the Danube. Based on these measurements jointly agreed time series data were accepted. These data creates the basis for evaluation of the measures realised according to the Articles 1-3 of the Agreement. Table 1-1: List of gauging stations
In the intergovernmental Agreement, signed on April 19, 1995 the Parties agreed on the temporary water management regime. It was agreed that in case of average annual discharge 2025 m3.s-1 at Bratislava the annual average of 400 m3.s-1 is to be discharged to the Danube downstream of Čunovo. The daily amount of water discharged to the Danube riverbed depends on the discharge reaching the Bratislava-Devín profile, taking into consideration the rules of operation described in the Annex 2 of the Agreement. The discharge in the vegetation period, depending on hydrological conditions, should fluctuate between from 400 to 600 m3.s-1, in the non-vegetation period the discharge should not be less than 250 m3.s-1. In case of floods the amount of water above 600 m3.s-1 discharged through the inundation weir is not taken into consideration when the annual average is calculated. There was agreed an additional 43 m3.s-1 of water discharged to the Mosoni branch of the Danube through the intake structure at Čunovo and the right side seepage canal. On the basis of average annual discharges for different years at station No. 1250 it can be stated that the average annual discharge in hydrological year 1999 was much more higher than the average considered in the Agreement (Tab. 1-2) and the highest since signing the Agreement. Table 1-2: Average annual discharges
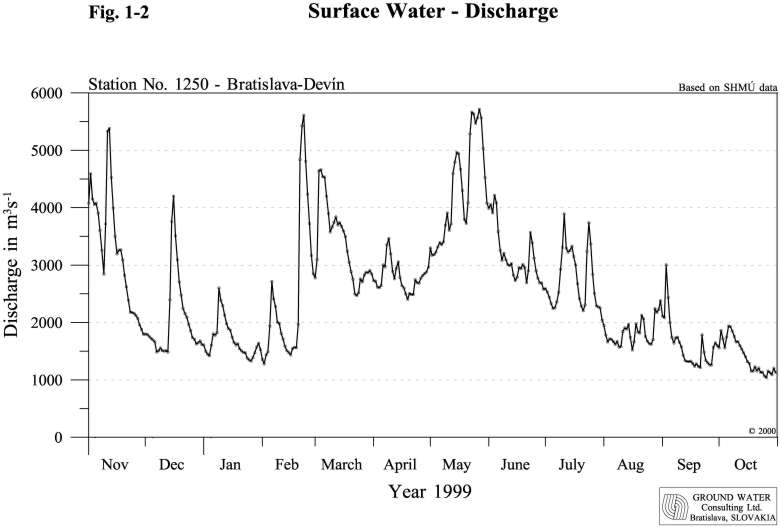
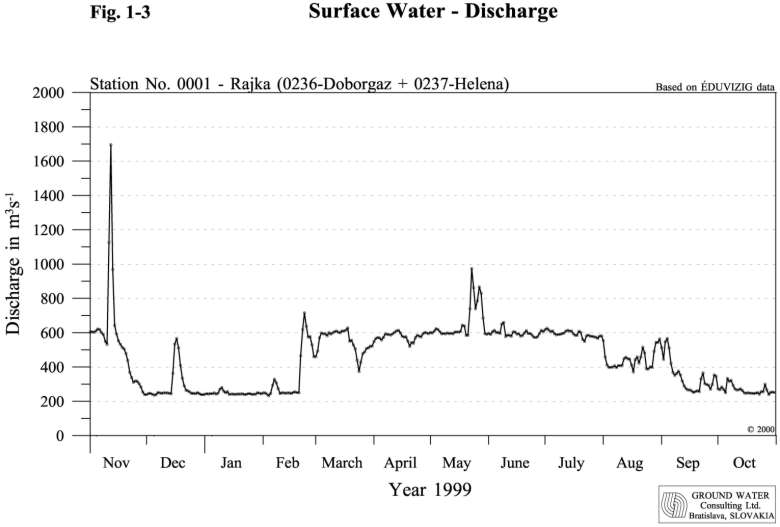
In hydrological year 1999 the minimal average daily discharges occurred in the period from September 1999 to October 1999. Low discharges occurred also at the end of January and beginning of February 1999. The lowest average daily discharge occurred at October 26, 1999 when reached the value 1040 m3.s-1. The maximal average daily discharges occurred during high discharge periods in November 1998 (5385 m3.s-1), at the end of February 1999 (5613 m3.s-1) and in during May 1999 (5715 m3.s-1). The yearly maximum discharge occurred in May 27, 1999 when reached the value 5788 m3.s-1. Based on these values it can be stated that the high or low discharges does not reached extraordinary values. In spite of this, the average yearly discharge in 1999 was the highest one in the last ten years. The course of discharges during the hydrological year can be characterised as follows (Fig. 1-2): there were two peaks during the November 1998, the second with maximum discharge of 5700 m3.s-1, then the discharges quickly decreased to the 1795 m3.s-1 at the end of November 1999. Decreasing tendency of winter discharges were several times broken by sudden increase of discharge caused by great amount of precipitation in the catchment area - in the middle of December 1998 the discharges reached 4466 m3.s-1, in the first decades of January and February the discharges raised up to 2800 m3.s-1. In the third decade of February 1999 a flood wave occurred with maximum discharge of 5775 m3.s-1, followed with another one at the beginning of March, which reached 4860 m3.s-1. The decreasing discharges in the second half of March and during April 1999 fluctuated around 2700-2800 m3 .s-1. At the end of April the discharges began to rise and in the first half of May 1999 reached 5018 m3.s-1 and at beginning of the second decade culminated at 5788 m3.s-1, which was the yearly maximum. After the culmination in May the slowly decreasing discharges in June and July 1999 several times rose up, up to 4000 m3.s-1. The discharges during the August 1999 fluctuated around 1800 m3.s-1. At the end of month the discharges slightly increased and culminated at the beginning of September 1999 at 3325 m3.s-1. After the decrease of discharges in the middle of September down to 1200 m3.s-1, the discharges at the end of September reached 2008 m3.s-1. After this small culmination the discharges decreased and at the end of October 1999 reached the yearly minimum 1040 m3.s-1. 1.1. Discharge into the Danube downstream of ČunovoThe determination of the average daily amount of water discharged to the Danube downstream of Čunovo was based on average daily discharges measured at stations Doborgaz and Helena (Fig. 1-3). The monthly characteristics of the discharges into the Danube in the hydrological year 1999 were as follows: Year 1998 1999
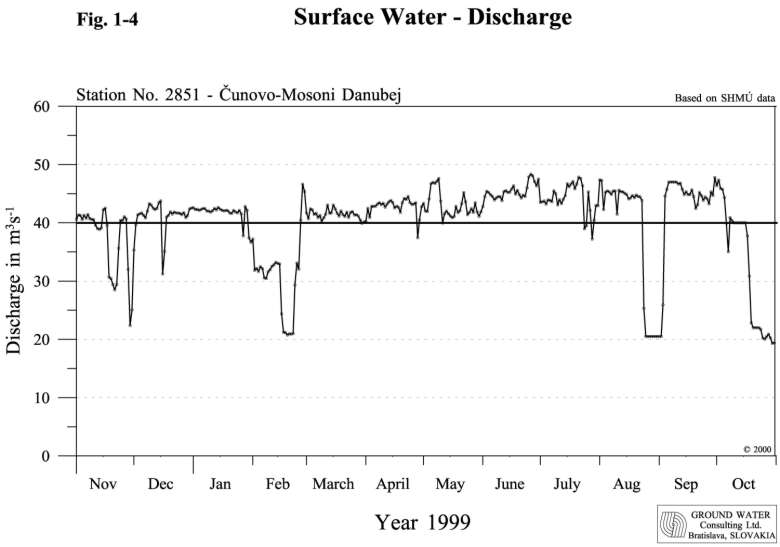
The average annual discharge flowing to the Danube downstream of Čunovo was 456.07 m3.s-1 in hydrological year 1999. If we do not take into account discharges over 600 m3.s-1 during higher discharges in 1999* the annual average was 443.64 m3.s-1. This means that in the year 1999 Slovakia fulfilled the average annual discharge jointly agreed in the Agreement, even some more water was discharged to the Danube. The difference comes from the difference between the discharge daily adjusted according to the tabulated discharge and the formula used for calculation of the average annual discharge in Annex No. 2 of the Agreement. In the non-vegetation period in several occasions the minimum discharges differed from the agreed values. On the other side in the vegetation period the maximal values were sometimes higher. 1.2. Discharge into the Mosoni Branch of the DanubeThe discharge into the Mosoni branch of the Danube according to the Agreement should be 43 m3.s-1, which is composed by the discharge released to the Mosoni branch of the Danube through the intake structure at Čunovo and the discharge through the seepage canal. The common profiles for discharge measurements on the Mosoni branch of the Danube are situated on the Slovak territory at 0.160 rkm and upstream of lock No. I on the Hungarian territory. The average daily discharges were agreed according to the joint discharge measurements performed at both profiles. In the evaluation the data measured just downstream of the intake structure were considered (Fig. 1-4). The monthly characteristics of the discharges in the Mosoni Danube in the hydrological year 1999 were as follows: Year 1998 1999
The discharges in the right side seepage canal were measured at two profiles. The first is at Čunovo on the Slovak territory; the second is placed at lock No. II on the Hungarian territory. In the evaluation the data observed at lock No. II on the seepage canal on Hungarian territory were considered. The monthly characteristics of the discharges recorded at lock No. II were as follows: Year 1998 1999
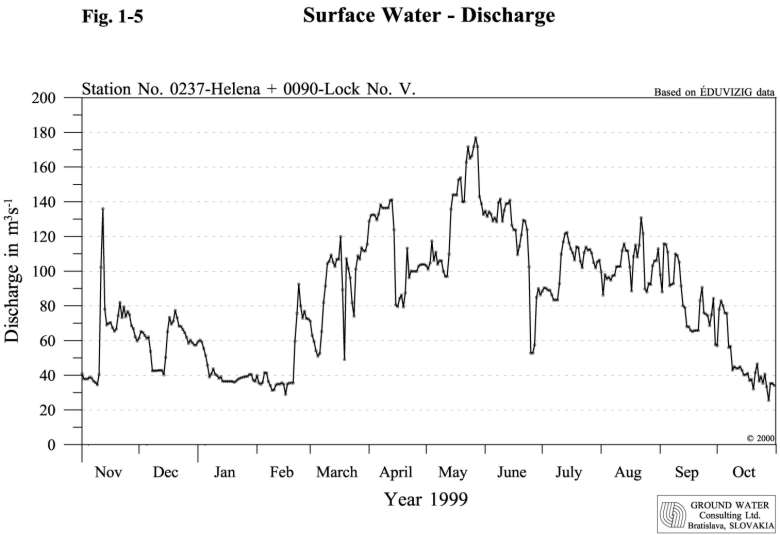
The total average annual discharge discharged into the Mosoni branch of the Danube was 41.98 m3.s-1. Taking into consideration the accuracy of the discharge measurements it can be stated that the agreed average annual discharge was fulfilled. 1.3. Water distribution on the Hungarian territoryThe goal of the water distribution on the Hungarian side is to provide continuous water supply into the main and side river arms in the inundation area, into the river branches on the flood-protected area and into the Mosoni Danube. 1.3.1. Water supply into the inundation areaThe inundation area on the Hungarian side can be supplied by water from two sources: a.) From the Danube, through two openings in the riverbank, by manipulating the increased water level by the submerged weir and the Dunakiliti dam. The total inflowing discharge is measured at Helena profile. b.) The second source is from the seepage canal through the lock No. V. Joint discharge measurements by both Parties were performed at the Helena profile too. The measurements were jointly evaluated and based on joint evaluation the common time series of average daily discharges were prepared. The monthly discharge characteristics at Helena profile in hydrological year 1999 were as follows: Year 1998 1999
The monthly discharge characteristics at the lock No. V: Year 1998 1999
The monthly discharge characteristics of the total amount of water discharged into the inundation area in hydrological year 1999 (Fig. 1-5): Year 1998 1999
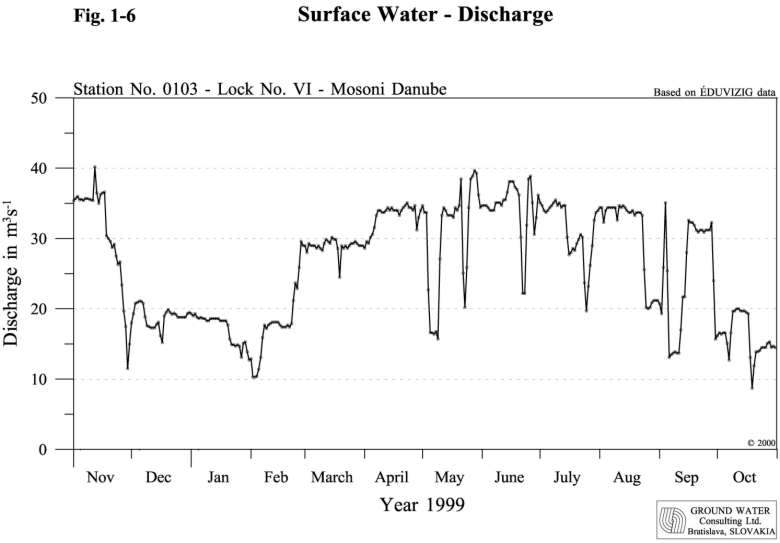
1.3.2. Water supply into the Mosoni DanubeThe water supply into the Mosoni Danube is provided from the seepage canal through the lock No. VI (Fig. 1-6). The discharge is measured at the profile downstream of the lock. The monthly characteristics of the discharges through the lock No. VI in hydrological year 1999 were as follows: Year 1998 1999
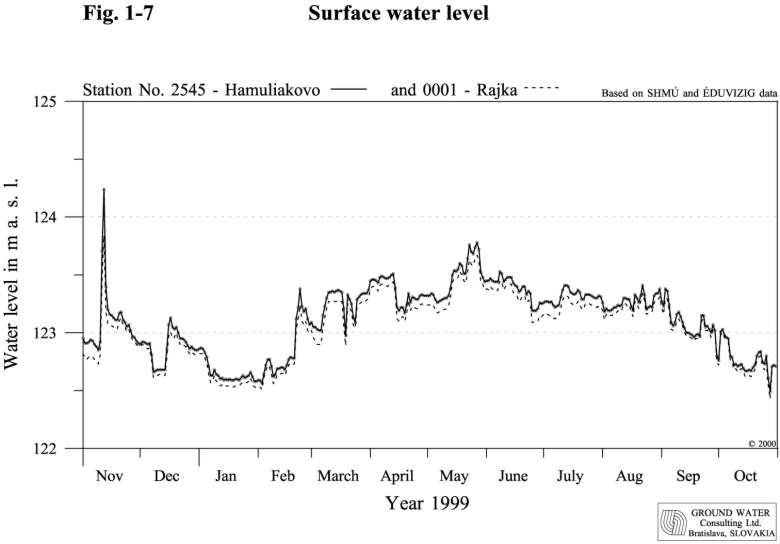
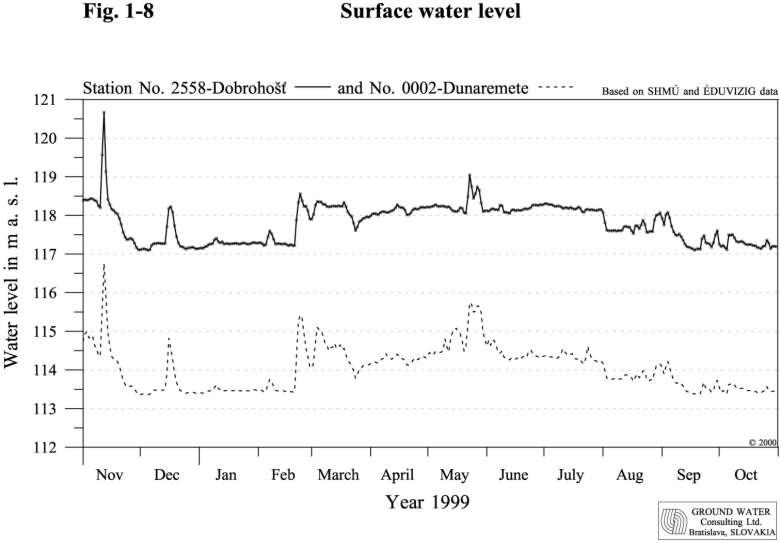
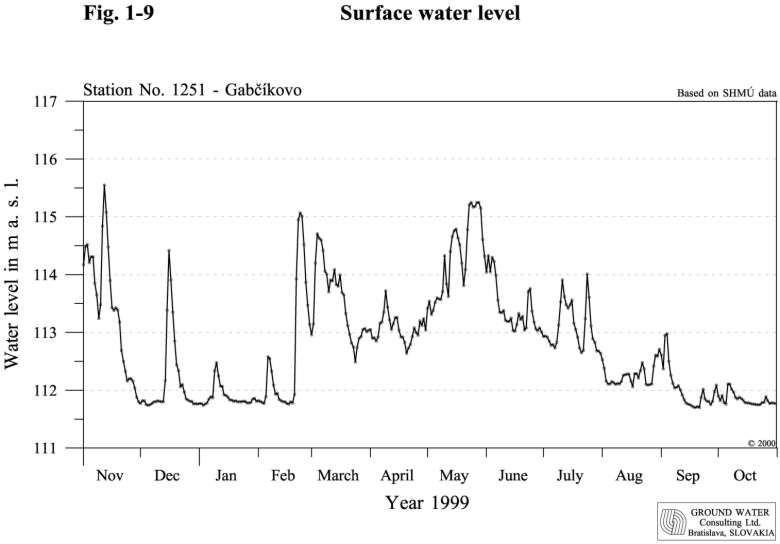
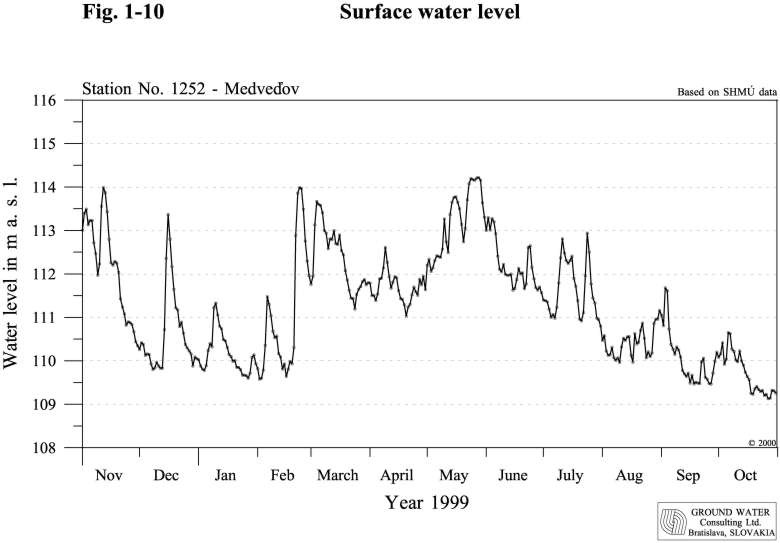
During the non-vegetation period in the hydrological year 1999 low water period was simulated in Mosoni Danube water supply as well. This was reached by redirecting a great part of the water in the seepage canal to the inundation area through the lock No. V, while the water amount taken from the Danube was reduced, even stopped. Besides the water supply function the lock No. I has also a flood protection function. It prevents floods to enter the flood-protected area. During the hydrological year 1999 there was no need to keep the lock closed. 1.4. Characteristics of the Danube on the Čunovo-Vámosszabadi stretchThe Danube stretch between Čunovo and Vámosszabadi can be divided into four different sections according to the prevailing influence. The characteristics of these sections are based on data obtained from the following gauging stations: Rajka, Hamuliakovo and Dunakiliti, Doborgaz and Dobrohošť, Dunaremete and Gabčíkovo, Vámosszabadi and Medveďov. The four sections on the Čunovo-Vámosszabadi stretch are the following:
|
|||||||||||||||||||||||||||||||||||||||||||||||||||||||||||||||||||||||||||||||||||||||||||||||||||||||||||||||||||||||||||||||||||||||||||||||||||||||||||||||||||||||||||||||||||||||||||||||||||||||||||||||||||||||||||||||||||||||||||||||||||||||||||||||||||||||||||||||||||||||||||||||||||||||||||||||||||||||||||||||||||||||||||||||||||||||||||||||||||||||||||||||||||||||||||||||||||||||||||||||||||||||||||||||||||||||||||||||||||||||||||||||||||||||||||||||||||||||||||||||||||||||||||||||||||||||||||||||||||||||||||||||||||||||||||||||||||||||||||||||||||||||||||